

This text has been translated by a machine and has not been reviewed by a human yet. Apologies for any errors or approximations – do not hesitate to send us a message if you spot some!
Introduction
Globalisation refers to the growing interconnection of economies and populations, as evidenced by the increase in trade in goods and services, as well as in the flow of capital and information and human migration. While historians and economists have identified several periods of significant intensification of trade between human societies (see box below), the phenomenon has now reached an unprecedented scale. The period stretching from the aftermath of World War II to the present day has been marked by a continuous deepening of globalisation, first in its commercial dimension and then in its financial dimension. It is also characterized by the unprecedented expansion of global value chains dominated by multinational corporations. It is driven by a narrative about the superiority of free trade, which is supposed to bring peace and prosperity to the greatest number of people. While this promise has been partially fulfilled—notably with the lifting of nearly one billion people out of extreme poverty and the economic development of certain Asian countries, particularly China—we will see that these benefits have been distributed very unevenly. Globalisation has prevented neither conflicts nor the persistence of power imbalances between profoundly unequal actors. It has been brutal for many actors—and for the planet.
In this module, we focus on the commercial aspect of globalisation and, to a lesser extent, on the financial aspect (to learn more about the latter, see our module “The Role and Limits of Finance”). We do not address the issue of migration (whether voluntary or involuntary) or the cultural aspect.
One or more forms of globalisation?
Historians have identified several phases of globalisation. In particular, we can distinguish the following:
- “Archaic” Globalisation: From the Bronze Age to Around the 15th Century1. A study published in 20202 revealed, for example, that contacts existed between Southeast Asia and the eastern Mediterranean basin in the 2nd millennium BCE.
- This was followed by a form of proto-globalisation linked to European expansion (colonization, transatlantic trade).
- The Industrial Revolution was also accompanied by a form of globalisation, dominated by England.
- And finally, modern globalisation, since the end of World War II.
It should be noted that this (approximate) historical division reflects a Western perspective. In the 1970s and 1980s, sociologists, historians, and economists proposed the concept of “world-systems,” which highlights the existence of vast spheres of international trade.3
Economists view globalisation as having begun in the aftermath of World War II and having intensified starting in the 1980s, with the liberalization of trade in goods, services, and capital. They also identify an earlier wave of globalisation that took place between the 1860s and World War I.
Learn more: “Going Back to Tang Dynasty China,” by Philippe Norel, Alternatives Économiques (January 1, 2014).
The essentials
Globalisation is characterised by the growth of trade
As we saw in the introduction, economic globalisation is characterized by the growing interconnection of economies due to the expansion of the flow of goods and services, capital, people, and information. Here, we focus on the trade dimension of globalisation and its continuous development since World War II.
Up until the 1970s, international trade was dominated by developed countries
From the late 1940s through the 1970s, international trade in goods experienced very strong growth: in terms of volume, exports increased by more than 8% on average each year during that period.
Between 1950 and 2024, global merchandise exports increased more than 45-fold
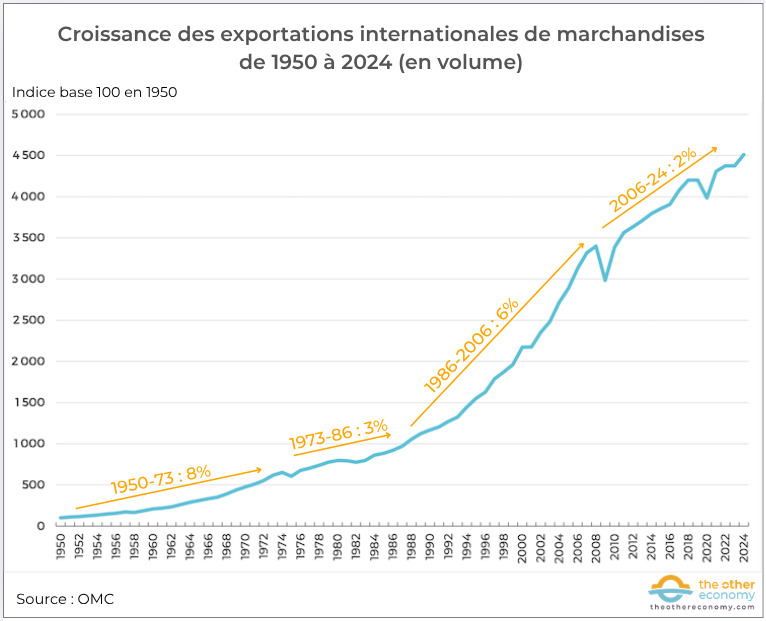
Source: Trade Trends within the WTO: Useful WTO Statistics (accessed in August 2025).
- The WTO’s merchandise export volume index is designed to provide an approximate measure of changes in the quantities of goods traded: the value of exports (in current dollars) is adjusted to account for inflation and exchange rates.4
- The orange text and arrows indicate the average annual growth over a given period.
Global trade is largely dominated by developed countries (particularly the United States, Western European countries, and Japan), which account for more than two-thirds of world trade. Developing countries—including those in Asia and Africa that are gradually gaining independence in the wake of waves of decolonization—are largely confined to exporting primary products (agriculture, extractive industries) to developed countries.
Share of Developed Economies in Global Production and Exports, 1870–2016
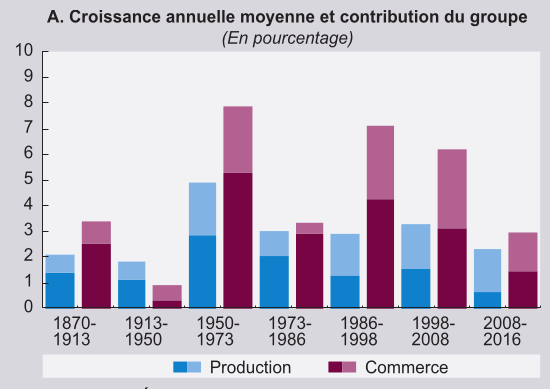
Source: Trade and Development Report 2018, UNCTAD.
Note: The darker areas represent the contribution of developed countries to the corresponding global totals; the lighter areas represent the contribution of developing countries.
Several factors account for this strong growth in international trade:
- the reconstruction needs of Western Europe and Japan following World War II, thanks in particular to the Marshall Plan;
- The emergence and expansion of the multilateral framework for free-trade negotiations: The signing of the General Agreement on Tariffs and Trade (GATT) by 23 countries in 1947 was followed by several rounds of negotiations involving an increasing number of countries, with the aim of reducing tariffs in a growing number of sectors 5;
- the creation of the European Economic Community (EEC) in 1957 and the establishment of a customs union in 19686 which led to an acceleration of trade among the original member states7 ;
- From a technical standpoint, the invention of the container and its growing use represent a major innovation.
The 1980s have ushered in an era of hyper-globalisation
Following the crisis-ridden years of the 1970s and 1980s, marked by a sharp economic and trade slowdown (see Essential 2.1), a new period of expansion began. Often referred to as “hyper-globalisation,” this period was characterized by a very sharp increase in trade as well as in international financial flows (see Essential 2).
As we explain in detail in Essential 3 on global value chains8, this expansion is the result of several factors. The crises of the 1970s and 1980s led to the rise to power of governments committed to neoliberal ideas in developed countries. The focus is now on opening up capital markets and deepening the international framework for free trade, first at the multilateral level with the creation of the WTO, and then through the proliferation of trade and investment agreements. Geopolitical developments—such as the end of the Cold War, the deepening of European integration, and China’s entry into the globalized economy—also contribute to trade growth. Finally, technical advances in transportation and the advent of information and communication technologies would enable the unprecedented development of global value chains and, consequently, international trade.
A trade boom hard to measure accurately
Between 1995 and 2024, the value of global exports of goods and services increased more than fivefold9. However, while growth remained strong during the 1990s and 2000s, the 2008 crisis marked a turning point, with a sharp decline in average annual growth10 over that period.
Trade in services is growing faster than trade in goods
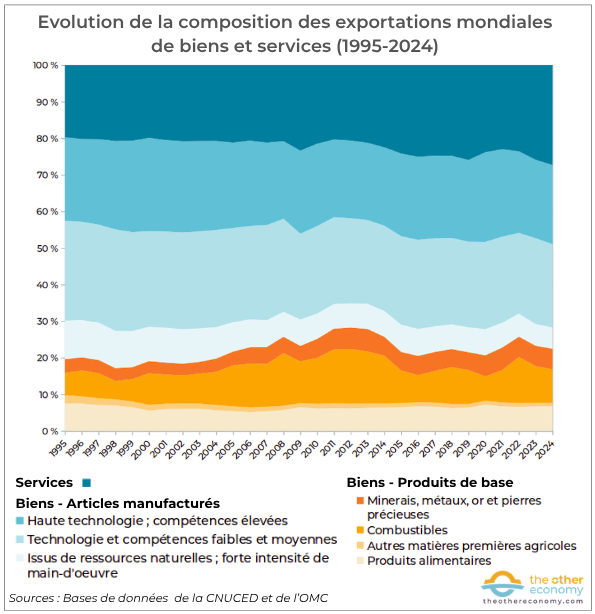
Source: For goods, UNCTAD database— Merchandise Trade Matrix; For services, UNCTAD database— Services (MBP6): exports and imports by service category, and the WTO database for the period 1995–2004.
Methodological note: Products are categorized according to the Standard International Trade Classification, Revision 3 (SITC Rev. 3) for commodities, and according to the subcategory “Grouping of manufactured goods by degree of processing” for manufactured goods. These classifications are available on the UNCTAD website (2025 version).
Several observations can be made.
- Exports of services are playing an increasingly important role: they rose from about 20 percent of the value of global exports of goods and services at the beginning of the period to more than 25 percent starting in the mid-2010s.
- The share of commodity revenues hovered around 20% over the period, with fluctuations in magnitude linked to changes in raw material prices (peaking at over 28% in 2012).
- The share of manufactured goods is declining significantly, falling from 60 percent of the value of global exports in 1995 to 50 percent in 2024, due in particular to the decline in the share of low- and medium-technology manufactured goods as well as those derived from natural resources.
While these figures reflect interesting trends, they should nevertheless be interpreted with caution. Indeed, developments in international trade pose formidable challenges for statistics for two main reasons.
The expansion of Global Value Chains (GVCs)
The compilation of international trade statistics is based on the crossing of a border. This allowed for a reasonable degree of accuracy as long as the goods exported by a country were primarily manufactured in that same country. However, the increasing fragmentation of production along global value chains11 has led to an increase in the share of imported intermediate goods and services used in the manufacture of goods that are subsequently exported. This results in double counting and, consequently, an overestimation of the value of global exports.
Let’s illustrate this with a hypothetical example. A French yogurt producer imports €1,000 worth of strawberries from Spain. He adds these strawberries to his yogurt, which he then exports to various countries (including Spain) for €4,000. International trade statistics show €5,000 in trade, since the value of the strawberries is counted twice (as strawberries themselves and as ingredients in the yogurt)!
Since the early 2010s, various studies12 have sought to develop trade indicators that measure domestic value added and foreign value added in a country’s exported goods.
The expansion of GVC (i.e., the dispersion of production across different countries) has manifested itself in most countries as an increase in foreign value added13 in exports of goods and services. Globally, this share rose from just under 20% in 1995 to more than 26% in 200814 at the onset of the financial crisis. It has remained at that level ever since.
The growth of the services sector
As we have seen previously, hyper-globalisation has led to the growth of trade in services.
The Increase in Global Exports of Trade Services Between 2005 and 2024
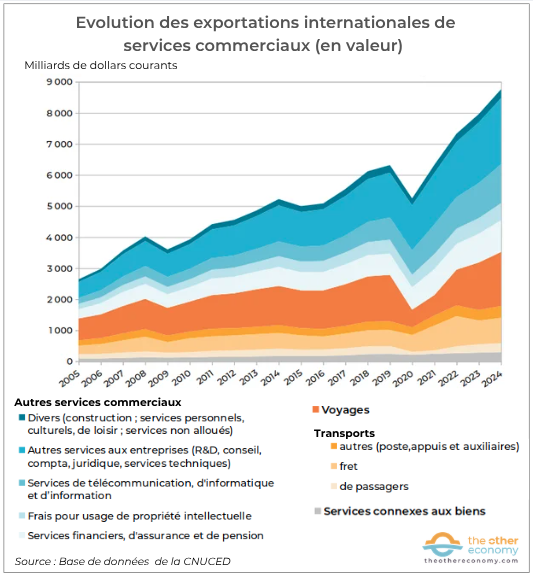
Source: UNCTAD Database Series— Exports and Imports by Service Categories.
Reading: Exported commercial services rose from 2,640 to 8,761 billion current-dollar units between 2005 and 2024.
Measuring trade in services poses significant challenges for official statistics: since most services do not involve the physical crossing of a border, they are recorded based on the place of residence of the company providing them. As a result, they are used by multinational corporations to evade taxes.
Trade in services and tax evasion
Goods physically cross borders, which makes it possible to classify them based on their type, quantity, origin, or destination. This is not the case for most services. While some have a physical component—such as tourism or transportation—many other services do not involve crossing borders and do not even involve individuals; they consist solely of intangible exchanges between companies. This is the case, for example, with financial and insurance services, franchise fees and trademarks, and software distribution licenses.
Because of this largely intangible nature, trade in services is not recorded in customs data but in the balance of payments15 based on the place of residence of the company providing them.
Such international transactions often constitute intra-company accounting techniques designed to avoid taxation. On the one hand, this distorts the measurement of the actual volume of international trade in services. On the other hand—and more importantly—it greatly facilitates tax evasion by multinational corporations. Indeed, the location of intangible assets (financial assets, patents, trademarks, design rights, logos) is one of the tools used by multinational corporations to minimize their tax obligations by “residing” their assets in tax havens. This can result in “phantom” trade flows of services16 that do not correspond to actual flows of services.
A growing share of traded services (particularly services deriving from intangible assets with no determined geographical location, such as financial loans or intellectual property rights licensing) represent intra-firm trade, much of which is used for tax optimization strategies of firms. […] Such trades often do not generate any production, employment and labour income in the low-tax jurisdictions where they are recorded, even as they siphon capital income and profit out of higher-tax jurisdictions.
The rise of China and the “Asian Tigers”
Starting in the 1980s, there has been a steady decline in the share of developed countries in international trade: in 2024, they accounted for approximately 52% of global merchandise exports (see graph) and 56% when services are included.17
Between 1948 and 2024, the share of developing countries in global merchandise exports rose from 32% to 48%
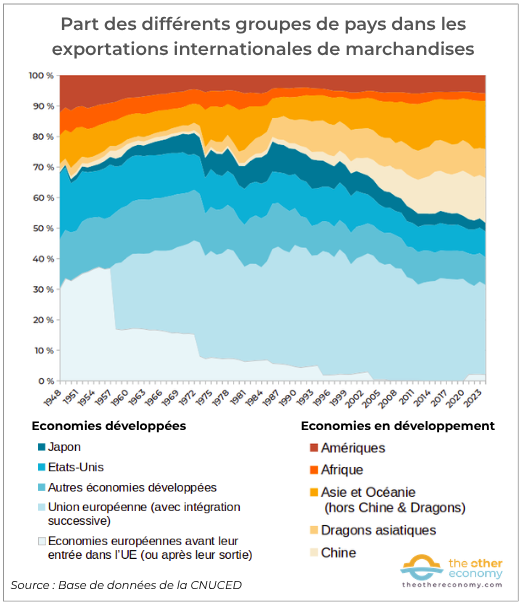
Source: UNCTAD Database Series— Goods: Total Trade and Share of World Trade
Methodological notes: The percentages are calculated based on the value of merchandise exports (expressed in current dollars).
For each group of countries, exports include both those between countries within the group and those with third countries.
The categorization of countries into advanced and developing economies is based on the UNCTAD classification (2025 version). South Korea, which has been classified as a developed country since 2021, is listed here among the developing countries (in order to highlight the “Asian Tigers”—South Korea, Taiwan, Singapore, and Hong Kong).
Since the 1980s, nearly all developed countries have seen their share of global trade decline.
- The European Union (including all member countries and the United Kingdom) appears to be a major trading power, but one that is losing momentum: its share of global exports has fallen from more than 43% in the early 1990s to about 31% in 2024.18
- The United States’ share declined steadily over the period, reaching about 8.5% around 2024. However, most of the decline in U.S. trade occurred during the Glorious Thirty.
- Japanese trade enjoyed its heyday in the 1980s and 1990s, when its share of world trade peaked at nearly 10 percent, before entering a long decline (less than 3 percent in 2024).
- “Other developed economies” include 22 territorial entities in 2024, with the top five accounting for 88% of the group’s exports (Canada, Switzerland, Russia, Australia, Norway). Their share has remained stable since the early 1990s, hovering around 9 to 10%.
Since the 2007–2008 financial crisis, many observers have been predicting the end of globalisation or even “deglobalisation”. An analysis of the data casts doubt on the reality of such a phenomenon. While the growth of international trade has paused, there has been no decline in trade flows. Furthermore, financial globalisation shows no signs of slowing down: whether we look at the volume of assets under management, stock market indices, the volume of derivatives, or foreign exchange transactions… All indicators of a thriving financial sector continue to rise. The growing influence of digital players on the global economy also runs counter to any notion of so-called “deglobalisation”. However, the growing tensions between China and the United States, the trade war initiated by U.S. President Donald Trump during his first term, and above all, the growing awareness of the vulnerabilities inherent in dependence on global value chains19 could lead to the relocation of certain production activities or, at the very least, to the regionalization of trade.
The economic expansion of developing economies, which is often highlighted, is in fact driven primarily by Asia.
This initially refers to the Asian Tigers (sometimes also called the first-generation Newly Industrialized Countries)20 whose economic takeoff was based on a strategy of developing industrial policies protected by tariff barriers specifically targeting products exported to developed countries. Their share of global merchandise exports began to rise in the 1980s and stabilized at around 10% in the 1990s.
China pursued a similar strategy beginning with Deng Xiaoping’s rise to power in the late 1970s. Its rapid growth accelerated after it joined the WTO in 2001. Having first become the “world’s factory” for manufactured goods, China has, since the early 2020s, established itself as a powerhouse in high-tech sectors (IT, AI, and green transition technologies). The value of its exports rose from less than 2% of global exports in the 1980s to nearly 15% in 2024. The world’s leading exporter since 2007, China is also the top trading partner (including both imports and exports) for nearly 60 economies worldwide.21
The group of “other developing economies in Asia and Oceania”comprises 43 territorial entities in 2024, with the top eight accounting for 76% of the group’s exports: these include the major oil exporters (the United Arab Emirates and Saudi Arabia), the Asian Tigers (Vietnam, Malaysia, Thailand, Indonesia22), India, and Turkey. Their share has doubled since the late 1980s, reaching approximately 15% of global exports.
The share of the rest of the developing world (that is, all of Africa and almost all of the Americas23) has remained steady at around 7% to 8% over the period. As explained in Preconceived Idea 3 regarding the supposed benefits of globalisation for developing countries, an analysis of export composition further shows that, for these countries, the share of exports directly linked to raw materials (primary products, fossil fuels, and manufactured goods derived from the processing of natural resources) is dominant. Over the entire period from 1995 to 2024, it accounted for more than half the value of exports from developing countries, excluding China and the Asian Tigers.
An analysis of export destinations confirms China’s dominant role in international trade between the North and the South
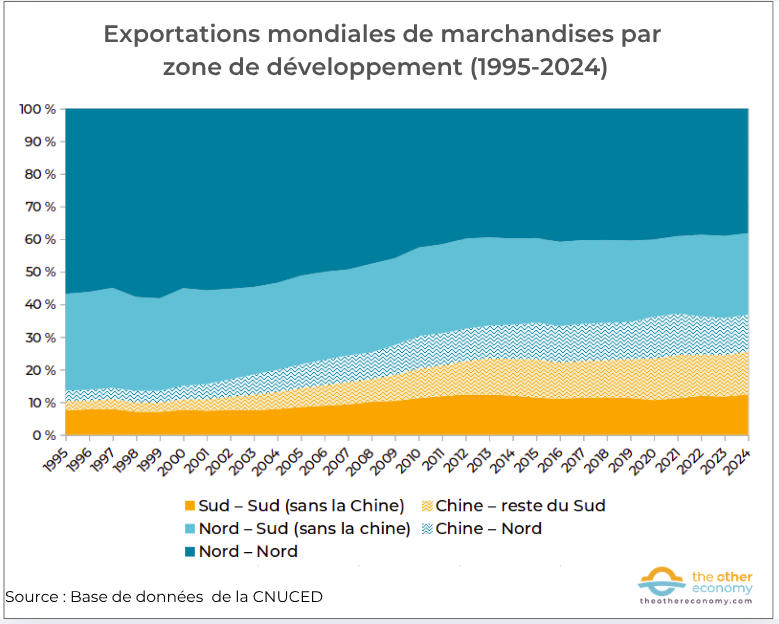
Source: UNCTAD database—Annual Trade in Goods Matrix. “The North” refers to developed economies, and “The South” refers to developing economies.
Reading: China’s exports to other countries in the Global South and exports from countries in the Global South to China rose from 3% to 13% of global exports during the period.
Between 1995 and 2024, North-North trade (in dark blue) declined (from 57% to 38% of global exports), primarily at the expense of South-South trade, which increased 2.5-fold over the period. However, most of this increase was accounted for by China, which also captured a growing share of North-South trade.
Find out more
- Trade and Development Report 2018, Chapter II—The shifting contours of trade under hyperglobalization, UNCTAD
- Illustrated album – The Crazy History of Globalization, Enzo, Isabelle Bensidoun, and Sébastien Jean, Les Arènes, 2021
- Roland Rajah and Ahmed Albayrak, “China versus America on Global Trade,” Lowy Institute, January 2025
- UNCTAD Database
Globalisation: the triumph of finance
Although trade globalisation began in the aftermath of World War II, it was not until the 1970s and 1980s that financial globalisation truly took off.
The end of the Bretton Woods system, combined with trends toward banking and financial liberalization and the opening of capital markets, led to a true financialization of the economy24. This is characterized by the increased influence of finance over the productive sector and by the rise in international financial flows. Numerous indicators point to this growing influence, whether in terms of the level of public and private debt, the importance of financial actors in corporate governance, or the growing disconnect between the financial sector and the real economy. This is evidenced, for example, by the growth in the stock of global financial assets, which has been significantly greater than that of GDP.25
The promise of this financial liberalization was to facilitate access to international financing for all stakeholders in order to promote growth and development. As we will see, foreign direct investment26 have indeed seen a marked increase. In particular, they have contributed to the development of global value chains27—and thus international trade—but also to the growing power of the multinational corporations that control them. It is, however, far from clear that the overall outcome is positive. The financialisation of the economy has, in fact, also had numerous harmful consequences, whether in terms of the proliferation of financial crises—including the global crisis of 2007–2008—or in terms of its impact on inequality and the strategic orientation of companies toward short-term profit.
From Bretton Woods to financial liberalisation
The failure to establish a stable monetary and financial system
While trade liberalization was certainly on the international political agenda in the aftermath of the war, the same could not be said for currency and capital flows. The 1944 Bretton Woods Conference28 established an international financial order aimed at stability: a system of fixed but adjustable exchange rates based on the convertibility of the dollar into gold, capital controls, and IMF support for the balance of payments29 of countries in difficulty. However, this system was neither flawless nor free of imbalances. Thus, the early stages of financial globalisation began to take shape during this period.
The “Eurodollar” market: the birth of offshore finance
In 1957, a seemingly innocuous decision by the Bank of England opened a loophole in the controls on cross-border capital flows. By allowing British banks to act as intermediaries between foreign economic actors conducting transactions in currencies other than the pound sterling (primarily dollars), it created the “eurodollar” market30 that was free from any public regulation. This marked the beginning of offshore finance.
As Ronen Palan, a professor of international politics, explains, “The Central Bank had just decided that transactions taking place in London could be considered as not having taken place in the City and would thus be exempt from British regulatory oversight. But since they were, in fact, taking place in London, the only public authority with the power to regulate them was the Bank of England 31!” This market quickly became the preferred vehicle for British and American banks, as well as multinational corporations, to circumvent their countries’ financial regulations.
Collapse of the Bretton Woods system
In monetary terms, the dollar’s dominant position in international trade—which stemmed from the Bretton Woods agreements—created a difficult situation for the United States32. To import (particularly American goods), countries must have dollars; therefore, the current account balance33 must be in deficit.
In the 1960s, the sharp rise in this deficit34 eventually created a mismatch between the dollars held abroad and U.S. gold reserves. In August 1971, President Nixon, faced with the depletion of these reserves, decided to suspend the convertibility of the dollar. A new system of floating exchange rates was formalized by the Jamaica Agreement in 1976. From then on, currency exchange rates fluctuated on the foreign exchange market based on supply and demand. This opened the door to speculation on currency exchange rates. Furthermore, the introduction of floating exchange rates, by creating a new risk (foreign exchange risk), also spurred the growth of the derivatives market.
The turn of the 1980s and the rise of neoliberalism
The end of the dollar’s convertibility into gold ushered in a period of international economic instability. The two oil crises of 1973 and 1979 caused a significant rise in oil prices, the negative consequences of which were felt across all economies (with the exception of oil-exporting countries). Developed countries entered a period of stagflation (the simultaneous occurrence of inflation and mass unemployment). Global growth slowed, falling from about 5% per year in the previous period to less than 3%.
In the face of economic difficulties, neoliberal ideas are gaining ground in political circles—on both the right and the left—in developed countries. The goal is to promote the market economy and the “open society” on a global scale while limiting public interventions that “disrupt” the economy. Financial liberalization, inflation control, fiscal discipline by governments, labor market flexibility, and the removal of trade barriers are all on the agenda.
Upon coming to power in 1979, the administrations of Ronald Reagan in the United States and Margaret Thatcher in the United Kingdom implemented this agenda at the national level and promoted it internationally. In Europe, the French Socialists promoted, within the European Commission, the deepening of the internal market and, in particular, the free movement of capital.
The neoliberal agenda is also being imposed on many developing countries, whose situations are deteriorating as a result of global economic shocks and interest rate hikes by the U.S. Federal Reserve35. In August 1982, Mexico announced that it could not meet its financial obligations, triggering the developing-country debt crisis that lasted throughout the decade. In exchange for their support, the IMF and the World Bank imposed “structural adjustment programs” on struggling countries in Latin America and Africa, including, among other measures, cuts in public spending, the opening of domestic markets to imports, and the free movement of capital.
An increasingly “free” world (for global finance)
In 2010, the IMF developed a financial liberalization index covering 91 economies over the period 1973–2005, which illustrates the extent of this phenomenon, particularly in advanced economies.
Financial Liberalization Index by Country Group, 1973–2005
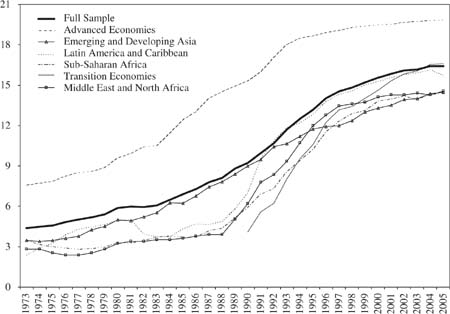
Source: Abdul d Abiad, Enrica Detragiache, Thierry Tressel, “A New Database of Financial Reforms,” IMF Staff Papers, 2010.
Reading: The index combines seven measures of financial liberalization, each scored on a scale of 3. An overall score of 21 indicates full financial liberalization.
The 7 parameters: credit controls, interest rate controls, barriers to entry for new banks in the domestic market, the share of public ownership in the banking sector, capital controls, prudential regulation and banking supervision, and public policies that restrict or encourage the development of financial markets.
It should be noted that, beyond deregulation measures, the development of new information and communication technologies has played a major role in the expansion of the financial sector. Digitization provides the physical foundation for financial globalisation, which could never have reached its current scale in the paper-based era—whether in terms of the speed and volume of transactions (further accelerated by fully automated high-frequency trading), data analysis, the increasing complexity of financial products, or the interconnection between financial markets.
Foreign Direct Investment: development, relocation and the fragmentation of production
Financial globalisation is based on multiple flows of capital between countries, which are often grouped into two categories36 :
- Portfolio investments are driven by financial investment strategies, or even speculation;
- Foreign direct investment (FDI) stems from a desire to influence the management of a company.
FDI has been a powerful driver of the development of globalised value chains37 and trade globalisation. They enable firms in developed countries to expand globally, whether by establishing subsidiaries abroad or by acquiring stakes in existing companies.
What is FDI (Foreign Direct Investment) also called IDI (International Direct Investment)?
Foreign direct investment (FDI38) are made by an investor (usually a company) in order to control the management of a company located in another country or to exercise “significant influence” over its management (holding at least 10% of the voting rights39).
Foreign direct investment (FDI) can serve several purposes: establishing a business entity (subsidiary, branch) abroad; acquiring equity interests (shares) in a foreign entity; expanding a subsidiary’s production capacity; or injecting funds to support it if it is in financial difficulty.
They can also fall under two types of strategies for the investing company (the two are often intertwined). Horizontal FDI involves establishing subsidiaries that produce goods identical to those of the parent company in order to enter a market and benefit from the same conditions as domestic producers. Vertical FDI involves spreading production across different countries to take advantage of differences in tax rates and production costs (particularly those related to social or environmental regulations).
Source: The OECD report OECD Benchmark Definition of International Direct Investment (5th edition, 2025) serves as a benchmark for the harmonization of statistics at the international level.
The line between FDI and purely financial investments has become increasingly difficult to draw as the economy has become more financialized. According to an IMF study, a significant portion of current FDI actually stems from aggressive tax optimization strategies by multinational corporations that artificially locate investments (particularly intangible assets40) in low-tax countries. Over the 2009–2017 period, 30% to 40% of annual FDI flows are estimated to be “phantom FDI”41.
FDI flows are largely dominated by developed countries
As can be seen in the graph below, FDI flows generally increased until the 2007–2008 financial crisis. They then remained relatively stable, hovering around $1,500 billion per year. Their trend also reflects the succession of booms and crashes in global financial cycles (e.g., the dot-com bubble and crash in 2000, the financial crisis of 2007–2008, the 2020 crisis following the COVID-19 pandemic). It is also worth noting that capital flows from developed countries are what drive the global cycle.
Trends in Foreign Direct Investment Flows from 1990 to 2024
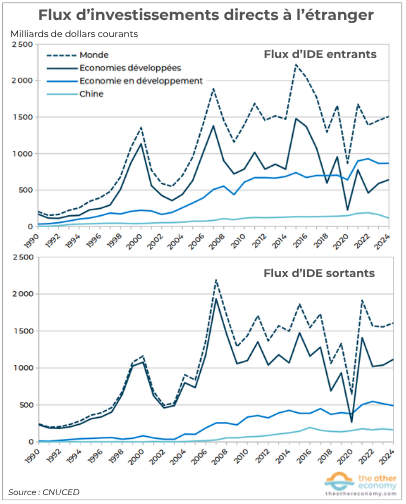
Source: UNCTAD database Foreign Direct Investment: Inbound and Outbound Flows and Stocks. For an interactive chart, see the FDI Explorer from the World Investment Report2025, UNCTAD
Reading: Inbound FDI flows (that is, FDI invested by foreign entities in a given country) rose globally from approximately $205 billion in 1990 to $1,508 billion in 2024. Outward FDI flows (i.e., FDI invested by domestic entities in foreign countries) rose globally from approximately $243 billion in 1990 to $1,609 billion in 2024.
The categories “developing economies” and “developed economies” correspond to the UNCTAD classification. See the classification of country groups and their composition (2025 version).
The data includes FDI flows between European Union countries.
FDI comes primarily from developed countries (mainly the United States, Japan, and the European Union), although this dominance has declined over the period (from 95% to 69% of outbound flows). Of particular note is China’s emergence as an international investor: starting in 2015, it accounted for around 10% of annual outflows.
Developed economies are the primary destination for FDI. In short, rich countries invest far more in other rich countries than in developing economies. However, this trend reversed around the turn of the 2010s and 2020s: FDI inflows into developing economies then became dominant. They are primarily directed toward countries in Southeast Asia, China, and, to a lesser extent, Latin America.
All these figures should be interpreted with caution because, as noted earlier, FDI flows can mask tax evasion or even tax fraud. For example, starting in 2006, the Cayman Islands and the British Virgin Islands accounted for a very significant share of FDI inflows into Latin America (ranging from a low of 31% in 2022 to a high of 94% in 201542). One might question the truly productive nature of these investments…
Foreign direct investment does not necessarily foster economic development
Inward foreign direct investment is traditionally viewed as a means of promoting economic development, particularly in developing countries, as it is believed to provide stable sources of external financing that supplement domestic resources.
However, this depends on several factors.
- The type of FDI: creation-oriented FDI (the establishment of new production capacity) is far more conducive to economic development than flows related to mergers and acquisitions or intra-company flows (which may be—and increasingly are—linked to tax optimization strategies).
- The sector: Investment in the primary sector (agriculture and extractive industries), which reinforces the specialization of many countries, does not have the same impact on economic development as investment in high-value-added manufacturing industries.
- FDI comes with a financial counterpart (interest payments, dividends, etc.) that can put recipient countries in a difficult position. As UNCTAD explains, it ” are accompanied by outflows of income in the form of repatriated profits, royalties, and license fees. These payments can result in negative financial transfers, particularly when FDI inflows fall significantly below those of previous years and payments must be made on a large stock of existing FDI. Countries that have been receiving FDI for a long time and therefore have a relatively large stock of foreign capital are the most likely to record negative net transfers. .”43
Finally, FDI accounts for only a portion of capital flows: as explained in Essential 4, the overall stock of foreign investment and the volatility of investment flows can have extremely destabilizing effects on the countries involved.
Find out more
- The ” Role and Limits of Finance ” module from The Other Economy
- The IMF working paper by Jannick Damgaard, Thomas Elkjaer, and Niels Johannesen on “phantom” FDI: “What Is Real and What Is Not in the Global FDI Network?”, 2019
- The World Investment Report, an annual report by UNCTAD
- The FDI Explorer, an interactive chart from UNCTAD’s World Investment Report 2025
- UNCTAD – Data Insights on Foreign Direct Investment
Globalisation is underpinned by the unprecedented expansion of global value chains
Starting in the late 1980s, international trade and financial flows skyrocketed. This period was also marked by the unprecedented expansion of global value chains (GVCs). Since the COVID-19 pandemic, a series of crises—whether health-related, geopolitical, or energy-related—has highlighted the dangers posed by this situation.
Definition: What is a global value chain (GVC)?
A value chain44 includes all the interdependent activities carried out around the world by various companies to take a product from its design to its final use.
Depending on the context, these activities may include research and development, design, the extraction and processing of natural resources, the manufacturing of various components, assembly, sales and marketing, distribution, retail, and end-of-life management. Value chains therefore involve the participation of several economic sectors45. Furthermore, the concept is much broader than that of a supply chain, which focuses on the provision of raw materials for production.
A GVC requires a high degree of coordination among the various stakeholders involved, coordination that is carried out by the multinational corporations that lead and control them.
Understanding the Value Chain
Philippe Gattet on XerfiCanal
A bit of history: where do global value chains come from?
Global supply chains have existed for a very long time. In their simplest form, they originated with bilateral trade: raw materials on one side and fully assembled manufactured goods on the other. The division of labor thus pits industrialized countries against developing countries and/or colonies: to put it simply, the extraction or cultivation of raw materials takes place in poor countries, while design, processing, assembly, and marketing occur in rich countries.
Starting in the 1980s, global value chains gradually began to take shape: the various stages of production are carried out in different parts of the world. The structure of trade became multidirectional, and intermediate goods (those used in or incorporated into the production process) played an increasingly important role.
Even the way we trade has changed immensely. In the past, goods were made in Mexico, or Mauritius or Malaysia. Today, goods are made in the world. The expansion of global value chains means that most products are assembled with inputs from many countries. Products cross borders frequently during various stages of assembly. […] Twenty years ago, the import content of exports was 20 per cent. Today, it is around 40 per cent. More than half of global manufactured exports are components which are inputs to other as yet unfinished goods. In Asia, the figure is more than 70 per cent.
Example from the automotive industry
The automotive sector is a good example of this trend and also illustrates just how simplistic Donald Trump’s decisions on tariffs in early 2025 were46.
Let’s take a broad look at the history of this industry in the United States to illustrate the growing fragmentation of value chains.
In the early 20th century, American automakers such as the Ford Motor Company adopted a vertically integrated production model. Design, manufacturing, assembly, and distribution all took place at the same site, most often in the Detroit area. The value created by the product therefore remained largely local, with the exception of imported raw materials such as steel and rubber. The Ford Model T, for example, perfectly illustrates this model, in which all essential activities took place in the United States.
After World War II, between the 1950s and the 1970s, the U.S. automotive industry began to gradually specialize. Manufacturers continued to concentrate the majority of their operations in the United States, but certain parts began to be produced by specialized suppliers located in Mexico, Japan, or Western Europe. This period marked the beginning of a regional fragmentation of operations, although American companies continued to capture the lion’s share of the value.
Starting in the 1980s, Ford, GM, and Chrysler began partially offshoring certain stages of production, notably assembly in Mexico and the manufacture of electronic components in Asia. Design and R&D remained concentrated in the United States, but the value captured locally declined proportionally.
In the 2000s and 2010s, automotive value chains became truly global. An American car, such as the Ford F-150 or the Chevrolet Bolt, is now made up of components sourced from at least ten different countries. Electronic systems may be manufactured in China, South Korea, or Japan; transmissions or mechanical parts come from Europe or Mexico; the batteries for electric vehicles—which are increasingly common—involve raw materials from Australia, Chile, and China, as well as Chinese companies such as CATL and BYD. Final assembly often takes place in the United States or Mexico.
How significant are global value chains in international trade?
This question is harder to answer than it seems. In fact, the trade flows reported in trade statistics are estimated on a gross basis: when a good crosses a border, the full price of the good is reported. Since exported goods increasingly consist of goods and services that were previously imported, this leads to double counting and, consequently, an overestimation of the overall value of international trade.
Furthermore, these figures do not allow us to distinguish between purely bilateral trade and trade involving GVC. That is why, since the 2010s, various studies have sought to assess the value added by each country to the final value of a good. This makes it possible to determine the share of GVC in global trade, as shown in the following graph.
Trade involving GVC accounted for nearly half of the value of global trade in 2024
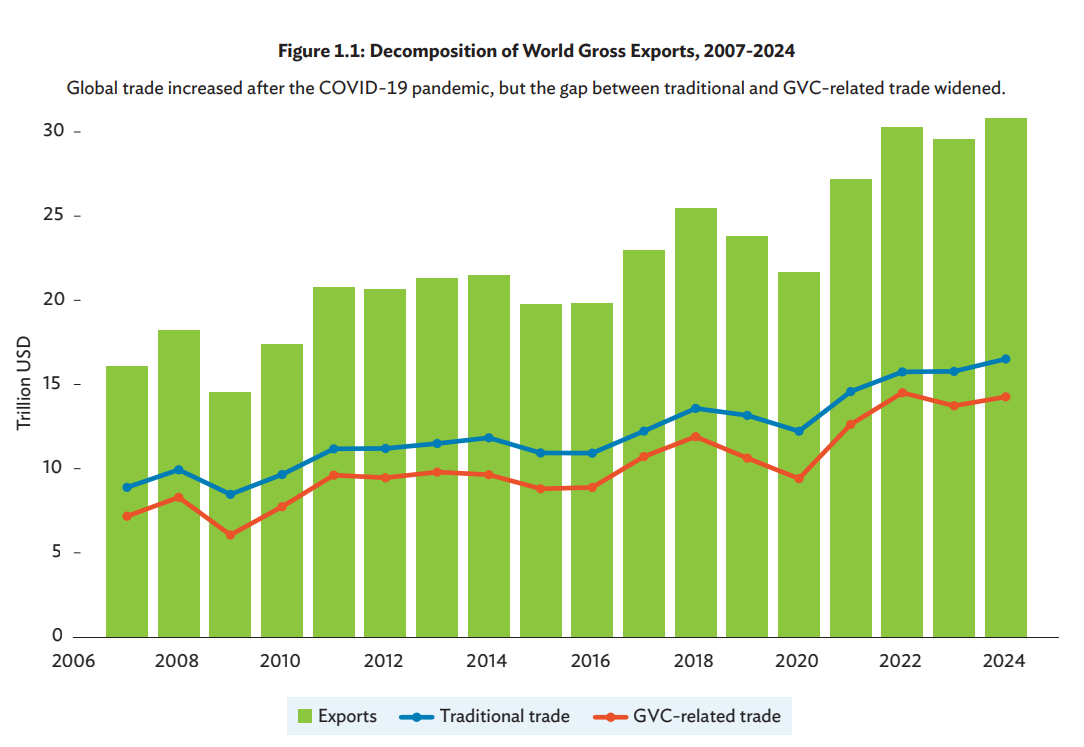
Source: Global Value Chain Development Report 2025, WTO, using the analytical framework developed by Alessandro Borin and Michele Mancini in Measuring What Matters in Global Value Chains and Value-Added Trade, Policy Research Working Paper, World Bank, 2019.
Note: Traditional trade (blue line) refers to the value of gross exports related to purely bilateral trade. Trade linked to global value chains (red line) refers to the value of gross exports involving multiple border crossings.
Several factors have contributed to the expansion of GVC
The development of global value chains stems from a combination of several factors. First, there is the political and economic context linked to the neoliberal revolution of the 1980s, as well as geopolitical developments such as China’s accession to the World Trade Organization and the collapse of the Soviet Union. Technical factors, such as falling transportation costs and the development of digital technologies, have also played an important role. Finally, multinational corporations—which lead global value chains and organize them on a global scale—have been instrumental in their development.
Global value chains are dominated by multinational corporations
GVC are organized and controlled by multinational corporations through the establishment of subsidiaries abroad and the outsourcing of part of their production to suppliers or subcontractors in various parts of the world. These companies, their executives, and their shareholders dominate international trade and are the big winners of globalisation.
This dominance is accompanied by numerous negative consequences, whether in terms of income and wealth inequality in developed and developing countries, on the distribution of value within the supply chain between lead companies and their suppliers and service providers, or on the scope governments have to implement public policies.
The ability of multinational corporations to relocate factories and jobs has significantly weakened the bargaining power of unions and governments. Globalisation has thus been accompanied by increased tax, social, and environmental competition among countries around the world.
The imbalance of power between the companies at the head of the GVC and their suppliers and subcontractors results in lowest-bid purchasing practices, limiting the latter’s ability to innovate and move upmarket, as well as to raise wages or improve working conditions.
Finally, multinational corporations—most of which are headquartered in developed countries—have found themselves in a privileged position to influence international trade rules and to reorganize the production process to their advantage, thereby creating opportunities to expand their cost-reduction strategies on a global scale.
It should be added that financial globalisation increases the power of capital owners over both the economy as a whole and multinational corporations themselves. Hyper-globalisation goes hand in hand with the rise of ideologies and practices that aim to make profit maximization for the benefit of shareholders the primary role of corporations, which poses numerous problems for the long-term viability of the corporations themselves, the environment, and society.
The entry of new countries into the global economy
At the turn of the 1980s and 1990s, Deng Xiaoping’s transformation of China into a “socialist market economy” and the collapse of the USSR and “Eastern Bloc” marked the triumph of the free-market economy.
Almost every country in the world was then entering the era of globalisation. China’s rise has been one of the defining trends of recent decades. Relying on an abundant and inexpensive labor force, the country developed an economic strategy based on opening up to foreign investment, followed by trade (with its accession to the WTO in 2001), while maintaining significant government control (targeted industrial policies, management of trade liberalization, and currency controls). This strategy first enabled China to become the “world’s factory” and then to move up the value chain by developing industries with higher value-added. Today, China clearly poses a threat to Western economies47 in all areas.
The continued development of European integration and the deepening of the internal market were another major milestone of this period. With the Maastricht Treaty (1992), the EEC became the European Union and adopted a common currency, the euro. Successive accessions (19 new countries between 1973 and 2013) expanded the EU’s single market, making it the world’s largest free-trade zone, where goods, services, capital, and workers move freely. The integration of Eastern European countries provided a pool of low-cost labor that fueled value chains, such as the automotive industry, where Western European multinationals have a strong presence.
Free movement of capital and greater trade liberalisation
The neoliberal ideological shift of the 1970s and 1980s was accompanied by numerous measures aimed at opening up capital markets and liberalizing trade.
- The opening of capital markets and the proliferation of investment protection agreements48 have led to an unprecedented growth in foreign direct investment49 and thus facilitated the entry of multinational corporations into new countries, whether through the creation of subsidiaries or the acquisition of stakes in domestic companies.
- The expansion of MTCs is closely linked to changes in the legal framework of international trade. Launched in 1986, the Uruguay Round of negotiations led to the creation of the World Trade Organization in 1995, which, paradoxically, also marked the end of multilateral trade negotiations (the Doha Round, launched in 2001, would not result in any new agreements). Beginning in the 1990s, bilateral and regional trade agreements proliferated, as did investment protection agreements. Among the major regional trade agreements, NAFTA is particularly noteworthy50 signed in 1994 between Canada, the United States, and Mexico. The content of the agreements also changed: whereas previously the focus had been primarily on reducing tariffs, it now centered on non-tariff barriers51. This concern is linked in particular to the need for multinational corporations to harmonize regulations (most often by lowering standards) to facilitate the standardization of technical norms with which their various suppliers around the world must comply.
Innovation and cost reductions in the transport sector
While the reduction in costs affects all modes of transportation, it is crucial for the maritime sector, which accounts for approximately 80% of the volume of goods traded worldwide52. In this regard, the container revolution has played a decisive role. More generally, progress has been made in adapting ships to the types of cargo they carry53 have greatly facilitated trade. Finally, the rise of flags of convenience beginning in the late 1960s also contributed to lower costs by allowing shipowners to circumvent social and environmental standards and engage in tax optimization.
The Container Revolution
Containers first appeared in the United States in the 1950s, but did not become widespread in international trade until the late 1960s. Container shipping then became widespread, as did the size of ships: by 2024, more than 183 million TEUs54—that is, 6 billion cubic meters—were shipped worldwide. Today’s giant container ships can carry nearly 800,000 cubic meters of cargo…
Containers allow for better organization of ships and the automation and mechanization of tasks, which reduces the time it takes to unload cargo and, consequently, shortens port calls and alleviates port congestion. Labor requirements—and consequently the costs and bargaining power of dockworkers (particularly their ability to call strikes)—have also decreased. Finally, containerization has enabled the development of “multimodal hubs” that facilitate the transfer of cargo from ships to trains and, most importantly, to trucks. Port infrastructure has adapted to this shift toward mass cargo handling to become fully integrated logistics hubs, sometimes covering several dozen square kilometers—such as the port of Rotterdam, which spans 126 squre kilometers.
Source: Arnaud Serry, How the Container Is Changing the Face of the World, The Conversation, 2025. See also The Box: How the Container Changed the World, by Marc Levinson and Max Milo, 2011. The World in a Box: The History of the Container, Les Echos, 2014.
New Information and Communication Technologies (NICT)
The development of information and communication technologies (ICT) has made it easier and less expensive to manage very large and complex production networks. Management software, GPS, barcodes, and, more recently, chips embedded in products (or packaging), as well as artificial intelligence systems (algorithms) related to the collection and analysis of big data, are all indispensable tools for managing GVC, whether for tracking goods, managing supply chains and procurement, or marketing and selling products.
The digitization of the economy has also led to the emergence of new global players that have become indispensable to all GVC, whether by providing the infrastructure, products, and services of the digital economy (data centers, microprocessors, computers and cell phones, internet services, hosting, software, cybersecurity protocols, etc.) or by adding an additional layer to global production systems—or even, at least in part, replacing traditional players—through the development of the platform economy (e-commerce, fintech, on-demand ride-hailing platforms).
The largest of these players55—the American Big Tech companies and a few very large Chinese firms—now dominate the global economy in terms of market capitalization, revenue, and profits.
The recent series of crises has highlighted the dangers associated with the expansion of GVC
In addition to the factors listed above, the expansion of GVC was also based on relative stability in the international order56. This stability, already put to the test during the 2008 financial crisis, deteriorated significantly at the turn of the 2020s. The COVID-19 pandemic and the invasion of Ukraine demonstrated just how fragile GVC could be, jeopardizing the economic security of many countries.
Four major risks, in particular, have become apparent.
Disruption or failure in a critical link
International trade and, more broadly, the global economy depend on critical hubs such as Chinese ports and the 14 straits and canals57—essential chokepoints for international trade. This reality was very well articulated in reference to the Strait of Hormuz by Ahmed Al-Jaber, Minister of Industry of the United Arab Emirates and CEO of ADNOC, the national oil company, in a video sent in March 2026 for CERA Week, the annual oil and gas industry conference held in Texas.
The world’s critical arteries must remain open. The Strait of Hormuz is one of those arteries: 21 miles wide, 20 million barrels per day, nearly one-fifth of the world’s oil and gas, over a third of the world’s fertilizers, almost a quarter of the world’s petrochemicals, and significant amounts of industrial metals. In short, much of the oxygen of the global economy runs through a single throat.
Geopolitical, natural, health-related, or logistical events affecting these strategic hubs can paralyze entire value chains. The COVID-19 pandemic, which disrupted the production and transport of many goods, is the most extreme example of this, but it is far from the only one.
Since the early 2020s, vulnerabilities in strategic waterways have regularly made headlines. These vulnerabilities can be exposed by geopolitical events. Starting in 2023, attacks by Yemen’s Houthis—against the backdrop of the war in Gaza—on cargo ships crossing the Red Sea58 divert a significant portion of the traffic passing through the Suez Canal, thereby lengthening transit times for many goods. The closure of the Strait of Hormuz following the U.S. and Israeli attack on Iran in February 2026 prevents the export of fossil fuels, fertilizers, and even helium (a strategic gas for microprocessors) from countries in the region. This situation raises fears of a new massive energy, food, and industrial crisis.
Weather events—which will only worsen as the climate warms—can also block strategic waterways and disrupt traffic. This is how the Ever Given, a massive container ship, ran aground in the Suez Canal in March 2021 following a sandstorm, blocking traffic for nearly a week59. Traffic through the Panama Canal is regularly disrupted by drought60.
These vulnerabilities expose global trade to disruptions and additional costs. Cyberattacks on ports or critical infrastructure pose an additional risk.61
Loss of control over strategic production
When countries or companies do not have control over critical stages of production, this can lead to a loss of economic sovereignty. In France, approximately 40% of industrial inputs come from abroad62. Drug shortages63 and semiconductors64 are concrete examples of this. The war in Ukraine has also caused fertilizer shortages, while food crises in the United States and Cuba demonstrate the fragility65 of critical food supply chains. This dependence is even more critical for Europe in the digital and financial services sectors.
In light of these risks, some companies and countries are reevaluating the benefits of extreme fragmentation in global value chains. According to researcher Philippe Silberzahn66, the current context is driving a return to vertical integration: securing strategic production by bringing critical stages in-house—from design to final assembly—in order to reduce dependence on foreign suppliers and strengthen resilience in the face of crises. This model applies equally to digital technologies and traditional sectors, such as the automotive and pharmaceutical industries, and could mark a major turning point in the future organization of global value chains.
Economic interdependence can become a tool for exerting geopolitical pressure
India’s economic dependence on China has increased dramatically over the past two decades and has become a geopolitical lever wielded by Beijing. Today, China is India’s largest trading partner, with more than $120 billion in merchandise imports in 2024, and India’s trade deficit with China has risen from about $60 billion in 2020 to roughly $100 billion in 202467. More than 90% of these imports consist of intermediate goods and production inputs: electronic components, machine tools, integrated circuits, electrical equipment, and active pharmaceutical ingredients for drug and vaccine manufacturers. Chinese imports are therefore essential to India’s industrial production and its own exports (primarily to Europe and the United States). This is the case, for example, with iPhones, which account for 35% of India’s electronics exports and for which 95% of the components needed for their manufacture come from China. Similarly, while India is the “pharmacy of the world” —it produces 60,000 generic drugs, with sales of $42 billion—it is dependent on China, which supplied two-thirds of the active pharmaceutical ingredients used by the Indian pharmaceutical industry in 201968.
This trade structure creates a strategic vulnerability. When, in 2023, India attempted to impose controls on laptop import licenses to protect its domestic industry, opposition from Indian manufacturers in the sector forced it to back down, demonstrating just how deeply economic actors are entangled in these value chains69. More broadly, this dependence provides Beijing with leverage for political pressure : New Delhi’s need to ensure access to Chinese components limits its room to maneuver in border or diplomatic disputes with China and pushes India to seek a compromise in its bilateral relations, even after recent military clashes such as those in 2020 in the Galwan Valley.
The situation in India clearly illustrates how value chains can create structural dependencies that become tools for geopolitical pressure: a country whose economy depends on key components or products imported from a rival may find itself forced to moderate its political positions or make concessions, at the risk of losing some of its strategic autonomy.
Shift from economic partner to enemy
As early as the 1960s and 1970s, the USSR began exporting natural gas to Western Europe, particularly to Germany and Italy. Despite ideological tensions between the blocs, long-term energy contracts were signed: Europe needed competitively priced energy, and Moscow needed foreign currency. After the collapse of the USSR in 1991, Russia further strengthened its role as a supplier of fossil fuels to Europe. In the 2000s, under President Vladimir Putin, gas and oil exports to the European Union rose sharply. Major projects such as the Nord Stream gas pipeline, which began operations in 2011, symbolize this growing energy interdependence.
Russia has therefore been a strategic energy partner for Europe for about fifty years. Given the central role of energy in the economy, it can be said that Russia played a significant role in the economic interdependence resulting from globalisation. Since the invasion of Ukraine in 2022, Russia has been viewed as a geopolitical adversary.
This development illustrates the vulnerabilities of globalisation based on fragmented value chains and strong interdependencies: what was once a driver of economic cooperation can, in times of geopolitical crisis, become a means of exerting pressure and a major risk to the security, sovereignty, and stability of the states concerned.
Find out more
- The WTO’s Global Value Chains Dashboard
- The WTO’s Global Value Chains Portal (including its annual report on the development of global value chains)
- Research conducted by the Global Value Chain Initiative
- Facing Uncertainty: The Great Comeback of Vertical Integration, Philippe Silberzahn, Elucidations, 2025
- Multinational corporations and the ultra-wealthy are the undisputed winners of globalisation —in Essential 8 of this module
- The Geopolitics of Straits, Pauline Pic and Frédéric Lasserre, Editions du Cavalier Bleu, 2025
Monetary power is key in a globalised world
Currency exchanges between countries or regions with different currencies are governed by a set of implicit or explicit rules, which constitute the international monetary system (IMS). It lies at the heart of globalisation, as it is essential to the existence and growth of the international flows of goods, services, investments, capital, and income that characterize it.
As economist Éric Monnet writes:
In the 1990s, the prevailing view was that of a world in which the international monetary system would function almost automatically, governed by free capital flows and flexible exchange rates.
The argument was that this system would be of the greatest benefit to everyone: capital would flow to where investments were needed, and exchange rate fluctuations71 would automatically rebalance the current account72, and central banks could focus on stabilizing inflation.
It must be acknowledged that this vision has not come to pass. The dominance of the U.S. dollar, floating exchange rates, and the free movement of capital have been (and continue to be) sources of numerous imbalances, whether in terms of trade or financial crises.
Not all currencies carry the same weight in the international monetary system
If there are just over 150 currencies in the world73, not all carry the same weight in the international system. Their respective strength stems both from history (which largely explains the dollar’s dominance) and from the economic importance of the countries where they are legal tender.
Which currencies are used most often?
The importance of a motto can be assessed by how it is used in various fields:
- its role in foreign exchange reserves74 of the various states;
- its use for international payments (trade in goods and services, foreign direct investment, income flows);
- its use for issuing debt (many countries cannot issue debt in their own currency).
The more a currency is used for these three purposes, the more it is traded on the foreign exchange market75.
International Share of Major Currencies in 2022 (in %)
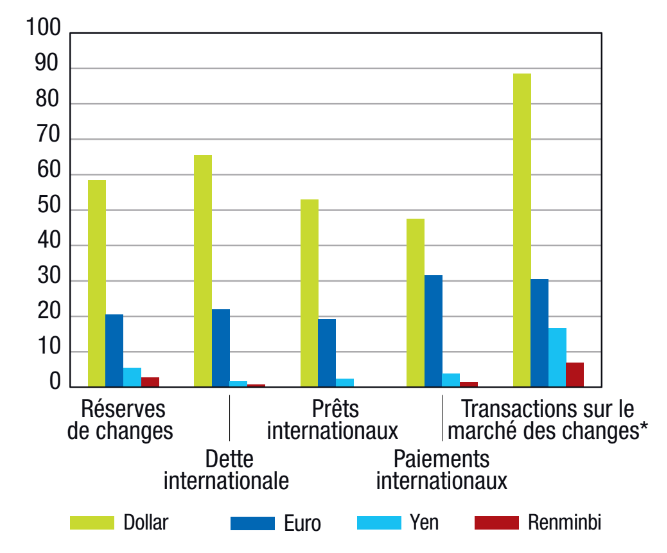
Source: The International Monetary System, “L’Éco en bref,” Banque de France, 2023
* Since foreign exchange transactions always involve two currencies, they are accounted for as a total of 200%.
It is, of course, the dollar that dominates the international monetary system in all these areas. The other currencies that play a significant role are primarily the euro, the Japanese yen, the Chinese renminbi, and the British pound.
The fact that a currency is widely used provides economic actors in the country in question with advantages, whether in terms of participating in international trade or accessing global financial markets.
In our module on public debt and deficits, we explain in detail the issues surrounding the fact that some countries can incur debt in their own currency while others cannot. Below, we focus on international payments.
The advantages of a currency used in international payments
Made by economic agents in two different countries, international payments cover a wide range of activities: commercial transactions between customers and suppliers, payment of taxes to foreign governments, foreign investments, transactions between different entities of a multinational corporation, repatriation of dividends or interest, compensation for international employees, etc.76
As can be seen in the following chart, some currencies are used significantly more than others. In particular, the dollar plays a dominant role, accounting for nearly 50% of payments in 2025.
Share of the major currencies used in international payments
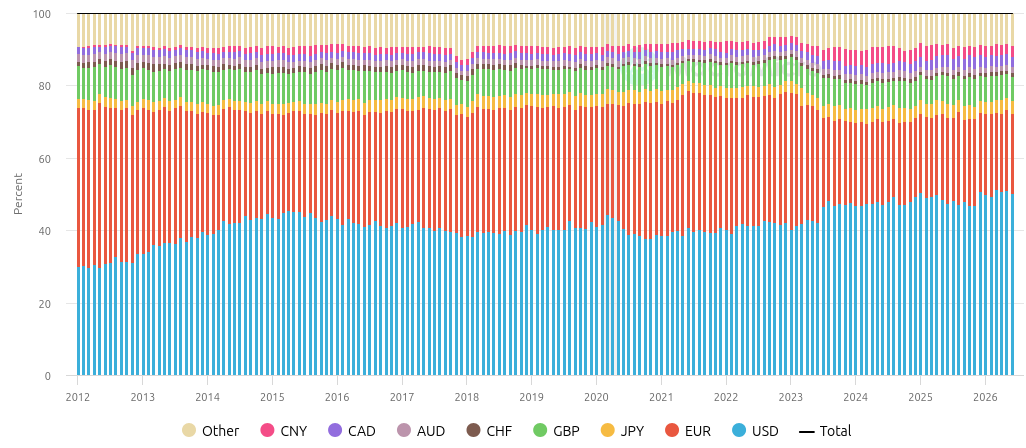
Source: MacroMicro website
Notes:
– The payments included here are those made via SWIFT77.
-The euro’s share is overestimated here because trade between eurozone countries is included.78
In practical terms, how do international payments work?
Let’s imagine that a French exporter sells wine to a Brazilian importer and asks to be paid in euros.
If the latter accepts the offer, he has two options:
- either he has a euro account and can therefore pay using it;
- Either he must obtain euros to pay the French contractor (by asking his bank to exchange his reais for euros).
The second scenario entails a cost for the Brazilian importer because foreign exchange transactions often involve multiple intermediaries in addition to the importer’s bank79. Furthermore, the importer assumes an exchange rate risk because the exchange rate80 between the real and the euro may fluctuate between the time the order is placed and the time payment is made. The importer may seek to hedge this risk, which also entails a cost.
It should be noted that these various costs and risks affect the competitiveness of the French producer’s bid. If competitors submit a bid in reais, they may win the contract. In that case, it will be up to them to assume the various risks.
As is well understood, the more a currency is used for international payments, the easier it is for economic actors in the country in question to engage in international trade. This is obviously true of the dollar. It is also true, to a lesser extent, of the euro.81
The difficult situation faced by countries with an unstable or little-used currency
Some countries have weak currencies or currencies with little demand: their exchange rates are so low and erratic that they prevent any imports. In extreme cases, these currencies are non-convertible.
What is currency convertibility?
The convertibility of a currency refers to the degree of ease with which it can be exchanged for other currencies on the foreign exchange market.
A currency is convertible when it can be bought and sold on the foreign exchange market without major restrictions or controls by monetary authorities. There are currently just under twenty such currencies82 , the main ones being the U.S. dollar, the euro, the yen, the British pound, and the Australian and Canadian dollars.
A partially convertible currency can be exchanged for foreign currencies on the foreign exchange market, but in volumes limited by the country’s monetary authorities. Today, most currencies are convertible for transactions involving goods, services, income, and current transfers. However, in many countries, international capital flows are controlled (purchases of stocks, real estate, and loans). This is the case, for example, with the Chinese renminbi: although it is playing an increasingly significant role in international trade, capital flows are still subject to administrative approvals.
A currency is non-convertible when it cannot be bought or sold on the foreign exchange market. In this case, any party wishing to buy or sell that currency must go through the issuing central bank, which decides whether or not to allow the transaction at a rate it sets unilaterally. Non-convertible currency systems are generally characterized by the existence of black markets for foreign exchange.
A currency’s vulnerability can result from many factors
Some factors relate to the structure of the issuing country’s economy. A country that is dependent on raw materials (agricultural or mineral) and energy resources and lacks economic strengths is structurally an importer. Its currency will therefore be in little or no demand. Next, factors related to the conduct of economic and monetary policy come into play. Political instability, rampant corruption, or excessive inflation do not inspire confidence. Finally, external shocks—whether or not they are linked to global crises (such as oil shocks, financial crises, or the COVID-19 pandemic)—can weaken a country’s currency.
A fragile currency—one with low demand or low credibility—limits international trade and investment; it increases the cost and risk of external financing. It heightens the country’s vulnerability to exchange rate crises and imported inflation and makes monetary policy less effective. In short, it reduces a country’s autonomy and its ability to develop.
What we see here, then, is a kind of vicious cycle of underdevelopment: a country that needs others to develop and is viewed as fragile may find itself stuck, unable to attract the foreign capital it so desperately needs.
What are the links between foreign trade, capital flows, and currency?
Economic ties between countries are manifested through the exchange of goods, services, and capital83. The relative value of different currencies is a key factor in this. The question of the balance of these exchanges is also crucial: current account balance84, as well as an economy’s greater or lesser vulnerability to capital flows.
What is the exchange rate, and how does it affect the economy?
A currency’s exchange rate plays a decisive role in a country’s relations with the rest of the world.
What is the currency exchange rate?
The exchange rate of a currency is its price (referred to as the rate) relative to other currencies. For example, if the euro/dollar (EUR/USD) exchange rate is 1.170285 , this means that selling 1€ allows you to buy 1.1702$.
When the exchange rate of a currency rises, it is said to appreciate (when it falls, it is said to depreciate). For example, if the EUR/USD exchange rate rises from 1.15 to 1.20, this means that the euro has appreciated against the dollar. One euro now buys more dollars.
The exchange rate may be set by a country’s monetary authorities or may fluctuate based on the supply and demand for the currency in question in the foreign exchange market.
Learn more with the educational notes from Finance for All and the Banque de France.
As can be seen in the diagram below, the exchange rate affects not only the current account86 (notably through the trade balance and tourism) but also the country’s attractiveness in terms of foreign investment, as well as the cost of its debt when it is denominated in foreign currency.
Simplified Diagram of the Effects of a Change in the Exchange Rate
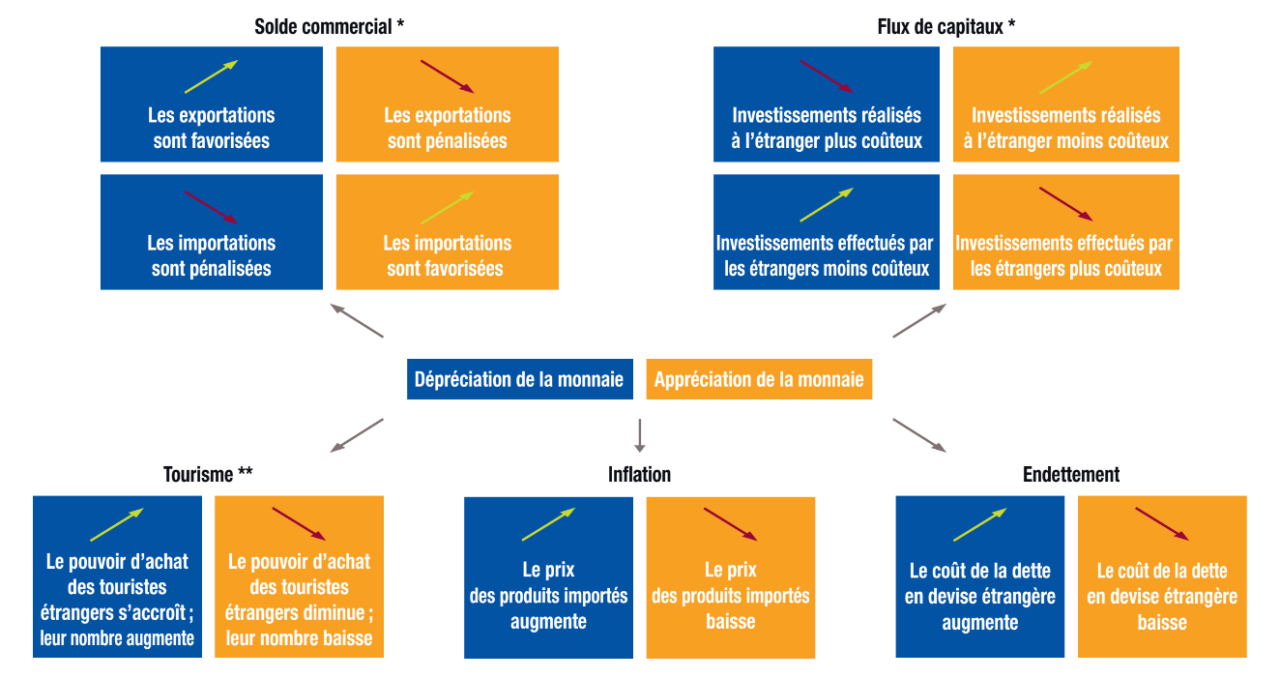
Source: The Exchange Rate, “L’Éco en bref,” Banque de France, 2023.
Reading: The blue boxes show the effects of an exchange rate depreciation; the yellow boxes show the effects of an exchange rate appreciation.
How is the exchange rate established?
The exchange rate depends first and foremost on the exchange rate regime of the country in question—that is, on the rules adopted by the government to establish the conditions under which it is determined.
Depending on this system and public policy objectives (financial stability and capital controls, trade or industrial policy, capital controls), central banks intervene to a greater or lesser extent in exchange rates through the foreign exchange market or their monetary policy (see the section on central banks’ room for maneuver).
What are the different exchange rate regimes?
There are many different exchange rate regimes, which fall between two extremes.
In a floating exchange rate system, the exchange rate is not set by any authority: it fluctuates based on supply and demand in the foreign exchange market. Since the end of the Bretton Woods system and the abandonment of the dollar’s peg to gold, the major economies (the United States, the Eurozone87, Japan) have gradually adopted a floating exchange rate system.
Under a fixed exchange rate regime, the exchange rate of the national currency is set administratively against a standard: since the abandonment of the gold standard, this has been a currency or a basket of currencies. Monetary authorities intervene in the foreign exchange market to defend the exchange rate thus set. The currencies of Denmark, Bulgaria88 and the countries participating in the Africa-France monetary cooperation schemes89 have fixed exchange rates (with narrow fluctuation bands) against the euro. Under this type of regime, the exchange rate may appreciate (revaluation) or depreciate (devaluation) as a result of a decision by monetary authorities, if they deem it unsuitable for the economic context or in response to speculative attacks.
Between these two extremes lie intermediate systems such as moving parity90 or a managed float91. This is the case, for example, with the Chinese renminbi and the Indian rupee.
Next, a currency’s exchange rate is determined on the foreign exchange market ( known as “Forex” to those in the know).
FOREX is the market where currencies are traded: euros for yen, renminbi for dollars, and so on. It is the interplay between supply and demand for each currency in this market that determines its price. As we have seen, the participants in this market include central banks, but also—and above all—private financial institutions (notably a few major banks that trade on their own account or on behalf of their clients, such as companies involved in international trade).
The exchange rate is determined much more by capital flows than by trade in goods and services.
Trade in goods and services between different countries, and more generally, the current account balance92, naturally affect the demand for foreign currency.
However, in the foreign exchange market, most transactions are purely financial. They are used either for direct investment or portfolio investment purposes93, or to establish currency hedges94, or for speculative purposes (betting on changes in the relative exchange rates of currencies).
Daily Trading Volume (April) in the FOREX Market by Type of Market Participant, 2004–2025
According to the Bank for International Settlements’ triennial survey, the daily volume of Forex transactions was estimated in April 2025 at more than 9,500 billion dollars95. Of this total, transactions involving financial institutions accounted for more than 95% (compared to just under 87% in 2010).
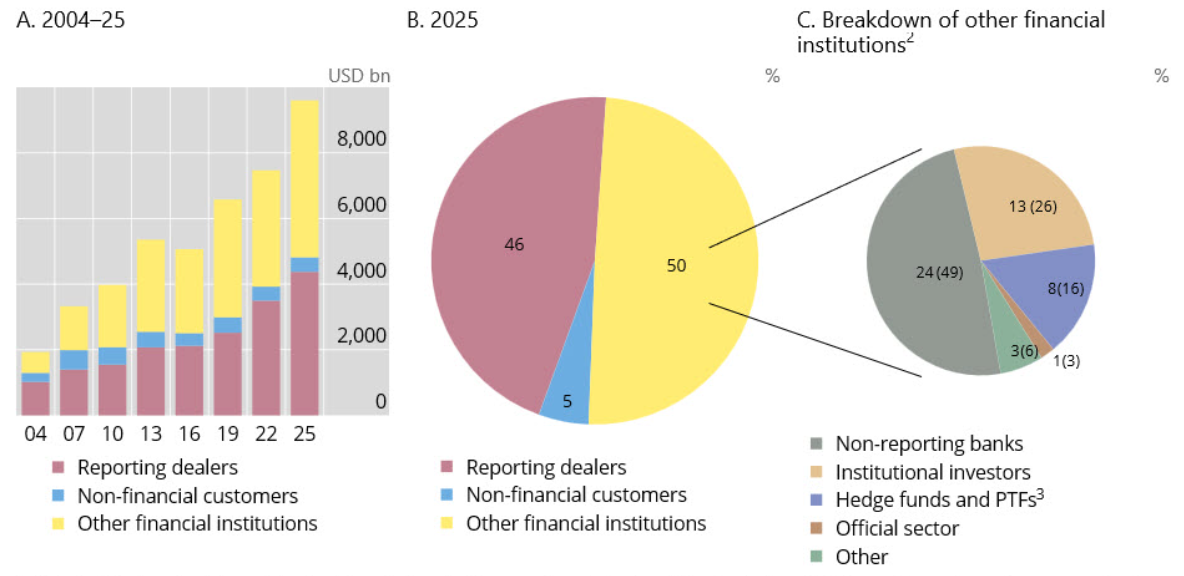
Source: OTC foreign exchange turnover in April 2025, Triennial Central Bank Survey, BIS, September 2025. See the definitions of market participants on page 20. See also the website abc-forex.net.
Notes: “Non-financial customers” are primarily non-financial companies that need access to the foreign exchange market for their commercial activities or investments. They do not trade directly on the Forex market but instead use their bank.
Transactions are accounted for on a net-net basis.96
Beyond economic factors, political and institutional factors play a significant role in how Forex market participants perceive a currency. Political and legal stability is a factor in currency appreciation: the currency of a country perceived as stable will be in greater demand. Monetary and fiscal policies are also taken into account. A central bank that raises interest rates—often to combat inflation (whether rightly or wrongly)—supports the value of its currency. A massive government deficit can undermine market confidence and lead to a depreciation of the exchange rate.
Finally, as with any financial market, purely psychological factors also play a role . Traders buy a currency if they believe it will appreciate or to engage in speculative trading, as George Soros did against the British pound. They also take announcements into account (political statements, central bank decisions, or geopolitical tensions, etc.). They are also likely to turn to “safe-haven assets” (gold first and foremost!) during times of crisis, and thus to currencies considered stable (the dollar, the Swiss franc, the yen).
The links between exchange rate and the current account
A country’s current account consists primarily of the balance of exports and imports of goods and services97. By affecting export competitiveness and the cost of imports (and thus purchasing power), the exchange rate influences this balance:
- A stronger currency (appreciation) makes exports more expensive for foreign buyers and imports less expensive, which can worsen the current account balance;
- A weaker currency (depreciation) boosts exports (making them cheaper for foreign buyers) and reduces imports, which can improve the current account balance.
This led neoclassical economists98 and monetarists99 to conclude that a floating exchange rate regime would allow for an automatic rebalancing of the current account. As UNCTAD notes, this was supposedto “ease the pressures forcing deficit countries to make quantitative adjustments (i.e., by reducing domestic demand) and instead encourage adjustment through prices (i.e., by changing exchange rates), notably through the appreciation of the surplus currency.”100
In reality, this rebalancing is not taking place, for two main reasons.
- As mentioned above, the exchange rate is not determined solely by flows related to trade in goods and services. The majority of transactions in this market are purely financial. Consequently, a currency’s exchange rate depends on numerous factors that can cause it to deviate from a theoretical value that would lead to a balanced current account. In particular, an inflow of foreign capital makes it possible to maintain a current account deficit over the long term.
- The effects of exchange rate fluctuations are not immediate: tests of the hypothesis that a currency depreciation would improve the current account generally show a “J-shaped effect.” When a currency depreciates, imports immediately become more expensive, while the volume of exports does not increase instantly (even though they are cheaper for foreign buyers). This situation leads to an initial deterioration in the trade balance. Over time, exports increase and imports decrease, thereby improving the trade balance.101
The links between capital flows, exchange rates and the current account
Let us clarify, first of all, that the term “capital” is not limited here102 to investments in a company’s equity but encompasses all financing instruments, including bonds and bank loans.
As we saw in Essential 2, starting in the 1980s, the trend was toward financial deregulation and the opening of capital markets. This development was based, in particular, on the idea that the free flow of capital would help promote access to financing for countries in need.
The decision to invest in one country rather than another is based on various factors, foremost among which are political stability and overall macroeconomic considerations (particularly growth prospects). It should be noted that environmental and climate issues will become increasingly significant as their macroeconomic effects become more and more noticeable and quantifiable.
Among the factors that enhance a country’s attractiveness, the exchange rate plays a role, but this is by no means systematic.
- A currency’s appreciation makes domestic assets (buildings, land, equity stakes in domestic companies) more expensive for foreign investors, which can slow foreign direct investment (FDI)103. Such a situation is, however, sometimes seen as a sign of a stable and prosperous economy, which can, on the contrary, attract certain types of FDI (confidence effect). Switzerland, whose currency appreciates regularly, is a case in point.
- Conversely, currency depreciation makes domestic assets cheaper. This can be seen as an opportunity for foreign investors to acquire companies, land, and infrastructure at a lower cost. However, if the depreciation reflects economic instability (inflation, crisis), it may discourage FDI.
While it facilitates access to international financing, the opening of countries to capital has also had negative effects.104
In fact, private capital is volatile and procyclical. It flows into countries when growth prospects are strong and is quick to flow out when the global financial cycle turns.
This fuels a vicious cycle for countries with current account deficits.
- These countries can delay adjusting their current account balances as long as they have access to private loans.
- An influx of capital causes the currency to appreciate (unless the central bank intervenes), which can widen the current account deficit.
- Furthermore, the stock of foreign capital has a direct impact on the current account through the outflows of income it generates (repatriation of dividends and interest).
This process continues and intensifies until the international financial cycle reverses and/or investors lose faith and repatriate their capital. It is then—when countries need it most—that capital abruptly dries up. The sudden halt in capital inflows, combined with capital outflows, further exacerbates downward fluctuations in the exchange rate. This can then result in higher debt service costs if the debt is denominated in foreign currency, leading to a debt crisis.
These mechanisms are particularly acute in the case of a country with a current account deficit. However, a country with a current account surplus—but whose development has relied heavily on foreign capital—may find itself in serious trouble if that capital is suddenly withdrawn.
The Renewed Debate on Capital Controls
While financial liberalization was regarded as dogma in the 1980s and 1990s, the proliferation of financial crises105 linked to these sudden reversals in private capital flows led, in the 2010s and 2020s, to a reevaluation of the IMF’s stance106.
Capital controls (and interventions in exchange rates—see the section below on central banks’ room for maneuver) can now be justified in the name of financial stability. As Éric Monnet notes, “the main argument is that financial flows and interest rates within a country are determined not only by the country’s intrinsic characteristics but also by a global financial cycle that needs to be moderated.”107
This shift in the prevailing doctrine on capital controls in the name of financial stability has been accompanied by evidence of the success of models in which capital controls serve broader objectives.
This is particularly true of China, which—despite beginning to liberalize in the 2010s—continues to require administrative approvals for capital flows in order to evaluate investments in light of national industrial and monetary policy objectives.108
What is the scope of action available to central banks?
Regardless of the exchange rate regime, a currency’s convertibility is intrinsically linked to the confidence it inspires: for a French exporter to accept Brazilian reais as payment for a sale means “believing” that they can be converted into euros. In practice, this comes down to trust in the country’s monetary authorities—and first and foremost, in the Central Bank. It is, in fact, the Central Bank that intervenes in the foreign exchange market (Forex) to ensure—or not!—the successful completion of all transactions.
In fact, contrary to monetarist theories, the role of central banks is not limited to controlling inflation; they also influence exchange rates (through their monetary policy or by intervening in the foreign exchange market) and play a role in preventing or curbing financial crises.
Monetary policy and exchange rates
The central bank influences the exchange rate of its currency through its monetary policy, the primary tool of which is the interest rate.
There are links between the key interest rate and the exchange rate, but the relationship is not straightforward
The key interest rate109 set by a central bank theoretically affects the exchange rate. By increasing financial returns, a higher interest rate in one country than in another tends to attract foreign capital. This leads to an increase in demand for that country’s currency (needed to purchase assets denominated in that currency) and, consequently, an appreciation of the exchange rate.
Some economists who have attempted to formalize the relationship between exchange rates and interest rates have reached the opposite conclusion. According to their theory (known as Uncovered Interest Parity (UIP), the difference between the interest rates of two countries is equal to the expected change in their exchange rate. If, for example, the interest rate were 3% in the eurozone and 1% in the United States, then, according to UIP, the euro should depreciate by about 2% against the dollar over the coming year. Otherwise, investors could borrow in dollars at 1%, convert the proceeds into euros and invest them at 3%, and finally reconvert them at a favorable exchange rate. This would generate a risk-free profit, which the UIP assumes is impossible in the long run.
Empirical tests have invalidated the UIP110. Currencies in countries with high interest rates tend to appreciate, not depreciate. This fuels so-called“carry trade” strategies111, which UIP theorists deemed impossible. In addition to the theoretical flaws of the UIP112, several factors other than the interest rate influence investors’ decisions: their expectations—which themselves depend on numerous considerations—currency risks, monetary policy, and general economic conditions.
According to a common misconception, financial markets are averse to “accommodative” monetary policies. In short, a currency is “penalized” (that is, sold more than bought, which could lead to its relative depreciation) by monetary policies aimed at increasing the money supply in circulation to stimulate domestic demand, whether these consist of cuts in key interest rates or quantitative easing operations (QE) or others.
The rationale behind this belief is simple: excessive money supply would lead to a decline in the value of the currency (this is the quantity theory of money). The facts show, however, that it is not quite that simple: if the economic situation of a country (or a group of countries, such as the eurozone) is deteriorating, the markets are not, as a matter of principle, hostile to these “accommodative” interventions, unless they believe such measures risk exacerbating already problematic inflation, are ineffective because interest rates are already too low, or are perceived as circumventing fundamental reforms. In the period following the 2008–2009 crisis, central banks’ quantitative easing (QE) policies did not trigger any sharp negative reactions from the markets.
The importance of foreign exchange reserves: coping with crises and controlling the exchange rate
The increasing frequency of financial crises since the 1970s has led many countries to build up substantial foreign exchange reserves, which consist of foreign currency assets (known as reserve currencies), gold, and SDRs (Special Drawing Rights) held by a country’s central bank.
These reserves make it possible to influence a currency’s exchange rate by intervening in the foreign exchange market and/or to serve as a form of self-insurance in the event of a liquidity crisis (such as one caused by a sudden withdrawal of capital) or a balance-of-payments crisis. They are therefore the equivalent113 “real” or “tangible” wealth (know-how, skilled labor, machinery, energy, natural resources, goods and services produced and delivered, etc.).
Composition of Global Foreign Exchange Reserves
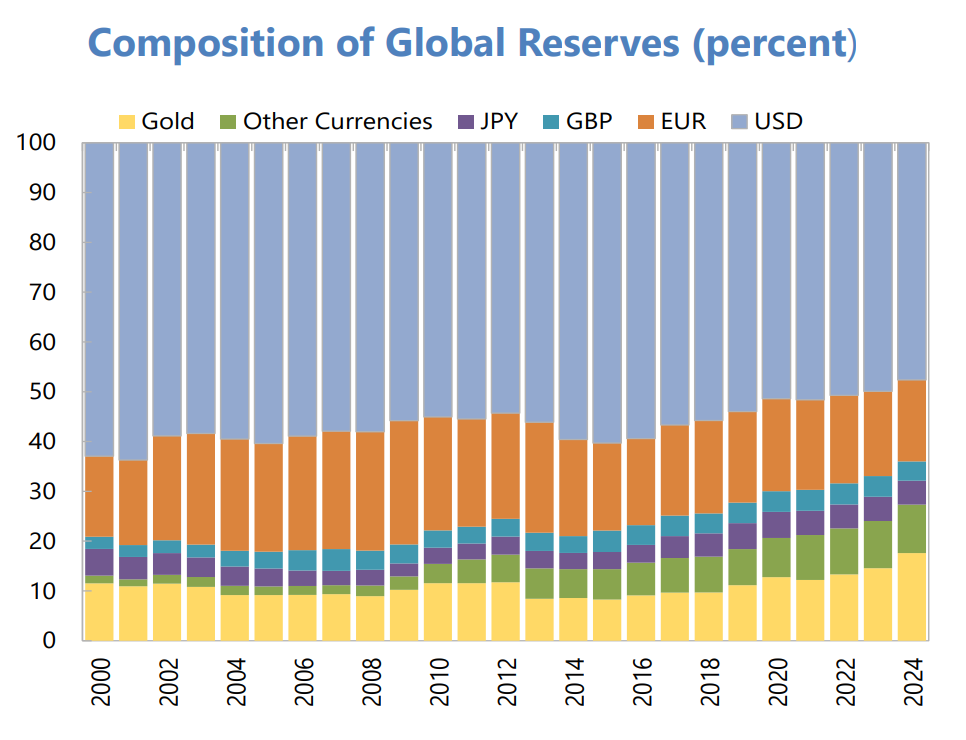
Source: The Global Financial Safety Net—A Stocktaking, IMF, 2025
Note: While the dollar dominates globally, gold may account for a significant portion of reserves in some countries (up to 80% for the U.S. or Germany, but less than 8% for China as of September 2025114). France’s foreign exchange reserves, for example, totaled more than 346 billion euros at the end of October 2025 (78% in gold). Those of the Eurosystem stood at 1,600 billion in Q3 2025115.
How are foreign exchange reserves built up?
A central bank builds up foreign exchange reserves by purchasing foreign currency (or gold) on the foreign exchange market using its national currency, which it creates in the process. Of course, this requires that there be parties interested in its currency.
Let’s take China as an example. The Bank of China can exchange renminbi for foreign currencies for foreign importers who want to pay in renminbi, for Chinese exporters who want to convert the dollars they have received, or for foreign investors who wish to invest in China, etc.116. Building foreign exchange reserves is therefore all the easier the more deeply a country is integrated into international trade, whether through its exports or through the attractiveness of its economy to foreign investment.
Reserve currencies are most often held in the form of financial securities denominated in the relevant currency (U.S. Treasury bonds, European bonds, etc.). Foreign exchange reserves can therefore increase as a result of income from these securities. They can also decrease (or increase) due to the depreciation (or appreciation) of these securities. The same applies to gold.
Foreign exchange reserves enable central banks to influence the exchange rate of their currency
By building up substantial foreign exchange reserves, the Bank of China was thus able to keep the renminbi’s exchange rate higher than it would otherwise have been117.
While it seems normal for countries with a fixed (or managed floating) exchange rate regime to intervene regularly in the foreign exchange market, one might think that this would not be the case for countries with a floating exchange rate regime. Yet these countries also engage in this type of intervention118 as the example of Switzerland shows.
In the early 2010s, this country became particularly attractive to foreign investors, largely because its interest rates were higher than those of other countries119. Since the continuous inflow of foreign capital could cause the Swiss franc to appreciate too much (with a negative impact on exports), the Swiss National Bank decided to purchase foreign securities, thereby increasing the country’s foreign exchange reserves. By 2022, 85% of its assets consisted of foreign assets (amounting to 140% of Swiss GDP).120
Conversely, a currency may find itself in a situation of excess supply: too many market participants are selling the currency and not enough are buying it. This can result, for example, from a sudden withdrawal of capital following a global financial crisis, or from a crisis of confidence stemming from a political scandal.
In this case, the currency’s exchange rate falls, which the central bank may try to prevent by buying its own currency—but to do so, it must have foreign exchange reserves. In the opposite scenario, it has no choice but to let the currency depreciate, which, as we have seen, has significant economic consequences. This is particularly true if the country is heavily dependent on foreign sources for its imports of basic goods (food, energy).
Foreign exchange reserves are one of the tools of the global financial safety net
A country’s accumulated foreign exchange reserves can help it weather a liquidity crisis. However, this proves insufficient in the event of a global financial crisis, such as the one in 2008, and, of course, for countries that do not have foreign exchange reserves.
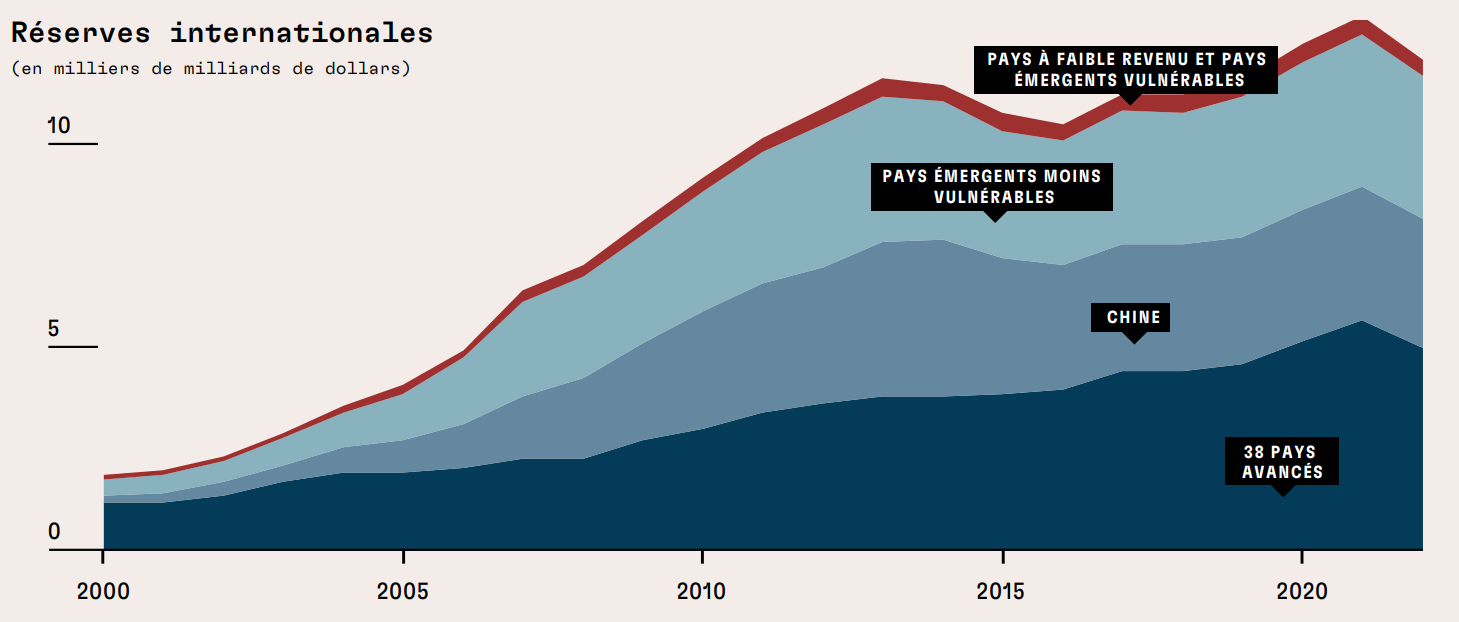
There are other mechanisms, but they are neither unlimited nor unconditional.
The IMF was created to address financial crises: it can therefore grant loans, but for a long time these have been accompanied by conditions in the form of structural adjustment programs aimed at implementing the measures of the Washington Consensus.121
Regional multilateral mechanisms have also been established in the wake of crises. Examples include the Chiang Mai Initiative, a regional mechanism in East Asia created after the 1997–1998 financial crisis, and the European Stability Mechanism (ESM), created in the wake of the 2010–2012 eurozone sovereign debt crisis.
Swap agreements are currency exchange agreements between central banks. Although they have existed for a long time, they have gained in importance since the 2007–2008 crisis. They are used in particular by the Fed to address dollar liquidity crises, by the ECB—especially with EU countries outside the eurozone—and, increasingly, by China to facilitate trade in renminbi.122
International Insurance Mechanisms (in billions of dollars)
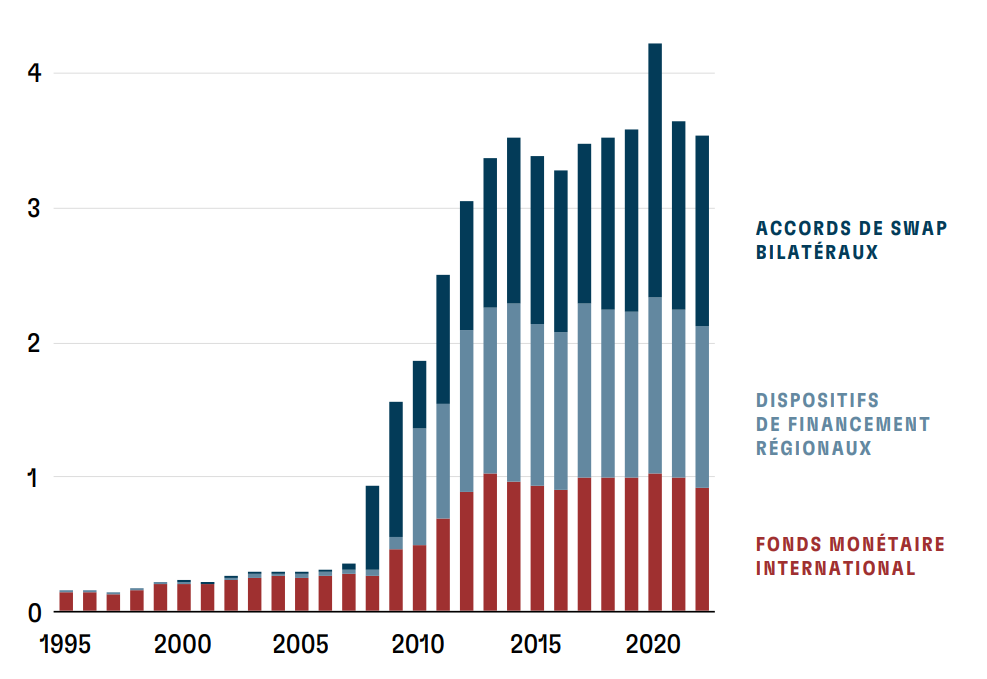
Find out more
- The Trade and Development Report 2015, Chapter 3—Systemic Challenges in the International Monetary System—and the box on the cost of foreign exchange reserves (Box 4.2) in UNCTAD’s 2009 Trade and Development Report.
- Éric Monnet, “Changes in the International Monetary System,” in The Global Economy 2024, Editions La Découverte, 2023.
- The Issue of Exchange Rates Is the Blind Spot in G7 Negotiations on Global Imbalances – Interview with Shahin Vallée and Brad Setser in Le Grand Continent (June 15, 2026).
- The Exchange Rate, The ABCs of Economics, Banque de France (2023)
- The Global Financial Safety Net—A Review, IMF, 2025
Dive into the numbers with:
- The Bank for International Settlements’ Triennial Survey of the Foreign Exchange Market (2025 Edition)
- The ECB’s databases on the euro area’s foreign exchange reserves and the IMF’s databases on the composition of global foreign exchange reserves by currency type
With globalisation came increased tax, social and environmental competition
The growing integration of economies has resulted not only in increased trade in goods and services and capital flows, but also in competition among nations and regions driven by large corporations, which have thereby been able to reduce their effective tax rates—and thus their contribution to the public good—or even avoid paying taxes altogether.
How International Trade Actors Have Broken Free from Governments—and from Public Interest
Originally tied to the realm of nation-states, international trade gradually gained autonomy, to the point where the actors involved became powers on par with nations.
Beginning with the opening of the seas in the 15th and 16th centuries, those involved in international trade gradually freed themselves from the legal and tax regulations of individual territories. Civil law, which establishes the common rules of social life, has faced competition—and has even been altered—by commercial law, which governs individual relationships centered on economic interests. This development has far-reaching consequences for the protection of collective interests.
In his book The Age of Deglobalisation (2022), economist Guillaume Vuillemey traces this evolution, which he describes as the deterritorialization of trade. We present his thesis below.
Deterritorialization occurs when transactions take place in a given location while partially evading the legal and tax rules in effect in that location; in other words, when there is a break in the link between an actual activity and its legal and regulatory treatment.
The slow development of long-distance trade
If long-distance trade is as old as civilizations123, for a long time it remained closely tied to the terrestrial world and was therefore subject to the legal systems of the territories it traversed. To reach their final destination, merchants had to travel through various countries and territories and thus submit to the approvals, restrictions, and tolls imposed by local rulers. Maritime trade was also inseparable from the terrestrial world at that time: navigation techniques124 did not allow ships to stray far from the coast, and the seas were controlled by the maritime powers of the time.125
Beginning in the 15th and 16th centuries, advances in navigation126 made large-scale European expeditions possible127. Europeans’ relationship to space and the ocean evolved: from an impassable barrier, it became a unifying force; it connected worlds rather than separating them.
It was the governments that first promoted the development of global maritime trade. Their support was, in fact, essential for launching costly and highly risky expeditions128. This involved financial support for shipbuilding, but also—and above all—the establishment of the East India Companies.
The India Companies
This general term refers to companies established (mostly in the 17th century) by European states to manage trade with the rest of the world. The most powerful of these were the British East India Company129 , established in 1600 by a royal charter from Queen Elizabeth I of England, and the Dutch East India Company130 established in 1602 by the Republic of the Seven United Provinces of the Netherlands. They held a monopoly on trade between their home countries and certain parts of the world. Most notably, they had a legal structure that was extremely rare at the time: they were joint-stock companies, and the shareholders’ liability was limited131 : investors could not lose more than the capital they had contributed. This major innovation greatly facilitated the raising of capital by limiting the risks taken by investors. The support they received from the state was also political: throughout their history, the East India Companies engaged in significant military activity to establish trading posts, conquer new markets, and secure them. They thus constituted a key element of European colonization. The conquest of India and the Opium Wars, aimed at opening up trade with China, are prime examples of this. They gradually disappeared at the turn of the 18th and 19th centuries, with the British East India Company being the last to be dissolved in 1874.
Learn more: Philippe Haudrère, The East India Companies, Editions Desjonquères, 2024.
Although heavily dependent on the states for their development, commercial interests gradually broke free from them beginning in the late 17th century: long-distance trade became viable without their support. The steady decline in transportation costs and improvements in efficiency brought about by technological advances made it easier to raise the capital needed for expeditions. The East India Companies gradually lost their monopoly and were eventually dissolved. Ideas had changed. While mercantilist thought—which linked the power of the state to the vitality of trade—dominated in the 16th and 17th centuries, the publication of the Wealth of Nations (1776) by Adam Smith, the father of classical economics, marked a turning point. In it, he promoted free trade and denounced monopolies and government barriers. Forty years later, David Ricardo developed the theory of comparative advantage, which has since served as the foundation for advocates of free trade.
Starting in the 19th century, trade really began to intensify: economists, in fact, identify the period from 1870 to 1914 as the “first wave of globalisation”132. This development resulted from both technical and institutional factors (steamships, the growing integration of financial markets in industrialized countries facilitated by the gold standard, which stabilized exchange rates133 between currencies, and the limited liability corporation structure, which became accessible to private entities.134
After a period of decline following World War I and the economic crisis of 1929, international trade began to flourish again after World War II, driven by geopolitical, institutional, and technical factors.135
How trade law increasingly influenced civil law
The distinction between civil law and commercial law has existed since ancient times136 : the law governing trade with foreigners was not the same as that of the city-state.
The difference between civil law and commercial law during the Antiquity
Civil law is the law of a given community, while commercial law aims to establish rules between people from different communities. It is international in nature. Since there is no community of merchants from different territories, commercial law is secular, whereas civil law is linked to the religious order (the gods of the city, a conception of the good order). Civil law is formalistic (sacred formulas, rituals, etc.) and largely derived from oral traditions, whereas commercial law is non-formalistic and relies more on written contracts.
Commercial law long remained a niche field, a marginal area of law, with civil law enjoying clear preeminence. The opening of the seas is changing the landscape.
The increase in trade across the high seas beginning in the 16th century sparked a debate137 regarding the legal status of this space. Very early on, the doctrine of freedom of the seas prevailed: the sea is free for all and belongs to no one; beyond a strip surrounding a country’s coastline, it is not subject to any state regulation.
Are international waters a lawless zone?
While the principle of freedom of the seas remains in effect, common rules were nevertheless established in the second half of the 20th century138 with the aim of legally delimiting maritime areas (the high seas and coastal areas under the sovereignty of states139) and to clarify the rights and obligations within those areas140. Thus, public international law does indeed exist on international waters. However, on the one hand, it applies only to subjects of international law (States and international organizations such as the United Nations141), and, on the other hand, the ability to enforce it is limited. For example, one of the legal debates centers on whether resources in international waters are res nullius (“nobody’s property,” which can be appropriated) or res communis (“common property,” which cannot be appropriated). In practice, declaring certain resources to be “common” has little effect due to the absence of a political authority capable of ensuring their common management.
Globalisation […] is the result of a split in the world: on the fringes of traditional institutions—where the individual and communal dimensions of human life had always been intertwined—a world has emerged in which individual interests alone have been allowed to prevail, without regard for collective interests.
Freedom of the seas opens up a space for trade that is virtually free of political interference—a prospect that is reflected in the evolution of the law. As Guillaume Vuillemey explains “maritime law has naturally become integrated into the frameworks inherited from commercial law. Furthermore, freed from the constraints of land, commercial law has developed numerous institutions, legal forms, and contracts that allow for the optimal exploitation of commercial opportunities on a global scale. This body of law was developed to provide tools for the more effective pursuit of private interests, with little regard for collective interests ”.
The limited liability corporation, mentioned earlier, is an example of this. Granted by governments to the East India Companies to promote long-distance expeditions, this legal status gradually became widespread throughout the 19th century, extending to all economic activities. However, while it does indeed make it possible to raise capital for large-scale projects, that is not its only effect. By limiting investors’ potential losses to the capital they have contributed, it relieves them of responsibility for the—potentially serious—impacts of the activities of the companies in which they have invested. It allows for the maximization of private profits, while being potentially very harmful to the collective interest.
Since participants in international trade (merchants first, and multinational corporations second) are able to choose which countries to trade with—and later, in which territory to establish a presence—they can pit those countries against one another to further their own interests. States are then tempted to adapt their civil laws to attract them.
This dominance of commercial interests comes at the expense of other objectives that could be pursued. As we explain in the Essential about the winners and losers of globalisation, this dynamic is deeply unequal. The actors who benefit from this competition among states are the “mobile actors”—multinational corporations and wealthy individuals—who can arbitrage on a global scale to maximize their interests (paying less in taxes, producing under lax social or environmental standards). “Immobile actors,” rooted in local communities and national economies, pay the price (through taxes or the deterioration of public services) for the disengagement of mobile actors.
Today, this competition over standards and taxation weighs heavily on the public debate. It lies at the heart of the constant call for corporate competitiveness. It crops up in every debate on environmental or social regulations. On the tax front,this competition has led to a reduction in corporate income taxes (since corporate headquarters are more mobile than labor or real estate). Globalisation has also facilitated the use of tax havens and tax evasion, which remain very difficult to regulate.
Let’s look at three examples of competition in the social and environmental spheres.
The example of maritime trade: flags of convenience, a “market for ship nationality”
International trade is mostly seaborne
Carrying nearly 80% of traded goods, the merchant marine is the backbone of international trade. This sector, along with the rise of flags of convenience, serves as a prime example of how competition among nations to lower social and environmental standards affects businesses.
Maritime transport accounts for more than three-quarters of freight transport services (in ton-kilometers)
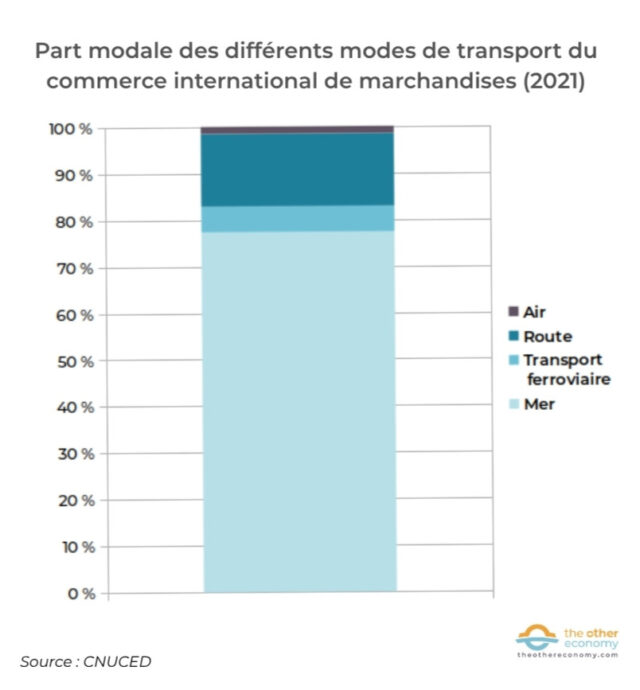
Fact: More than 77% of international trade in goods (measured in ton-kilometers) was transported by sea in 2021.
Source: Data on trade and freight transport (in ton-kilometers), UNCTAD database.
International maritime transport is essential regardless of the type of cargo: oil (carried by oil tankers), other raw materials (carried by bulk carriers), and manufactured goods (carried by container ships). That is why the growth in trade has been accompanied by an expansion of the merchant fleet.
The capacity of the global merchant fleet more than tripled between 1980 and 2025
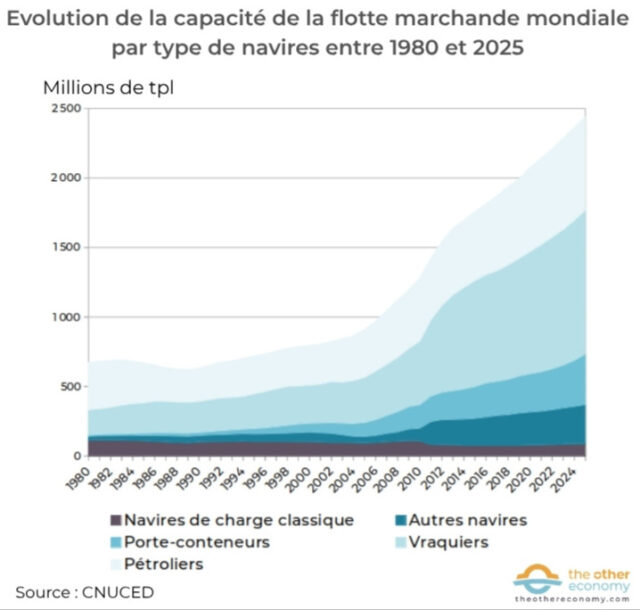
Methodological Notes:
Deadweight tonnage (DWT) is the unit used to measure the maximum cargo a ship can carry. Another unit used to assess the global fleet is gross tonnage (GT), which is a measure of a ship’s size, useful for assessing shipbuilding or recycling activities.
Only large merchant ships (over 100 GRT) are included here.
Origins and development of flags of convenience
The rise of flags of convenience in the maritime sector has played a significant role in the weakness of the regulations governing the maritime sector.
All ships must fly the flag of a country that determines the regulations the shipowner must comply with, as well as the competent jurisdiction in the event of a dispute. Flags of convenience are provided by states that authorize ships to fly their flag in exchange for the payment of registration fees, without any actual connection between the state and the company that owns the ship. The first flags of convenience appeared in the 1920s, when U.S. shipowners began registering their ships in Panama to circumvent Prohibition and sell alcohol to their passengers.
A Greek shipowner can thus choose to register his vessel in Liberia without having any connection to that country (whether in terms of capital investment, crew, or port calls). However, Liberian law does apply—whether in matters of labor, the environment, safety, or in the event of a collision, shipwreck, or oil spill. The growth of flags of convenience has given rise to a sort of “market for ship nationality and, consequently, for the standards to which they are subject”142. They thus constitute an archetypal example of how international economic actors (in this case, shipowners) pit national standards against one another.
Top 3 most commonly used flags of convenience: Liberia, Panama, and the Marshall Islands
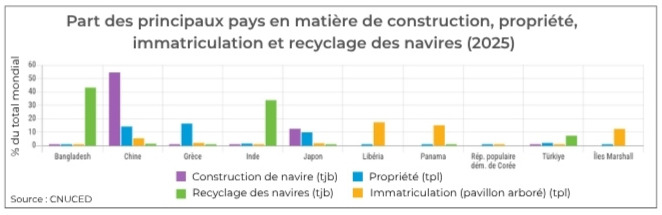
Source: Data Insight – Transportation, UNCTAD
The stages of development of flags of convenience
In 2026, according to the list published by the International Seafarers’ Federation, 48 countries offered flags of convenience. The shift toward this type of flag occurred in two major successive waves.
Starting in the late 1960s, the first major oil spills143 led to lawsuits and attempts at regulation144. In response, shipowners increasingly turned to flags of convenience.
The fleet of oil tankers flying flags of convenience (measured in deadweight tonnage) grew from about 35% of the global fleet in 1980 (primarily Liberia, and to a lesser extent Panama) to more than 60% in 2025.145
This trend has gradually spread to the entire merchant marine as a result of the intensification of globalisation beginning in the 1980s, which has led to increased competition among shipowners. Today, more than 65% of the world’s merchant marine sails under flags of convenience.
Profits for a few, consequences for all
Given that the very purpose of flag-of-convenience ships is to circumvent environmental and social regulations, it is clear that their rise has led to a lowering of the standards applicable to the merchant marine.
As a result, the global fleet is less safe, more polluting, and older than it would otherwise have been.
The system benefits a few stakeholders: shipowners and operators, the few countries that offer flags of convenience, and, to a lesser extent, consumers who pay less for the transportation of the products they purchase. On the other hand, the costs are borne by the public when it comes to ocean pollution, such as oil spills: it is, in fact, very difficult for a country’s judicial system to obtain compensation for an oil spill due to the complex legal structures put in place specifically to avoid liability in the event of an accident. On the social front, working conditions on ships flying flags of convenience are particularly harsh, as these ships do not respect minimum labor standards—and know they are immune from legal action by their employees.
The loosening of environmental standards to attract investment in extractive industries
Some countries rich in natural resources have adopted deliberate strategies to limit (or even fail to implement) environmental standards in order to attract foreign investors. This phenomenon is particularly evident in sectors such as oil extraction and mining, where the potential economic gains are considered to outweigh the social and environmental costs.
The Niger Delta in Nigeria: a dramatic example
At the heart of Nigeria’s oil industry, this delta has endured decades of intensive exploitation without the government imposing or enforcing serious environmental standards. Developed since the 1950s by international companies (Shell being the most prominent) and by the Nigerian government, this area covers approximately 70,000 km² —an area comparable to that of Ireland—and is home to approximately 30 million people belonging to more than 40 ethnic groups.146
A study published in 2025147 based on radar observations covering an area of 9,000km² estimates that more than 13 million barrels of oil have been spilled into the delta since the start of operations, with major ecological impacts, particularly on the mangroves—which are being destroyed at a rate of more than 5,500 hectares per year.
A meta-analysis148, based on 28 studies conducted between 2000 and 2024, shows that oil pollution has significant impacts on agriculture (heavy metals and nearly 240,000 oil spills contaminating 60% of arable land), on health (respiratory problems in 35% to 45% of exposed communities), and a weakening of local food systems.
Despite efforts to monitor the environment using new technologies (remote sensing, artificial intelligence), environmental monitoring149 remains insufficient to prevent spills. In practice, remediation efforts are often slow, piecemeal, or nonexistent, especially in historically affected onshore areas. Legal proceedings are underway regarding corporate liability150, highlighting the environmental and human consequences of oil exploitation in the Niger Delta and the lack of meaningful environmental regulations.
Mining concessions in the Amazon: a cause of deforestation
While agriculture and livestock farming are the leading causes of deforestation in the Amazon151, mining also plays a role.
The surge in applications for mining concessions in protected areas and on Indigenous lands illustrates the growing pressure from mining companies to exploit metal deposits (nickel, copper, cobalt, etc.). Some companies have filed hundreds of permit applications in conservation areas of the Brazilian Amazon—sometimes in areas that overlap with protected areas or Indigenous territories—at a time when climate and social challenges are intensifying.
According to the World Resources Institute’s report Undermining Rights: Indigenous Lands and Mining in the Amazon (2020), active mining concessions covered nearly 128 million hectares, or about 18% of the Amazon. Furthermore, both legal and illegal mining activities encroached on more than a thousand Indigenous territories (covering 45 million hectares, representing nearly 20% of Indigenous lands) despite legal protections, particularly in Brazil, where mining on these lands is prohibited by law. Finally, the report also warns that mining increases deforestation in these areas and causes significant pollution.
Launched in 2023, the Amazon Mining Watch scientific initiative monitors deforestation linked to gold mining in nine countries in near real time152 that make up the Amazon basin: by the end of 2025, nearly 500,000 hectares of Amazon rainforest had been affected by mining development (including approximately 40,000 additional hectares in 2025).
In addition, by 2025, more than 220 protected areas and/or Indigenous territories (covering more than 14,000 hectares)153 were subject to new mining activities. This suggests a high proportion of illegal mining, as it is most often prohibited in these territories.
Such practices can be explained in part by competition among nations: countries seek to attract investment in extractive sectors by offering more flexible regulatory frameworks, expedited permitting, and less restrictive oversight. In this context, environmental regulation becomes a competitive factor rather than a safeguard, with globalisation amplifying an environmental “race to the bottom.”
Free-trade zones: tax and social competition as a strategy to attract investment in the context of globalisation
It was starting in the 1970s that “free zones” began to proliferate. This generic term refers to a territory in which businesses enjoy special status that deviates from the standard regulations in effect in the rest of the country: reduced taxes, no customs duties, less protective labor laws, etc. They vary in size: from small, strictly defined areas with no resident population to territories covering hundreds or even thousands of km²—in which case they are referred to as “special economic zones” (SEZs). They also encompass different types of activities: zones designed to facilitate commercial logistics, more or less specialized manufacturing, service zones, and so on.
Their proliferation is indicative of ongoing competition among countries and regions seeking to attract businesses and investors in the context of globalisation.
Definitions: Special Economic Zones and Export Processing Zones
There is no clearly established classification of the different categories of free zones. The names used vary depending on the reports that attempt to establish classifications154, and depending on the countries where they are established.
Let’s focus here on two fairly common terms:
Often used as a synonym for “free trade zones”, “special economic zones” (SEZs)155 comprise vast territories that may include cities (in whole or in part), business parks, rural areas, transportation infrastructure, and so on. They are geographically defined zones with a single management or administrative structure. They operate under economic laws that are more “liberal” than those of the country as a whole, offer incentives to businesses that set up operations there, and have a separate customs territory.156
“Export Processing Zones” (EPZs) can be Special Economic Zones (SEZs) or much smaller areas. They are dedicated to the production of manufactured goods (and, more recently, services) intended for export. Companies operating there enjoy numerous benefits: reduced taxes, exemption from customs duties on imports and exports, simplified administrative procedures and customs inspections, free repatriation of profits, more flexible environmental and labor market regulations, preferential rates for water, electricity, and telecommunications, access to high-quality infrastructure, etc.
Statistics on free trade zones are difficult to find, both because of the lack of a classification system (see box) and the scarcity of regular publications on the subject.
Take, for example, the 2019 edition of UNCTAD’s World Investment Report. The authors note that, as of 2018, more than 147 countries had legislation establishing special economic zones, compared to just 29 in 1975. During the same period, the number of SEZs rose from 79 to more than 5,400 (with an additional 500 SEZs in the planning stages at the time of the report’s publication).
Historical Development of Special Economic Zones
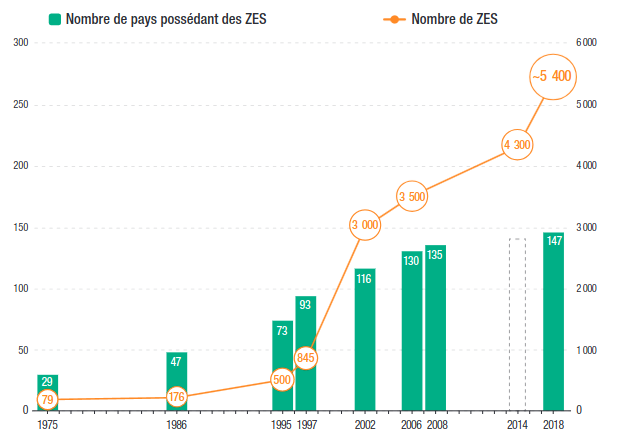
Source: World Investment Report 2019—Special Economic Zones, UNCTAD
In his book Apocalyptic Capitalism (2025), historian Quinn Slobodian, shows that these “zones of exception” have proliferated to the point of becoming the norm in global governance, embodying a logic of competition among territories to lower taxes, relax labor laws, and limit regulatory constraints.
It traces how these areas have gradually been integrated into governments’ strategies to attract investment while circumventing or fragmenting national regulations. Open to international capital, they offer significant tax advantages, effectively weakening the ability of governments to uniformly regulate economic development across their entire territory and reducing their tax revenues.
From a social perspective, these zones can also lead to a race to the bottom in social standards. Companies located in SEZs often benefit from greater flexibility under labor laws, with weaker protections for workers or the absence of strong labor unions, which enhances their competitiveness but undermines working conditions. In some cases, these zones have been described as places where wages and protections fall well below national standards, creating segmentation within the domestic labor market and social competition between zones and external territories.
Free Trade Zones: The examples of Shenzhen and Dubai
Special economic zones in China are among the best known and most studied. Established in the late 1970s under the leadership of Deng Xiaoping, zones such as Shenzhen offered preferential tax regimes, customs concessions, and relative freedom in legal and commercial management, which accelerated industrialization and attracted multinational corporations to a country whose economy was still largely planned. This model served as a testing ground for economic reforms before they were rolled out nationwide.
The case of Dubai is also emblematic. This city-state with multiple free zones157 includes, notably, the Jebel Ali Free Zone (JAFZA), the Dubai International Financial Center (DIFC), and zones specializing in logistics, biotech, the internet, and more. —all of which offer 100% foreign ownership, significantly reduced taxes, customs exemptions, and dedicated infrastructure to attract multinational corporations. In 2025, Dubai further relaxed its framework for companies registered in free zones ( free zone establishments). Whereas previously they could only operate within their zone or internationally, Resolution No. 11 grants them access to the domestic market.158
Find out more
- Guillaume Vuillemey, The Age of Deglobalisation: Protecting the Commons Against Free Trade , Seuil, 2022
- Quinn Slobodian, Apocalyptic Capitalism: Or, The Dream of a World Without Democracy , Le Seuil, 2025
- Philippe Haudrère, The East India Companies, Editions Desjonquères, 2024
- UNCTAD Data Insights – Maritime Transport
- Undermining Rights: Indigenous Lands and Mining in the Amazon, World Resources Institute, 2020
- World Investment Report 2019—Special Economic Zones, UNCTAD
- Handbook on Export Processing Zones, ILO, 2014
Trade globalisation is contributing to the breach of planetary boundaries
The globalisation of trade has had significant negative impacts on the climate and global ecosystems. It is certainly not possible to unequivocally attribute all instances of exceeding planetary boundaries to globalisation, particularly because it has contributed to the growth of a development model that ignores these boundaries. Nevertheless, we will attempt to analyze this contribution by distinguishing the direct impacts of trade flows themselves from the indirect impacts, which are of two kinds, as we will see.
Estimating the impact of international trade in goods and services on planetary boundaries
Productive activities that give rise to international trade in goods and services rely on the extraction and processing of natural resources. They also generate pollution, as does the resulting consumption of these products. They therefore have an impact on planetary boundaries.159
In an article published in 2025160, several economists sought to identify what that impact was for five of the nine planetary boundaries.
In 2021, goods and services traded globally accounted for 19% to 59% of the pressure on planetary boundaries
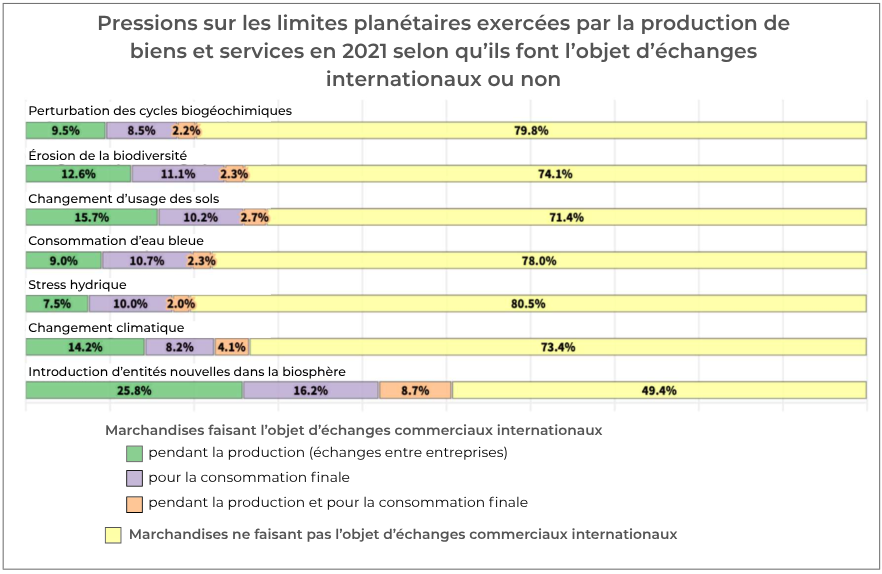
Source: Gabriel Santos Carneiro, Guilherme Magacho, Etienne Espagne, “Leveraging International Trade for the Ecological Transition: Quantifying the Drivers of Planetary Boundaries,” Ecological Economics, 2026 (working paper available for download on the AFD website). Translated and adapted by The Other Economy.
Note: The study focuses on five planetary boundaries (blue water consumption and water stress are the two dimensions of the “Freshwater Use and Cycle” boundary).
Reading: Internationally traded goods account for 26.6% of the pressures on the “climate change” boundary (of which 14.2% is attributable to goods traded internationally during their production, 8.2% for goods traded for final consumption, and 4.1% for goods traded both during production and for final consumption).
Not surprisingly, the pressure exerted by goods traded internationally is distributed unevenly around the world.
As the authors note, “consistent with previous studies161, we found a significant gap between high-income countries and low- and middle-income countries: demand for imports of final consumption goods from the former leads to a deterioration of Earth system processes in the latter.”
Low- and middle-income countries in East Asia and the Pacific—led by China—fall between these two groups, as they are both importers and producers of goods that contribute to pressure on planetary boundaries.
The study thus shows that a significant portion of the pressures on planetary boundaries is linked to global value chains162 and current forms of international trade. However, one cannot automatically conclude from this that international trade itself is the driving force behind all of these pressures.
The direct impact of trade is evident in international freight and passenger transportation services. For the majority of goods and services traded, however, it is more difficult to determine to what extent trade contributes to these impacts rather than merely shifting them geographically.
Direct impacts of trade globalisation: the example of international transport
Globalisation has led to an increase in the international transport of goods and people, which has direct consequences for the environment. It should be noted here that transportation is both a prerequisite for and an integral part of international trade, since transportation services are commercial services.
Most forms of transport rely on fossil fuels, which have an impact on the climate and the environment
The burning of fossil fuels leads to the emission of greenhouse gases, which cause global warming.
Global greenhouse gas emissions from transport
In 2019, domestic and international passenger and freight transportation accounted for approximately 8.9 Gt CO2-eq163, or 15% of global greenhouse gas emissions.164
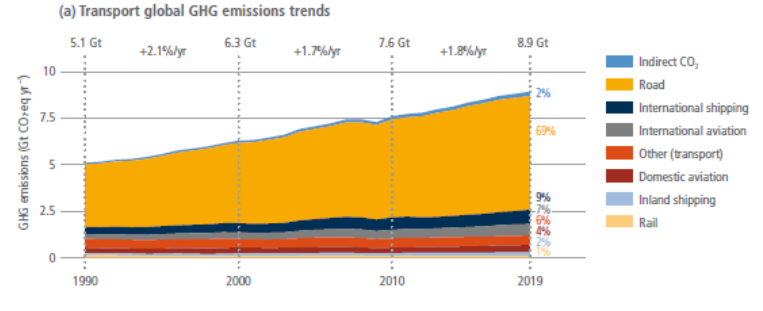
Source: IPCC Sixth Assessment Report, Working Group 3, Chapter 10, Figure 10.1
Note: Some of the emissions associated with passenger transportation are not attributable to international trade (trips made in a personal vehicle, domestic trips).
Emissions from international aviation and maritime transport totaled 1.4 GtCO2-eq165. To estimate emissions from transportation related to international trade, emissions from road transport must be added (since rail emissions are negligible).
According to the International Energy Agency166, freight transport by heavy-duty trucks and passenger transport by bus emitted approximately 2.3GtCO2. A conservative estimate suggests that at least between half and two-thirds of these vehicles cross a border or transport goods unloaded from ships.
In total, GHG emissions from international freight transport thus range between 2.5GtCO2-eq and 3GtCO2-eq, representing approximately 5% of global emissions. This result is largely due to the very low carbon intensity167 of maritime transport, which accounts for nearly 80% of the volume of goods transported.
The use of various modes of transport has many other environmental impacts.
The combustion of fossil fuels emits gases (sulfur dioxide, nitrogen oxides, fine particulate matter) and heavy metals168 that pollute the air, water, and soil. This is particularly true for maritime transport, which uses heavy fuel oil, one of the dirtiest fuels in the world.169
In addition to these pollutants, there are fine particles from the brake pads of land-based vehicles (buses, trucks, cars, and trains), as well as pesticides that may be used to control weeds along roadsides and railroad tracks.
Maritime transport is a major source of ocean pollution from hydrocarbons (degassing operations170, shipwrecks, and oil spills), and biological pollutants (from the discharge of ballast water in ports171), and chemicals and waste (containers that have fallen overboard172).
The construction of transport fleet and infrastructure also has environmental consequences
The construction of ships, airplanes, trucks, buses, and trains requires raw materials (metals, energy, water) and generates greenhouse gas emissions as well as other forms of pollution. As the global merchant fleet grows, so do the environmental impacts associated with shipbuilding.
The same applies to the construction of transport infrastructure173 which, in addition, contributes to land sealing, the fragmentation of ecosystems, and the destruction of ecologically sensitive sites.
Between 2011 and 2025, the number of ships in the global merchant fleet increased by 35% (from 83,000 to 112,500 ships). If the fleet is measured based on the size of the ships rather than just their number, the increase is more than 75%.
The Growth of the Global Merchant Fleet
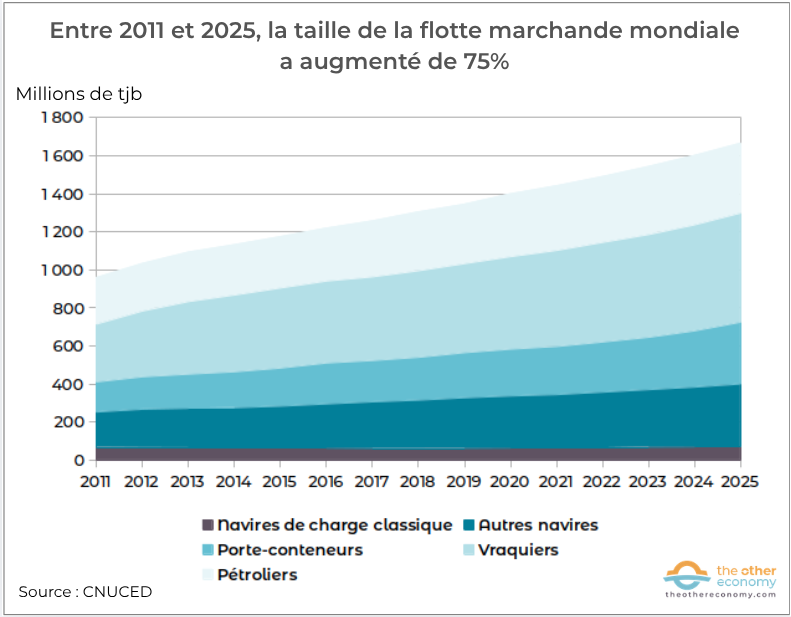
Source: UNCTAD Database— Merchant Fleet by Flag and Ship Type
Note: GT (gross tonnage) is a measure of a ship’s size. It is useful for tracking shipbuilding and ship recycling activities.
It should not be confused with the TPL (metric metric ton), which is used to measure a ship’s cargo-carrying capacity.
Reading: Between 2011 and 2025, the global merchant fleet grew from 959 to 1,666 million GRT, representing a 75% increase.
International transport is largely unregulated
Around the world, the aviation and maritime sectors benefit from particularly favorable tax and regulatory regimes: reduced fuel taxes, exemptions from VAT or corporate income taxes, and special provisions in climate agreements.
Aviation kerosene is one of the few fuels exempted from tax
In 1944, the Chicago Convention prohibited taxes on items carried on board (fuel, provisions, equipment, etc.) when landing at an airport during an international flight and regulated airport taxes. Since this convention does not prohibit taxes on kerosene purchased during a stopover, bilateral agreements have generally established this exemption. In July 2021, the European Commission proposed a revision of the Energy Taxation Directive174 to allow for a phased-in taxation of jet fuel for intra-European flights, thereby beginning to align energy taxation with the EU’s climate goals. As of early 2026, this proposal has not yet been finalized.
Taken individually, states are ill-equipped to regulate international transportation and address its negative impacts. In a context of global market liberalization, trade flows can, for example, be rerouted to avoid ports or airports that are too costly. More fundamentally, the rise of flags of convenience within the global merchant fleet provides an excellent example of how multinational corporations pit nations against one another to drive down social and environmental standards.
The indirect environmental impacts of globalisation
As we have seen previously, a significant portion of the pressures on planetary boundaries is linked to global value chains and current forms of international trade. While certain impacts can be directly attributed to international trade (particularly transportation), it is more difficult to do so for others. Indeed, without trade, many importing countries would be forced to carry out the relevant activities on their own soil, thereby relocating the impacts to their own territory.
However, several factors suggest that international trade increases pressure on planetary boundaries and on populations, beyond the transportation sector alone.
- Hide this pollution from my sight: people in importing countries are far removed from the pollution and harm caused by the products they consume. These problems occur in poorer countries, which are often undemocratic, with weak environmental protections and limited capacity for their populations to speak out and seek redress for the harm they have suffered.
- The vicious cycle of overproduction and overconsumption: in many sectors, economies of scale175 are so significant that selling the entire output requires access to international markets. Companies like Shein and Temu could never have gotten off the ground without access to Western markets. The very low prices resulting from economies of scale, as well as low labor costs and lax environmental, health, and safety standards, are factors driving overconsumption.
- Blackmail by Multinational Corporations: Market Power176 The immense power of multinational corporations at the head of global value chains allows them to pit governments against one another to secure the most favorable social and environmental conditions—and thus the lowest prices. This exerts downward pressure on standards where they exist, while preventing progress in countries where they are already weak or nonexistent.
Below, we provide a few examples from various sectors.
Deforestation
Surprisingly, there are few studies on the impact of international trade on deforestation. The most recent study177, published in 2022, which focuses only on the period 2011–2015, estimates that 90% of tropical deforestation is attributable to agriculture. Of this agriculture-related deforestation, slightly more than half is linked to production178 of which about a quarter is attributable to international demand.
Agriculture is the main driver of deforestation
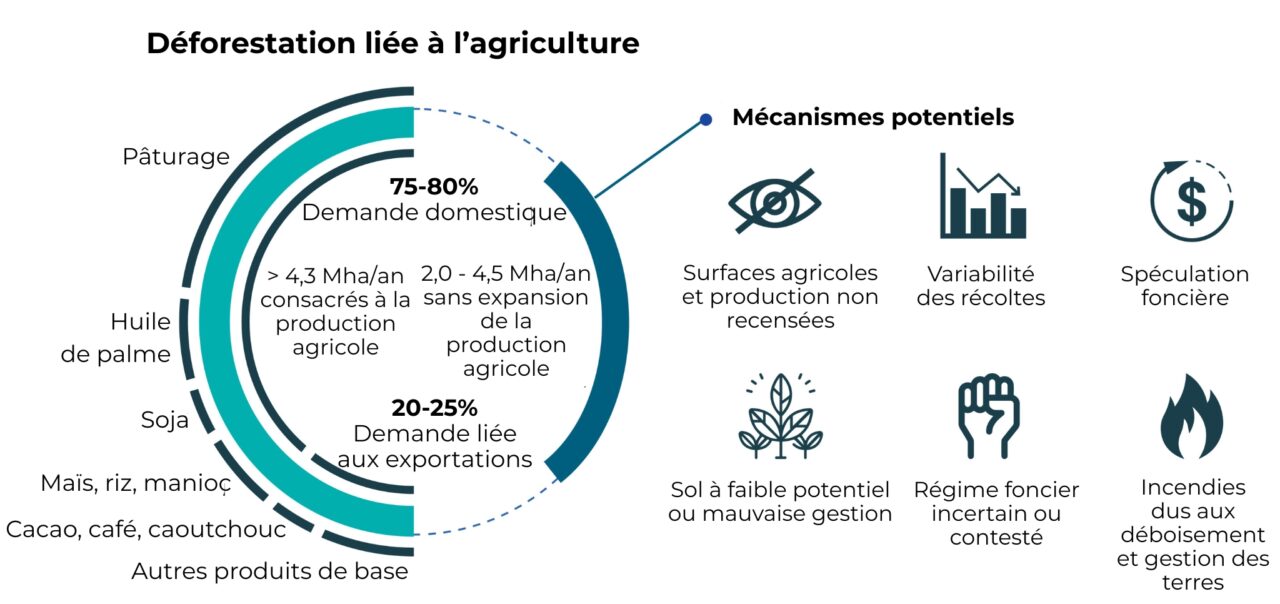
Source: Florence Pendrill et al., “Disentangling the numbers behind agriculture-driven tropical deforestation,” Science, 2022.
As a result, forests are being converted into farmland to meet international demand for palm oil for the agribusiness sector, as well as to produce biofuels and to supply chocolate, coffee, rubber, and soybeans—which are used in the form of oilseed meal to feed livestock in Europe and China.
Indonesia exports massive quantities of palm oil and paper pulp179 from plantations that have replaced natural forests. Between 2001 and 2019, the country’s forest area decreased by 11% (9.79 million hectares), of which 32% (3.09 million hectares) were converted to oil palm plantations and 10% to plantations (acacia and eucalyptus) for pulp production.
By creating demand in forested countries to convert their forests into farmland, globalisation thus appears to be one of the causes of deforestation. Multinational corporations also play an important role in this process by exerting pressure on governments. This is the case, for example, with the four grain giants—known as the ABCD (Archer Daniels Midland, Bunge, Cargill, and Louis Dreyfus)—which are pushing for soybean exports180. We should also mention the case of the meat-processing company JBS181 (named after its founder, José Batista Sobrinho), whose 2021 carbon footprint was estimated at 421 MtCO2-eq182 (equivalent to Total’s energy emissions across all scopes). Its current slaughter capacity is 75,000 cattle, 14 million poultry, and 147,000 pigs per day. It exerts demonstrable pressure on public authorities to support the destruction of the Amazon rainforest. Its influence, particularly political, is clearly the result of globalisation.
Find out more
- Like an Aftertaste: The Hidden Side of Our Imported Foods, Mathilde Dupré and Stéphanie Kpenou, Veblen Institute, 2025
- Saving the Cerrado: Supermarkets, Bunge, and Governments Must Act Now, Mighty Earth, 2023
- European Commission Impact Assessment: “Minimizing the Risk of Deforestation and Forest Degradation Associated with Products Placed on the EU Market,” 2021
- Global Forest Resources Assessment, 2020 Remote Sensing Survey, Food and Agriculture Organization of the United Nations
Accidental pollution caused by industrial accidents
Since the dawn of the Industrial Revolution, industrial disasters have been all too common183 : mining tailings dam failures, nuclear accidents, chemical spills, and oil spills. They result from accidents, incompetence, negligence, or safety failures—and very often, from inadequate regulations. They result in deaths, injuries, destruction of the biosphere, and significant property damage. Very often, these industrial disasters are part of global value chains, particularly when it comes to the exploitation of natural resources.
Take, for example, the disaster that occurred in early 2025 in Zambia, a country coveted by China, among others, for its copper resources in particular. A tailings dam owned by Sino-Metals Leach Zambia (a subsidiary of the state-owned China Nonferrous Metals Industry Group) collapsed in early 2025, releasing approximately 50,000m³ of acidic waste into the Kafue River. However, about 60% of Zambia’s 20 million inhabitants live in the Kafue River basin and depend on it for fishing, irrigation, and industrial water supply. The river provides drinking water to approximately five million people, including those in the capital, Lusaka.
As a result of this massive pollution, the city of Kitwe, which has a population of about 700,000, was forced to completely suspend its drinking water supply. The spill also caused an ecological disaster, resulting in widespread fish deaths and the destruction of crops along the riverbanks.
Find out more
- Gabriel Santos Carneiro, Guilherme Magacho, Etienne Espagne, “Leveraging International Trade for the Ecological Transition: Quantifying the Drivers of Planetary Boundaries,” Ecological Economics, 2026 (working paper available for download on the AFD website)
- UNCTAD – Data Insights on Maritime Transport
- Manfred Lenzen et al. International Trade Drives Biodiversity Threats in Developing Nations, Nature, 2012
- CO2 Emissions in International Trade, Banque de France Bulletin, 2020
- Andrew K. Jorgenson, Environment, Development, and Ecologically Unequal Exchange, Sustainability, 2016
- Imported Emissions: From Co-Dependence to Cooperative Action, Carbone 4 and ECF, 2024
Institutions and international law prioritise trade at the expense of the environment
The current architecture of international institutions stems largely from World War II. It is characterized by the predominance of economic, financial, and trade institutions, in the wake of the traumas of the war and the 1929 crisis. While financial institutions have begun to take environmental concerns into account, this is not at all the case in the trade sector. As for those institutions created specifically to address environmental issues, they play a secondary role due to a lack of financial resources and the power to enforce their decisions.
The United Nations system was slow to incorporate environmental issues
Environmental issues now feature prominently in the UN’s discourse and agenda, as evidenced, for example, by the adoption of the Sustainable Development Goals at the United Nations General Assembly in September 2015.
That was not the case originally. According to Article 1 of the United Nations Charter, the objectives of the UN are: “To maintain international peace and security” and “to achieve international co-operation in solving international problems of an economic, social, cultural, or humanitarian character, and in promoting and encouraging respect for human rights and for fundamental freedoms for all without distinction as to race, sex, language, or religion“.
Furthermore, the environmental institutions within the United Nations system do not carry the same weight as the economic institutions and serve primarily as forums for data generation and exchange.
The United Nations System
Founded in March 1945, the United Nations has 193 member states (as of 2011, compared to 51 at its inception). The main governing bodies are the Security Council, each of whose five permanent members184 has veto power, the General Assembly, which brings together all member states, the Secretariat, the Economic and Social Council, and the International Court of Justice.
The United Nations System consists of the UN and two main types of organizations, each with its own leadership, budget, and member states.
- Fifteen independent specialized agencies185 : Whether they existed before the UN, were established at the same time, or in the decades that followed, they are funded by mandatory contributions from their member states and voluntary contributions, which may come from states as well as from private actors or other UN organizations. These include the International Labor Organization (ILO), the World Health Organization (WHO), and the International Monetary Fund (IMF).
- About 40 funds, programs, and other entities, whose role in the international architecture is less significant, particularly because they are not independent of the UN and are funded solely on a voluntary basis rather than through mandatory contributions. This is the case, for example, with the United Nations Children’s Fund (UNICEF), the World Food Program (WFP), the United Nations High Commissioner for Refugees (UNHCR), and the United Nations Environment Program (UNEP).
In these various institutions, the United States’ mandatory or voluntary contributions are often among the highest.
There are also other international organizations that are not part of the United Nations system. This is particularly true of the World Trade Organization (see Essential 7.3). Another example is the OECD, which brings together the so-called developed countries.
There is no high-level international organisation dedicated to the environment
The United Nations Conference on the Environment (also known as the Earth Summit), held in Stockholm in June 1972, marked the emergence of environmental issues within the United Nations system. In particular, it led to the creation of the United Nations Environment Programme (UNEP), which coordinates United Nations activities in the field of the environment and assists countries in implementing environmental policies.
Despite its important role, UNEP does not hold a very high status within the UN system. It is merely a UN program, and its resources are limited relative to the scope of its mission186.
Conversely, eleven of the fifteen187 specialized agencies (see box above) of the UN are dedicated to financial or economic issues. Some of these agencies have, since their inception, incorporated environmental issues, with varying degrees of commitment188. A proposal for a World Environment Organization was conceived in the 2000s and championed by NGOs, prominent figures, and politicians189 but it is currently at a standstill.
Institutions with international scientific expertise on the environment
These organizations help foster consensus on scientific knowledge and create opportunities for dialogue. They produce summaries—which are extremely useful to decision-makers around the world—on the global state of knowledge, whether regarding data, solutions (technical and socioeconomic), or possible pathways.
The two best-known ones are as follows.
The IPCC (Intergovernmental Panel on Climate Change) was established in 1988 at the request of the G7, under the auspices of UNEP and the World Meteorological Organization. It has 195 member states. It is responsible for synthesizing scientific knowledge on the extent, causes, consequences, and ways to address ongoing climate change.
Its counterpart in the field of biodiversity, the IPBES (Intergovernmental Science-Policy Platform on Biodiversity and Ecosystem Services), was established in 2012. It serves as a mechanism for liaison and coordination on biodiversity. Every United Nations member state can participate, and delegates also callfor “active civil society participation” in the process. As of 2023, 140 states were members.
The international legal framework on the environment
The international institutional framework for environmental protection is therefore based primarily on international treaties190, most of which have been concluded under the auspices of the UN or one of its specialized agencies. The EcoLex database on environmental law contains more than 500 multilateral treaties191 in force. Not all of them are of the same legal standing, and some do not have environmental protection as their primary purpose, such as the Antarctic Treaty (1959) or the United Nations Convention on the Law of the Sea (1994).
Among the key documents are the three United Nations framework conventions adopted following the Second Earth Summit held in Rio in 1992: on climate change, on biological diversity, and on combating desertification. Each has a secretariat hosted by the UN and regularly organizes COPs (Conferences of the Parties), where the States Parties to the convention negotiate new commitments.
The Climate Conferences (COPs) have resulted in two landmark agreements: the Kyoto Protocol in 1997 and the Paris Agreement in 2015. We should also mention the Montreal Protocol on Substances that Deplete the Ozone Layer, adopted in 1987 and amended by the Kigali Amendment (2016), which calls for the phase-out of hydrofluorocarbons (HFCs)192.
Trade in Climate Talks
Despite globalisation’s impact on the climate, trade is conspicuously absent from international climate negotiations: the word does not appear in the 2015 Paris Climate Agreement.
Ten years later, trade tensions took center stage at COP30, held in Belém, Brazil. Emerging economies—particularly China, India, Turkey, and South Africa—criticized the European Union’s plan to implement a Carbon Border Adjustment Mechanism193 which they interpret as a unilateral protectionist measure.
In the texts resulting from COP30, the term is now included, but only to affirm the primacy of trade over climate.“The Conference of the Parties […] reaffirms that measures taken to combat climate change, including unilateral ones, should not constitute a means of arbitrary or unjustifiable discrimination or a disguised restriction on international trade.” 194
In France in 2017, a civil society coalition launched a draft Global Pact for the Environment to affirm the right to a healthy environment alongside the two international covenants on civil and political rights and on economic, social, and cultural rights. The process was blocked in 2019 by a coalition of countries, including the United States and Brazil195 and resulted only in a declaration in 2022.
There is, therefore, indeed an international legal framework on the environment. Given the results in the fight against global warming and the loss of biodiversity, one cannot help but conclude that this framework remains inadequate.
Environmental issues are a relatively new topic for major financial institutions
The IMF and the World Bank were established by the Bretton Woods Conference in 1944
The goal of the Bretton Woods Conference was to establish a stable international monetary system and to promote reconstruction and economic development. Although 44 nations participated in the negotiations, the Bretton Woods agreements bore the distinct mark of the two main protagonists, the United States and the United Kingdom.
In monetary terms, they result in a system centered on the U.S. dollar, which is nominally pegged to gold196. All other “major” currencies were defined by a system of fixed exchange rates against the dollar. The dollar’s supremacy on the international stage dates back to Bretton Woods, a dominance that did not end with U.S. President Richard Nixon’s 1971 decision to end the fixed exchange rate regime (and the dollar’s link to gold). The dollar remains the leading currency in international trade.
The Bretton Woods Agreements provided for the establishment of two institutions that would later be incorporated into the United Nations system.
The International Monetary Fund is responsible for ensuring the stability of the international monetary system, monitoring the risks of financial crises, and assisting countries in difficulty (for a long time, in exchange for harsh and not always effective structural adjustment programs…).
The International Bank for Reconstruction and Development (IBRD), which is now part of the World Bank Group197, was originally established to finance the postwar reconstruction of Europe and Japan. Today, it focuses on fighting poverty (through aid, financing, and advice to countries in need) and is developing climate finance initiatives.
Since the governance of these institutions stems largely from the financial contributions of their member states, the United States plays a dominant role in them.
A belated recognition of environmental issues
The IMF and the World Bank have the ability to provide aid or loans to countries and can therefore influence economic policies by requiring the adoption of certain measures. This is precisely what the Washington Consensus reflects.
The Washington Consensus and structural adjustment programmes
In an article published in 1990, British economist John Williamson describes the consensus among Washington’s political and economic elites198 regarding the major measures that Latin American countries needed to implement to address the debt crisis of the 1980s. Inspired by neoliberalism, these measures—often grouped under the term “structural adjustment programs”—aim, in particular, to reduce public spending, open up capital markets, liberalise trade, privatize public enterprises, and protect intellectual property. The term “Washington Consensus” thus reflects the tacit agreement between the IMF, the World Bank, and the U.S. government to make financial aid from the Bretton Woods institutions to struggling countries in the Global South conditional on the adoption of structural adjustment plans incorporating these economic “best practices.”
Source: What Washington Means by Policy Reform, in Latin American Adjustment: How Much Has Happened?, edited by John Williamson, 1990.
This consensus has gradually eroded, and approaches have become less dogmatic. In addition, the Bretton Woods institutions have begun to take environmental and climate issues into account. The World Bank established an environmental division in 1980. Its commitment strengthened following the 1992 Earth Summit in Rio. Today, it funds numerous climate-related projects, including the reduction of greenhouse gas emissions, the energy transition (renewable energy, energy efficiency), and adaptation to climate change (water management, agricultural resilience). It launched a Climate Change Action Plan in 2016 (renewed in 2021 and 2025), setting goals for integrating climate considerations into its financing. It should also be noted that most regional and national development banks have likewise integrated environmental issues—particularly climate-related ones—to varying degrees.
International funds dedicated to the environment
Among international financial institutions, there are funds that specialize in environmental issues. Established in 1991 by the World Bank, UNEP, and UNDP199, the Global Environment Facility (GEF) comprises several funds designed to help developing countries achieve the environmental goals set forth in six international conventions200. Of the 186 participating countries, 29 took part in the 8th GEF Replenishment Session, contributing less than $5.5 billion for the 2022–2026 period.
Established at the COP17 climate conference in Bonn in 2011, the Green Climate Fund mobilizes funding to help developing countries meet their climate goals. During its first funding period (2020–2023), it raised less than $10 billion.
While these initiatives are important, the funds raised are extremely small compared to the estimated global cost of the ecological transition, which runs into the trillions of dollars201.
The IMF began addressing climate issues following the signing of the Paris Climate Agreement (2015), which prompted it—like many financial institutions—to take into account systemic financial risks related to climate change.
Since 2021, the IMF has stepped up its efforts by assessing the impact of climate-related disasters on countries’ economic stability, encouraging the implementation of carbon taxes to limit GHG emissions, and by establishing, in 2022, a Trust Fund for Resilience and Sustainability to help vulnerable countries address structural challenges such as climate change and pandemics.
Since 2025, under the leadership of Donald Trump, the U.S. administration—which is the largest contributor to the IMF and the World Bank—has been asking these two institutions to backtrack on these issues, which it considers to be outside their mandate.202
The Environmental Impact of International Trade: A Non-Issue
Free trade lies at the heart of the prevailing view of what trade should be: within this framework, environmental regulations are seen as obstacles.
A bit of history: from the creation of the GATT to the WTO
Drafted during the United Nations Conference on Trade and Employment (Nov. 1947–March 1948), the Havana Charter established an International Trade Organization (ITO) to complement the international economic governance system resulting from the Bretton Woods agreements. Since the Charter was never ratified due to opposition from the U.S. Congress, the OIC never came into being. Its scope was broader than that of the institutions that ultimately emerged (GATT and the WTO): its aim was not only to promote trade liberalization but also to foster development, preserve employment, and ensure a balanced balance of payments.203
Trade negotiations conducted in parallel led, in October 1947, to the signing by 23 countries of the General Agreement on Tariffs and Trade (GATT)204. Based on a free-trade philosophy, this agreement established a number of rules governing international trade in goods205 as well as 45,000 tariff concessions206 covering one-fifth of world trade. Its primary goal is to eliminate tariff and non-tariff “distortions” to trade207.
The provisional organization that emerged from this initial agreement served as the framework for multilateral trade negotiations for nearly 50 years. The various GATT rounds gradually expanded the scope of sectors affected by trade liberalization.
The Uruguay Round (1986–1994), the last round of negotiations to produce results, led to the creation of the World Trade Organization (WTO) with the signing of the Marrakesh Agreement.
Established in 1995, the WTO—which had 166 members in 2024—is responsible for promoting the implementation, administration, operation, and achievement of the objectives of the Multilateral Trade Agreements208 concluded by its members and to settle disputes that may arise between them.
The absence of environmental issues
The WTO’s primary focus is the expansion of international trade and free trade. Environmental issues are of secondary importance and are often even viewed as “excuses” for erecting trade barriers.
In dispute resolution, it is up to the government that takes environmental concerns into account to demonstrate that it is not doing so for “protectionist” reasons or to favor its own goods. Legally speaking, the issues to be addressed are, of course, more specific and require a closer look, but the basic principle remains the same.
The WTO Dispute Settlement Body (DSB)
The WTO has one of the most active international dispute settlement mechanisms in the world. A dispute arises when a member government believes that another member is violating an agreement or a commitment made under the WTO.
Between the establishment of the WTO in 1995 and the end of 2023, 631 requests for consultations—the first step in the dispute settlement process—were submitted by WTO members. Among the decisions, some are particularly significant in the areas of the environment and public health. In 1998, the European Union’s ban on imports of hormone-treated beef was deemed to violate WTO rules, as was the U.S. ban on shrimp imports from countries that had not adopted fishing methods that protect sea turtles. On a different note, the WTO ruled that China’s restrictions on rare earth exports—justified by the need to preserve its natural resources—violated China’s commitments and were motivated by economic rather than environmental reasons.
In 2016, during the first Trump administration, the United States decided to block the appointment of new judges, which led to the ORD’s paralysis beginning in 2019.
See the dedicated page on the WTO website and the article “What Is the WTO Dispute Settlement Body?” on the vie-publique.fr website
As we explain in the Preconceived Idea on multilateralism and free trade, the establishment of the WTO also marked the peak of multilateralism, which has been in steady decline ever since. Instead, regional and—above all—bilateral trade agreements have proliferated, as have investment protection treaties. In these treaties, environmental and social issues essentially have the same status as in WTO agreements: measures implemented by governments in the name of these issues are viewed with suspicion, as pretexts for hindering trade and free trade. Furthermore, these treaties regularly include provisions for recourse to private arbitration tribunals209, which, as in the Energy Charter Treaty, regularly issue rulings unfavorable to governments pursuing climate policies.
Find out more
- The Charter of the United Nations
- The United Nations System
- The Ecolex Database on Environmental Law
- The General Agreement on Tariffs and Trade (GATT).
Winners and losers of globalisation
Globalisation is often portrayed as a driver of growth and progress for all. The promise—to improve people’s well-being, increase economic efficiency, and reduce inequalities among nations—has been partially fulfilled. One billion people have been lifted out of poverty in China and other Asian countries, while the cost of many consumer goods has fallen in developed economies, improving the purchasing power of some households.
However, contrary to the long-held belief that globalisation automatically creates winners everywhere, it also produces losers. The reason is simple: overall economic gains are distributed neither spontaneously nor equitably. On a global scale, it has upended major geopolitical balances and given rise to new power dynamics. Within countries, globalisation has created or exacerbated inequalities (see Essential 8.4).
A New Global Landscape
At the national level, the assessment of the benefits of globalisation has traditionally been based on indicators such as GDP growth and the current account balance210 or the country’s attractiveness to foreign investment. It should be noted that these indicators provide no information on many essential issues: the internal distribution of gains (in terms of purchasing power and employment), their long-term sustainability, and losses or vulnerabilities (such as exposure to climate change, dependence on finite natural resources, and the destruction of one’s own environment).
From this very incomplete perspective, we can identify three categories of countries.
- The structural winners of globalisation are the countries that have been able to internalize the benefits of international openness by developing endogenous productive capacities, specializing in high-value-added sectors, and establishing institutions capable of coordinating market openness, industrial policy, and a minimum level of social stability. However, as we will see in Essential 8.4, globalisation has not benefited everyone in these countries.
- “Intermediate” countries whose economies are based on static advantages (low wages, natural resources, position in value chains)—without sufficient structural transformation. Globalization may have benefited them, but these gains are precarious: a social uprising or a natural disaster can have a lasting impact on the country’s economic situation.
- The structural losers of globalisation are those countries that remain trapped in low-productivity specializations, characterized by weak institutional and redistributive capacity, and for which trade liberalization tends to reproduce—or even exacerbate—economic and social imbalances.
China, the US, and the EU are coming out on top in the great game of globalisation
China: From “the world’s factory” to a systemic power
China is undeniably the big winner of contemporary globalisation. Its gradual integration into the global economy—accelerated by its accession to the WTO in 2001—enabled it first to become the world’s manufacturing hub, and then to transform itself into a leading industrial, technological, and geopolitical power.
This success is certainly based on well-identified factors: an abundant and low-wage workforce, social discipline imposed by an authoritarian regime, lax environmental and health regulations for several decades, and an undervalued currency. But these elements are merely the backdrop to a far more decisive phenomenon: a state strategy211 deliberate, methodical, and consistent state strategy explicitly aimed at national power and sovereignty.
While many Western economists212 had predicted a lasting specialization in low-value-added segments, China is now a key player in strategic sectors: steel and advanced metallurgy, digital technology, artificial intelligence, batteries, electric vehicles, solar panels, civil nuclear power, shipbuilding, aviation, space, and the defense industry. It controls entire segments of global value chains213, including upstream segments, through access to critical raw materials.214
The United States: Financial and technological dominance; military power and soft power
The United States, already in a position of strength before the major turning point of globalisation, consolidated its global dominance215. Their power rests on control of the central levers of the global economy: the dollar occupies a central place in the international monetary system, giving the United States a considerable advantage in terms of financing and the external deficit. Major American technology companies dominate the digital sector, data, and artificial intelligence, contributing directly to the country’s military and strategic superiority while creating strong dependencies among their partners and allies, particularly in Europe. Added to this is an unparalleled capacity for cultural influence, which reinforces the appeal of the American model and its soft power.
The European Union: winning, despite being trapped by free trade
The European Union (EU) is undeniably one of the major beneficiaries of globalisation. Today, it is one of the most influential players in international trade, with a massive internal market and strong export capacity (of goods, services, and capital). It is the largest sender and recipient of foreign direct investment216. It plays a major role in international institutions and in shaping the norms of globalisation.
However, due to a particularly dogmatic interpretation of free trade, globalisation has created numerous vulnerabilities and dependencies within the EU. The extreme openness of the European market has exposed producers to increased competition from low-wage countries, particularly in Asia, leading to the partial deindustrialization of certain regions. The rejection of any common and ambitious industrial policy has hindered the emergence of strategic sectors in the digital and low-carbon technology fields, leading to dangerous dependencies. Significant dependence on energy and raw material imports, as well as exposure to climate risks and disruptions in global value chains217, limit its economic sovereignty. Finally, imbalances among member states—north versus south, long-standing members versus new members from the East—generate social and political tensions that threaten its very existence.
Find out more
- 1980: How Shenzhen Became the World’s Factory, excerpt from Multinational Corporations: A History of the Contemporary World , Olivier Petitjean, Ivan du Roy, La Découverte, 2015, on the Multinational Corporations Observatory website (December 9, 2025).
GDP growth and staggering levels of inequality: the case of India
Globalisation has, in particular, led to the emergence of a group of countries known as the BRICS218 —originally four major emerging economies (Brazil, Russia, India, and China), grouped under this acronym by economists—which, during the 2010s, formed a diplomatic bloc to exert influence on economic and political relations dominated by the United States and the EU.
India has followed an interesting trajectory among the countries that have benefited globally from globalisation219. With a relatively closed, state-controlled economy until the 1990s, India has integrated into globalisation primarily through the services sector, particularly in information technology, IT services, and the outsourcing of functions (back-office operations, software development, and engineering).
Cities such as Bangalore, Hyderabad, Pune, and Chennai have become key hubs in global value chains220 for digital services. By drawing on a large pool of skilled, English-speaking workers, this specialization has contributed to sustained economic growth since the 1990s and to the emergence of an urban middle class.
However, the benefits of this integration remain highly concentrated. The vast majority of jobs are in the informal sector221—that is, without contracts, with low wages, and virtually no social protection. Social, regional, and educational inequalities are among the highest in the world.222
We are more unequal today than we were during the British era.
Globalisation has thus reinforced a dual economy, in which high-tech hubs integrated into the global market coexist with a large number of workers who have little connection to these dynamics.
Find out more
- Economic Inequality in India: The “Billionaires’ Raj” Is Now More Unequal Than the British Colonial Raj, World Inequality Database (March 19, 2024)
- The obituary for Manmohan Singh, “architect of India’s modernization,” on the RFI website (12/26/2024)
Globalisation’s losing nations: marginalisation, dependence, and structural vulnerabilities
The “losing” nations are those whose integration into the global economy has taken place on fragile, dependent, or unequal terms, and for whom trade liberalization has not gone hand in hand with development. This is particularly true of countries whose integration into globalisation depends heavily on the exploitation and export of their natural resources. We explore this point in depth in the preconceived idea about the impact of globalisation on developing countries. Let’s take a closer look at South America here.
Latin America: between deindustrialization and financial dependence
Latin America occupies an intermediate—but overall disadvantageous—position in globalisation. Following a phase of import-substitution industrialization224, many countries underwent a liberal shift, opening their economies widely to trade and financial flows in the 1980s and 1990s, under pressure from institutions such as the IMF promoting the Washington Consensus225 —and, in some cases, facilitated by the rise to power of dictators more or less directly supported by the United States.
This opening up has often led to premature deindustrialization226. Unable to compete with Asia on costs or technology, several countries refocused on exporting raw materials (soybeans, minerals, oil), temporarily benefiting from the commodities “supercycle”227 in the 2000s.
Countries such as Argentina and Venezuela illustrate the limitations of this model: heavy dependence on global markets, macroeconomic instability, vulnerability to price shocks, and internal redistributive conflicts. Mexico, although integrated into North American value chains, remains largely confined to low-value-added segments.
Finally, it is worth noting that the expansion of legal international trade has also facilitated the growth of illicit trafficking (particularly in drugs and weapons), which has severely affected certain countries in the region.
[The current political approach] remains rooted in a fatalistic stance, influenced by ultraliberal rhetoric: “We have no choice; if we want goods to move as quickly as possible, we must regulate as little as possible.” This is a short-sighted and harmful view. It ignores the fact that the illegal economy is intertwined with the legal economy and directly impacts it.
Globalisation has thus exacerbated economic volatility and social inequalities, without fostering sustainable productive transformation.
The Divide Between Mobile and Non-Mobile actors
In most countries, globalisation has been accompanied by a marked increase in social and regional inequalities. While certain social groups have seen their incomes and opportunities rise, others have suffered lasting losses in terms of employment, wages, and economic security.
French economist Guillaume Vuillemey229 offers a particularly illuminating framework for understanding this dynamic, based on the distinction between “mobile” and “non-mobile” actors. Mobile actors are individuals or companies that can move easily on a global scale, choose among different tax, legal, and social systems, and thereby maximize their private interests. Immobile actors, by contrast, are those who depend on a given territory for their business activities, income, and access to public services and social protection.
This contrast reflects not only a difference in income but also a fundamental asymmetry of power. Mobile actors can benefit from public goods (infrastructure, institutional stability, a skilled workforce) without contributing proportionally to them, while non-mobile actors bear the bulk of the tax and social burden.
Vuillemey and Giraud: two complementary approaches
Pierre-Noël Giraud230 had, prior to Guillaume Vuillemey, highlighted a similar distinction between “nomads” and “sedentary” groups. However, according to Giraud, “nomads” refer to all workers and companies exposed to international competition, which includes a significant portion of employees in developed countries. Vuillemey adopts a more restrictive definition: the “mobile” are essentially those with very high incomes and multinational corporations—that is, those who have genuine freedom of location. The two approaches are complementary: one emphasizes exposure to trade, while the other emphasizes the actual ability to escape national constraints.
Multinational corporations and the ultra-wealthy are the undisputed winners of globalisation
Their size, financial resources, and mobility enable multinational companies231 to take full advantage of open markets. They can relocate their operations and organize their value chains232 on a global scale, and optimize their tax situation by arbitraging between different national tax systems. In Key Point 5, we show how they pit regions against one another to their own advantage.
Globalisation has also fostered economies of scale233 , leading to high levels of concentration in many sectors. The financial sector (banks, insurance, investment funds, trading, etc.), the digital sector, logistics, and international transportation are particularly affected. These companies benefit from the infrastructure and human capital provided by governments, while often contributing far less—proportionally speaking—than their size would suggest (whether in terms of revenue, profits, or workforce) to the funding of public goods.
We detail the extent of the profits (both financial and in terms of power) reaped by multinational corporations in Essential 9.
The ultra-wealthy234 are also the major beneficiaries of globalisation. In fact, part of their enormous financial wealth comes from their stakes in the capital of multinational corporations, which grow as a result of rising stock prices or dividend payments. The liberalization of capital flows has also enabled them to develop strategies to avoid paying taxes. Their dominant role in the management of many large companies (particularly in media empires), combined with the influence their wealth affords them, enables them to shape public policy to their advantage, particularly regarding wealth and inheritance taxes.
“Non-mobile” actors bear the brunt of globalisation and suffer the consequences
At the other end of the spectrum, even in countries generally considered to have benefited from globalisation (see Essential 8.1), “small” economic actors have in fact suffered as a result. Let us illustrate this point with the examples of the United States and China.
Inequality and the erosion of workers’ power
The United States
The industrial regions of the Midwest and the Northeast, the famous Rust Belt235, have lost millions of manufacturing jobs since the 1980s due to the combined effects of international competition (the arrival of cheaper products on the market), automation, and offshoring (due to competition among states over tax rates and wages by multinational corporations).
The work of David Autor, David Dorn, and Gordon Hanson236 shows that in the United States, China’s accession to the WTO in 2001 caused a massive shock to certain industrial regions. Workers who lost their jobs due to competition from Chinese imports often experienced a lasting deterioration in their circumstances: lower wages for those who found new jobs, withdrawal from the labor market for others, and increased social vulnerability.237
More generally, the United States has experienced increased social polarization in recent decades, marked by a high concentration of income and wealth. For example, the richest 10 % now account for nearly 1.8 times as much income as the poorest 40 %, a gap far wider than in many other developed economies238. Wealth inequality is also particularly pronounced: the wealthiest hold the vast majority of national wealth, while the bottom half of the population owns only a marginal share. This concentration is associated with significant disparities in life expectancy and health across socioeconomic groups239 . All of this fuels a deep division in American society, with heightened tensions between regions and social classes, marked political divides, and rifts over issues such as health care, education, and prospects for social mobility.
China
China’s success has been accompanied by marked regional disparities between the export-oriented coastal regions and the inland provinces, as well as growing social inequalities.
Nearly 800 million people have been lifted out of extreme poverty240 since 1980, by working in factories producing goods for Western countries and, increasingly, for the domestic market. China is, however, one of the most unequal countries in the world: the Gini coefficient241 stands at around 0.5242, is much higher than in European countries.
Let’s limit ourselves to a few other highlights. Numerous reports243 indicate that hundreds of thousands Uighurs are being held in labor camps in the Xinjiang region. The Chinese government officially describes these centers as“vocational training” programs designed to combat“religious extremism.” Investigations show that many detainees are subjected to forced labor in industries such as textiles, agriculture (cotton, tomatoes), and electronics.
More generally, in China, in certain industries—particularly electronics and textiles—working conditions are very difficult : high production rates , dormitory-style housing, and restrictions on breaks. The “9-9-6” work culture (9 a.m. to 9 p.m., 6 days a week) is common in tech companies. Unions are controlled by the government through the All-China Federation of Trade Unions (ACFTU) and therefore have no real power.
Small and medium-sized enterprises benefit little from globalisation
Whether or not companies are able to take advantage of market liberalization depends on several structural factors: the company’s size, its industry, its technological positioning, its access to financing, its integration into production networks, and its ability to integrate into global value chains. The “mobile” versus “immobile” distinction proposed by Guillaume Vuillemey applies to firms and overlaps quite significantly with the size criterion.244
Smaller businesses are generally more vulnerable
The Work of the OECD245 shows that the likelihood of exporting, innovating, and withstanding international competition increases significantly with company size. Globally, very few microenterprises (very small enterprises, with fewer than 10 employees) export directly, unlike the majority of large firms, with medium-sized enterprises (MSEs) occupying an intermediate position.Although they participate little or not at all in international trade, VSEs are nonetheless particularly vulnerable to the indirect effects of globalisation: competitive pressure on prices, rising rents and land costs in attractive areas, and increased national and local taxes weighing on locally based businesses due to revenue losses resulting from tax evasion by multinational corporations
The role of the industry sector
Domestic industrial firms producing standardized goods—such as textiles, furniture, or undifferentiated intermediate components—have been particularly vulnerable to increased competition from low-wage countries. Empirical studies show that a surge in imports from low-wage countries exerts strong downward pressure on the prices of manufactured goods, leading to reduced profit margins and the exit of certain firms from the market. For example, a study published in 2013246 covering 110 manufacturing industries in Europe shows that a 1% increase in the market share of imports from low-wage countries results in a decline in European producer prices of approximately 3% and a significant reduction in manufacturing employment due to the closure of the least competitive firms.
In the services sector, the situation is mixed. Non-tradable services (food services, personal services, local crafts) are not directly exposed to international trade, but are affected indirectly through territorial polarization and declining purchasing power in deindustrialized regions. Furthermore, as businesses rooted in a specific region, they are indirectly affected by tax evasion by multinational corporations, which shifts the burden of national taxation onto non-mobile businesses.
Conversely, some service-sector SMEs (IT, engineering, design, consulting) have taken advantage of the development and widespread adoption of digital tools to outsource part of their operations to countries with lower wages and/or more favorable tax rates.
Integration into Global Value Chains: an ambivalent opportunity
A growing number of SMEs are subcontractors integrated into global value chains led by large multinational corporations. This integration can offer stable business opportunities, access to international markets, and technology transfers. However, it often places SMEs in a position of dependence. The contracting companies capture the bulk of the value added, impose strict constraints on prices, deadlines, and standards, and can quickly relocate their orders. As a result, many industrial SMEs find themselves trapped in low-value-added segments, with little ability to move up the value chain.
Rethinking Globalisation
Globalisation cannot be understood as either a zero-sum game or a uniformly beneficial process. It has enabled certain nations to consolidate (or, in the case of China, to regain) their power on the international stage. It has benefited certain individuals and companies (generally the most “mobile” ones), but it has also produced lasting losers, most often among the “immobile” ones, who are dependent on a specific territory, sector, or resource. Finally, it should be emphasized that the planet itself is also one of the major losers of globalisation has it has accelerated and amplified the exploitation of natural resources and pollution (see Essential 6 on planetary boundaries).
Understanding the Mechanisms at Work—Economic, Social, Territorial, and Institutional247 —is a necessary condition for rethinking public policy. Without redistribution, without industrial policy, and without governance of natural resources, the benefits of globalisation are concentrated, to the detriment of social and political cohesion. Rethinking globalisation does not necessarily mean rejecting it, but rather seeking to make it a more equitable and sustainable process.
Find out more
- Daron Acemoglu and James Robinson Why Nations Fail: The Origins of Power, Prosperity, and Poverty, Flammarion, 2025
- The work of economists David Autor, David Dorn, and Gordon Hanson on the “China shock.” And the work subsequently conducted by David Autor
- Guillaume Vuillemey, The Age of Deglobalization: Protecting the Commons from Free Trade , Seuil, 2022
- Pierre-Noël Giraud, Inequality in the World. The Economy of the Contemporary World , Gallimard, 1996 (reprinted in 2019)
- See also in this module the Essential on Multinational Corporations below, and the Preconceived idea on the Impacts of Globalisation on developing countries.”
Globalisation has increased the power and profits of multinational corporations
During the second half of the 20th century, globalisation was accompanied by a rise in the power of multinational corporations (or transnational corporations, TNCs).248
Economic and technological developments, combined with changes in the regulatory and institutional framework, have strengthened the market power of dominant players, who have thrived on the weakening of countervailing forces (both public and civil society) and even on the co-optation of public regulations. Across all sectors, markets are becoming more concentrated.
Leading Global Value Chains249 increasingly complex global value chains, multinational corporations are taking advantage of the growing fragmentation of production to locate operations where it is most advantageous—that is, where labor laws and environmental protections are weakest—and to shift profits to where they are taxed the least. The excessive market power of the largest players leads to rent-seeking capitalism.
Multinational companies dominate international trade
The influence of multinational corporations on global trade is not a new phenomenon
During the Industrial Revolution, the emergence of multinational corporations addressed two main needs:
- to ensure the supply of exotic goods (coffee, tea, tropical fruits, spices, precious stones, etc.) to European countries and then to the United States, as well as raw materials for the manufacturing industry (such as fabric for the textile industry).
- increase production to take advantage of economies of scale (see box below), and sell off surpluses when production exceeds the absorption capacity of domestic markets. This reality is reflected in the idea that, with the Industrial Revolution, Western countries shifted from a supply-driven economy to a demand-driven economy.
Definition – Economies of Scale
A company is said to achieve economies of scale when the production costs of an additional unit of a good or service decrease as production volumes increase. Returns are therefore increasing.
There are two main categories of production costs:
- Fixed costs are necessary regardless of the volume produced: these consist primarily of capital expenditures (research and development, preliminary studies, planning and design, plant construction, machinery purchases, advertising and marketing, etc.);
- Variable costs depend on production volumes (raw materials incorporated into the product, energy and water consumed during the production process, wages for the staff producing the product, etc.)
The higher the fixed costs, the greater the potential for economies of scale: by increasing production, the firm spreads its fixed costs over a growing number of units until they are fully amortized. As volumes increase, the marginal cost (that is, the cost of producing one additional unit) decreases, and may even become zero in sectors where variable costs are virtually nonexistent (such as software).250
Economies of scale lead to the concentration of firms— that is, to a reduction in their number, or even to the formation of oligopolies or monopolies. In sectors such as the automotive, aerospace, heavy manufacturing, and pharmaceutical industries, companies must not only be able to make massive investments (and thus have solid financial backing) but also have access to a sufficiently large market of solvent consumers to sell their products. When a few companies have established themselves in such a market, it is particularly difficult for a new entrant to gain a foothold.
Economies of scale are also a driving force behind the growth of multinational corporations: in sectors requiring very large initial investments, domestic markets may be too small to absorb the output needed to make those investments profitable.
Hyper-globalisation has cemented the dominance of multinational firms
Global exports today are dominated by very large companies, most of them TNCs [transnational corporations]. Large firms have become the most relevant actors in international trade.
Today, international trade takes place primarily within their networks of subsidiaries, contractual partners, service providers, and external suppliers. According to UNCTAD, trade involving multinational corporations accounted for 80% of total trade in 2010 (30% of which was intra-group trade).
Global Exports of Goods and Services: A Breakdown of Multinational Corporations’ Involvement (2010)
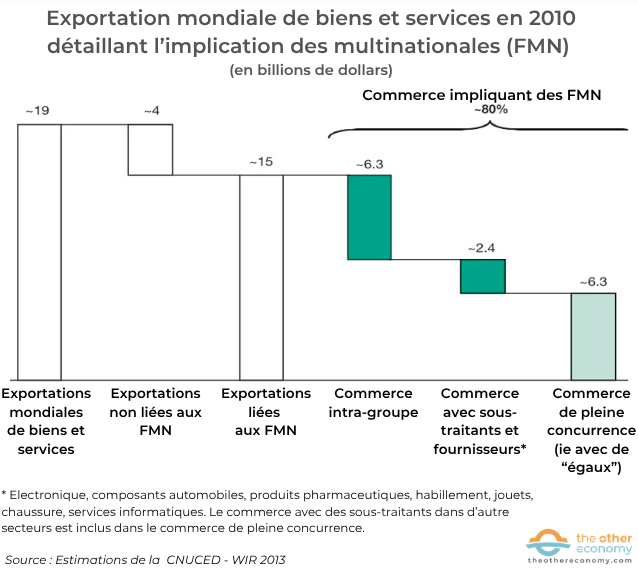
Source: UNCTAD’s World Investment Report 2013 (Chapter IV, Figure IV.14, and Box IV.3)
Reading: In 2010, international exports of goods and services totaled 19 trillion dollars (19,000 billion). Of this total, trade involving multinational corporations (MNCs) amounted to $15 trillion, or just under 80% of global exports. 33% (6.3 trillion) came from trade between companies within the same multinational (intra-group trade), 12.5%251 result from contractual relationships between a multinational corporation and a subcontractor or supplier (NEM)252 and 33% werearm’s-length transactions, that is, between independent entities on an equal footing.
Export markets are highly concentrated, meaning they are dominated by a small number of companies.
As can be seen in the following graph, for all the countries considered, in 2014, 57% of national exports were generated by just 1% of exporting companies.
Average share of the top 1%, 5%, and 25% of exporters in total national exports, 1997–2014
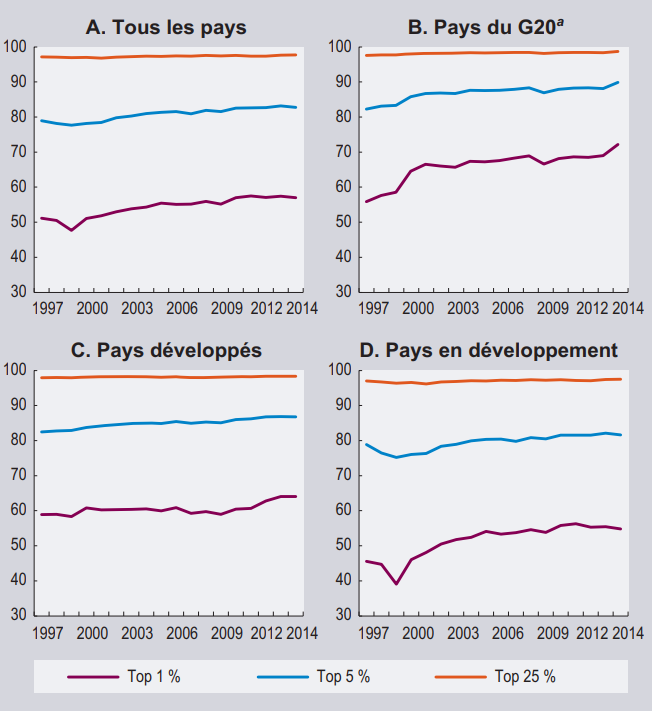
Source: Trade and Development Report 2018, Chapter 2, UNCTAD
Note: Calculations by the UNCTAD secretariat, based on the Exporter Dynamics Database, which covers merchandise exports (excluding petroleum products) from nearly 70 countries (including about 15 developed countries) from 1997 to 2014. See the complete list of countries.
The G20 countries included in the database are: South Africa, Germany, Brazil, Mexico, and Turkey.
Finally, this very high level of market concentration is accompanied by a faster increase in profits than in revenue at the top of the multinational corporate hierarchy. This trend reflects the success of the rent-seeking strategy (see next section) that goes hand in hand with the growth in these firms’ market power.
Profits at the largest multinational corporations are growing faster than their revenue
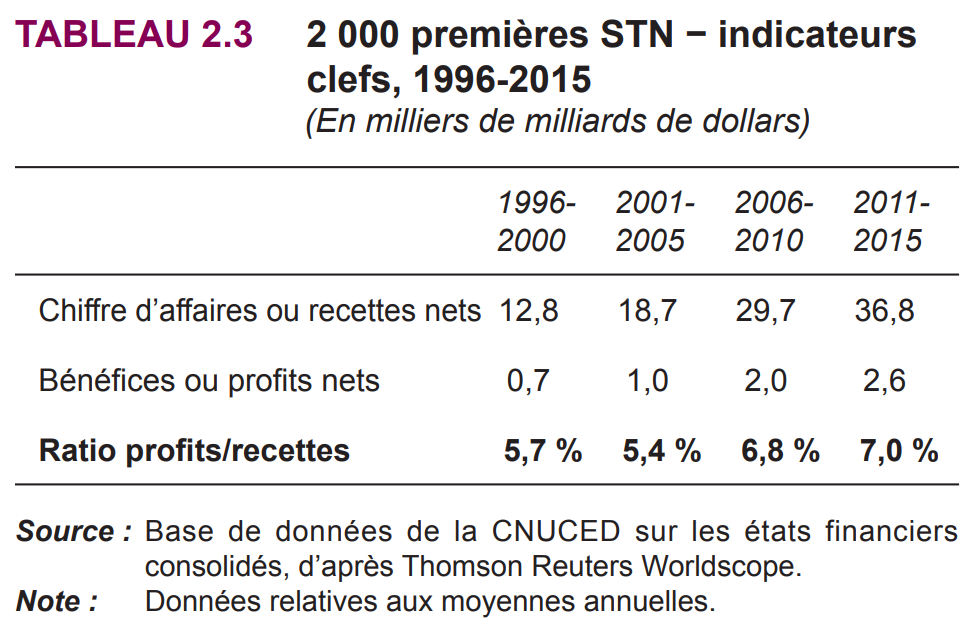
Source: Trade and Development Report 2018, Chapter 2, UNCTAD
STN = transnational corporations (this is equivalent to MNCs).
Reading: Revenue for the top 2,000 multinational corporations rose from an average of 12,800 billion dollars over the 1996–2000 period to 36,800 billion dollars over the 2011–2015 period, a 2.8-fold increase. Profits, meanwhile, increased by a factor of 3.7.
The increase of multinationals’ market power and the rise of rent-seeking capitalism
Starting in the 1980s, as we will see, the combination of certain economic and technological factors and favorable changes in the institutional and regulatory environment—which was particularly conducive to multinational corporations—led to an increase in market power253 of multinational corporations.
This enabled them to implement strategies to maximize their profits, based on erecting more barriers to entry for new players, pitting governments against workers, and outsourcing risks (see Essential 9.3).
Broadly speaking, rents refer to income derived solely from the ownership and control of assets, rather than from innovative entrepreneurial activity and the productive use of labour.
How the financialisation of the economy has fueled the pursuit of economic rent
The financialisation of the economy—one aspect of hyper-globalisation—has manifested itself in the growing power of financial actors (investment funds, asset managers, banks, etc.) over the real economy. Research on global corporate ownership networks254 has thus shown that a small group of financial multinationals controls a significant share of the world’s largest companies, thereby forming a sort of economic “super-entity.”
The idea that the primary (or even sole) purpose of companies is to maximize profits to satisfy shareholders and other financial investors has thus increasingly found its way into the governance practices—and therefore the strategy—of the largest companies (and, consequently, into the practices of their subcontractors and suppliers). One consequence of this is the importance of rent-seeking in the strategies of large companies.
Economic and technological factors that increase the market power of large multinationals
The dramatic decline in transportation costs, along with the emergence of information and communication technologies, has greatly contributed to the development of global value chains by reducing costs and facilitating the coordination of complex production chains involving a large number of participants.
High-tech sectors have grown in importance within production structures; however, economies of scale and network effects (see box) are strong in these sectors, making it more difficult for new players to enter the market.
Definitions: barriers to entry, economies of scale, network effects
Economies of scale and network effects are two economic phenomena that give established players an advantage by making it very difficult for new players to enter a given market. These are referred to as barriers to entry. While economies of scale emerged with the Industrial Revolution, network effects have become particularly evident with the development of information and digital technologies.
As explained in the box on economies of scale, when fixed costs dominate an industry, this gives rise to economies of scale: the production costs per additional unit decrease as production volume increases. With this type of production structure, the larger the initial investment required, the higher the barriers to entry: a new entrant must both secure substantial financing and quickly acquire enough customers to become profitable.
Network effects, also known as“demand-side economies of scale,” refer to a situation in which the utility of a good or service depends on the number of its users. This is the case with many information technologies. There’s not much point in being the only one with a phone! The growth of most digital platforms relies on network effects. The success of Google, Airbnb, Uber, Facebook, Le Bon Coin, and Amazon is linked to their very large number of users (whether consumers, sellers, or producers). Here, too, established companies have, for obvious reasons, a clear advantage over new entrants.
Intangible assets (see box below) have become increasingly important on companies’ balance sheets.
By definition, these assets are intangible: they can therefore be located anywhere. The only factor that matters is the location of the entity that owns them. This characteristic provides multinational corporations with a very powerful tool for arbitrating between different jurisdictions: it has greatly facilitated tax avoidance practices by TNCs, thereby placing them in a more favorable position than their domestic competitors (see Essential 9.3).
Such practices are not new, as illustrated by Nestlé’s pioneering example: as early as 1926, the multinational established its subsidiary API in the Swiss canton of Glarus, which had a favorable tax regime, and registered its patents and trademarks there. API then charged royalties for their use to the group’s foreign subsidiaries located in countries with higher tax rates.255
However, they have become widespread as a result of hyper-globalisation.
Definition – What are intangible assets?
On a company’s balance sheet, there are three types of fixed assets (i.e., assets that have long-term value for the company):
- Tangible assets: these are physical assets (buildings, machinery, vehicles, computer equipment, land, etc.);
- financial assets: stocks or bonds of other companies, receivables, security deposits, etc.;
- Intangible assets: These are intangible “assets” such as intellectual property rights (patents, trademarks, copyrights, software, customer databases, industrial designs, etc.), goodwill, or leasehold rights. When a company acquires an equity interest in another company, the goodwill256 is also included in intangible assets.
According to several studies, intangible assets account for a growing share of corporate value: 90% of the market value of S&P 500 companies today, compared with less than 20% in the 1970s257.
While these figures reflect reality, they must nevertheless be viewed with some caution. These studies, in fact, adopt a very broad definition of these assets. They thus incorporate concepts such as a company’s “reputational” or “organizational” capital, which are not reflected in the company’s financial statements.258
Multinational companies have capitalised on the success of neoliberal theories to shape the institutional and political environment in their favour
The behavior of multinational corporations is determined by the regulations of the jurisdictions in which they operate, as well as by their ability to shape those rules and adapt to them.
As explained in Essential 2, the neoliberal shift of the 1980s was characterized by changes in public policy that favored multinational corporations: financial deregulation, free movement of goods, services, and capital, “flexibilisation” of labor markets, lax enforcement and subsequent dismantling of antitrust laws259 whose very purpose is to prevent any single company from dominating a market.
By giving multinational corporations significant leeway to locate their operations and profits wherever they choose, these policies have strengthened their bargaining power vis-à-vis governments and unions—and thus their ability to shape the regulatory environment to their advantage— which they do not hesitate to do, through extensive lobbying, threats of relocation, or warnings of negative impacts that would ripple through the entire economy if they were subjected to too many “restrictions.”
Free trade at the service of multinational corporations
In the decades following World War II, international trade negotiations conducted within a multilateral framework (that of the GATT, which led to the creation of the WTO in 1995) were primarily aimed at reducing tariffs.
Already favoring multinational corporations, the scope of these negotiations expanded dramatically beginning in the 1980s and moved beyond the multilateral framework (thus becoming significantly less transparent). The number of bilateral or regional trade agreements skyrocketed260 and their content has evolved. They increasingly cover a wider range of areas: intellectual property protection (see next point), the opening of capital markets and investment protection, access to public procurement, sanitary and phytosanitary measures, etc. Agreements specifically dedicated to investor protection have also multiplied.
As UNCTAD notes, multinational corporations—“whose headquarters are predominantly located in developed countries—have found themselves in a privileged position to influence the formulation of rules and reorganize large segments of global production, thereby creating opportunities to expand their cost-reduction strategies on a global scale.”261
Multinational corporations are taking advantage of these favorable developments in international and national regulatory frameworks to strengthen their market power:
- market manipulation (and in particular price manipulation) to discourage or prevent new companies from entering the market: this is the case, for example, with Amazon, whose dominance over e-commerce infrastructure (marketing platform, delivery logistics, payment service) allows it to favor its own products262 ;
- strategic use of intellectual property provisions (see the section below);
- the acquisition of small, innovative companies to gain control of their innovations or eliminate a potential competitor (there are many examples in the digital and medical research sectors);
- public-sector predation263 in the context of public procurement or large-scale privatizations (which have often served to consolidate the positions of already dominant players or to create private monopolies264).
Focus on the anti-competitive use of intellectual property rights (IPR)
Adopted in 1995, the Agreement on Trade-Related Aspects of Intellectual Property Rights (TRIPS) establishes minimum standards for the protection of intellectual property that each WTO member state must guarantee to the others.
Six years later, the Doha Declaration marked a growing awareness of the dangers of overly strict intellectual property protection regimes. The signatories agreed that the TRIPS Agreement“should not prevent Members from taking measures to protect public health” and reaffirmed the rights of countries to use the flexibilities provided for in the agreement for this purpose265.
Definition – Intellectual Property Rights (IPR)
IP rights are granted to a person (whether an individual or a legal entity) to protect their intellectual creation by giving them an exclusive right to use that creation for a certain period of time. They fall into two broad categories:
- copyrights for literary and artistic works, and more recently, digital works (software, databases, etc.);
- industrial property rights for innovations (in particular, inventions protected by patents, as well as industrial designs and trade secrets) and for distinctive signs (trademarks, logos, and geographical indications).
Intellectual property rights (IPR) on innovations are justified by the desire to “protect the results of investments made in the development of new technologies, in order to encourage research and development activities in this field and to provide the means to finance them.”266 However, this protection may come at the expense of broader public interests and be exploited as a tool for maintaining a dominant position and generating economic rents.
Despite the Doha Declaration, the IPR regime has only grown stronger. Most of the free trade agreements concluded in recent decades contain IP protection provisions that are stricter than those of the TRIPS Agreement: extension of obligations (such as extending patent terms beyond 20 years), restrictions on the use of flexibilities, and the introduction of new measures267. Added to this is a trend toward expanding IPRs into new areas (patents on life forms, financial and commercial methods, etc.)
While discussions on international trade focus on reducing tariff and non-tariff barriers to trade268, in reality, the increased IP protection advocated by multinational corporations raises intangible barriers to competition.
Indeed, many practices of large companies demonstrate just how much the intellectual property rights (IPR) system serves as a tool to increase their market power269. One example is “patent thickets270” or the filing of “blocking patents271.” By safeguarding their technological leadership, these practices allow multinational corporations to reap profits from innovations without having to worry about competition.
Not only are most patents useless, but they do nothing to protect genuine innovations. Rather, they are part of an arms race.
Transnational corporations are pitting regions against one another
While the growth of multinational corporations may initially have been driven by a desire to secure supply chains or to produce as close as possible to markets, hyper-globalisation is changing the game.
As noted earlier, the opening of goods and capital markets, advances in transportation and digital technology, and the growing importance of intangible assets in the economy have given multinational corporations the means to fragment global value chains to an extreme degree273.
This allows them to locate their operations and profits in jurisdictions where it is most advantageous, and to minimize (or even eliminate) operational and legal risks by using subcontractors.
Ultimately, TNCs are indeed “mobile actors.”274 Increasingly disconnected from the regions in which they operate, they reap significant benefits from globalisation without bearing the human and environmental consequences of their activities.
Setting up business where it is most favourable: pitting governments and workers against each other
Multinational corporations divide their operations into smaller segments (related to design, production, and marketing) in order to locate them where it is most advantageous. The primary objective is no longer so much to produce within a particular territory or to secure a supply chain, but rather to take advantage of differences between countries. They therefore choose their locations based on various factors: commercial or industrial interests, political and regulatory stability, the cost of labor and energy, the level of social security contributions and taxes, potential government subsidies, the quality of infrastructure, the strictness and enforcement of standards, and so on.
Furthermore, the extremely complex legal structure of multinational corporations (MNCs), as well as the location of their intangible assets, is driven far more by trade-offs between jurisdictions (particularly in terms of regulation and taxation) than by operational objectives related to production (see box below).
Multinational corporations have extremely complex legal structures
Multinational corporations are organized as networks of entities owned directly or indirectly by the parent company through equity holdings. Each subsidiary is an independent economic entity subject to the laws of the country where it is located.
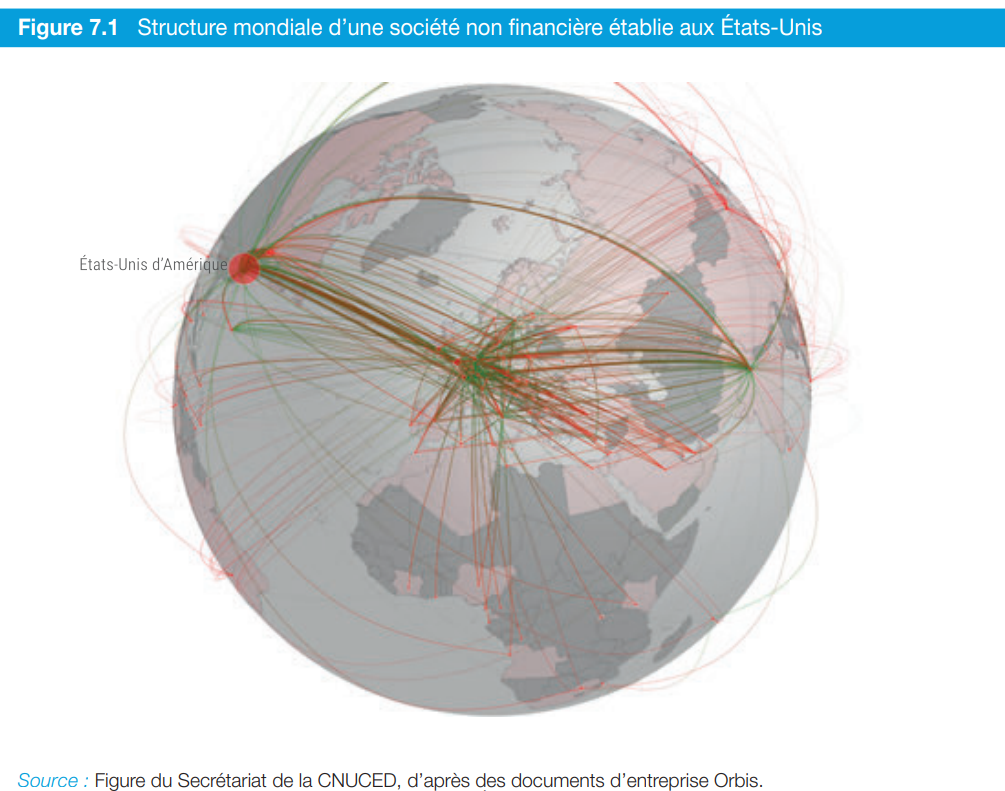
Source: Chapter VII of the Trade and Development Report 2022, UNCTAD; see also Richard Phillips, Hannah Petersen, and Ronen Palan, “Group Subsidiaries, Tax Minimization, and Offshore Financial Centers: Mapping Organizational Structures to Establish the ‘Inbetweener’ Advantage,” Journal of International Business Policy, 2021.
The parent company may invest either directly in a foreign subsidiary or indirectly, by channeling the investment through one (or more) subsidiaries located in one (or more) third countries. More complex still, indirect investment allows the company to choose the rules applicable to the investment. For example, the parent company can take advantage of a favorable regional trade agreement to establish an intermediary in the most favorable jurisdiction under that agreement.
The ability of multinational corporations to relocate their operations (and to move their intangible assets almost at will) allows them to pit governments against one another, leading to a race to the bottom in tax, social, and environmental standards. The steady decline in corporate tax rates around the world since the 1980s is a good example of this.
Multinational corporations are able to influence the formulation of economic policies. Because of their economic and financial clout, the number of jobs they provide, and their ability to fund lobbyists, they often play a dominant role in employer organizations, where they exert significant influence over the organizations’ demands. This can result in legislative or regulatory changes that benefit multinational corporations but not necessarily the affected regions, whether in terms of employment, infrastructure, public services, or, of course, the environment.
Mid-sized companies, small and medium-sized enterprises (SMEs), and very small businesses have far fewer human and financial resources to advocate for their interests. They are more dependent on local communities and more vulnerable to sanctions they might face from government agencies or policymakers.
Finally, when they have plans to set up operations, multinational companies can pit different regions against one another. Recognizing these projects as potential sources of jobs and economic revitalization, national and local elected officials are often willing to go to great lengths to attract businesses. The range of incentives is vast. Nearly 2,300 public programs benefit businesses in France275 in the form of grants, financial guarantees, equity investments, and tax and social security exemptions—all of which are available at every stage of a company’s life cycle: startup and acquisition, growth, and times of financial difficulty.
Minimising risks and avoiding responsibility
The globalisation of companies and the fragmentation of value chains allow multinational corporations to outsource activities that generate the least added value or involve the most risk.
By outsourcing entire segments of their operations to suppliers and subcontractors, they replace ownership ties with contractual ties. They reduce their fixed costs and capital expenditures and shift the costs and risks associated with fluctuations in their order backlog onto others.
In the pharmaceutical industry, for example, multinational companies are increasingly outsourcing research and its risks, which does not prevent them from reaping the benefits of its successes. This is the case with Pfizer, which is a co-owner of the patents developed by BioNTech, a startup founded by Ugur Sahin and Ozlem Türecci, the inventors of the mRNA vaccine, which received funding from the German government (375 million euros) and the European Commission (100 million euros276). Without having borne the risks associated with the research, the company will benefit from an extraordinary windfall277 for 20 years.
Outsourcing some production-related tasks also helps reduce costs by fostering competition among suppliers without having to deal with the challenges and risks associated with managing employees. Apple had 164,000 employees in 2024 (with revenue of $391 billion, or more than 2 million euros per employee, which is considerable). Since iPhones are manufactured by the massive Taiwanese company Foxconn (1.2 million employees), Apple is not legally liable for the social and environmental issues related to their production. NVIDIA, the giant in GPU chips used for generative AI, surpassed a market capitalization of $4,000 billion in 2025, with estimated revenue of $125 billion and only 36,000 employees.278
The problems arising from the contradiction between the power that transnational corporations (TNCs) wield over their supply chains—particularly by demanding low prices—and their lack of legal accountability for their suppliers’ working conditions or environmental impacts have been highlighted by numerous scandals. The collapse of the Rana Plaza building in Bangladesh in April 2013, which left more than 1,100 dead and twice as many injured279 is one of the most iconic examples, as it led to progress in the area of multinational corporate accountability (see box). The building housed several garment factories, employing a total of about 5,000 people who worked for various international clothing brands.
The saga of the duty of care
The duty of care aims to strengthen the responsibility of contracting companies regarding social and environmental risks associated with the activities of businesses operating throughout their value chain. It has been the subject of several laws and proposed legislation around the world.
In France, the 2017 Duty of Care Act requires parent companies280 to publish a “due diligence plan” to identify and prevent“serious violations of human rights and fundamental freedoms, the health and safety of individuals, and the environment” resulting from their activities, as well as those of their subsidiaries, subcontractors, and suppliers.
Even though the requirement is limited to the publication of a vigilance plan, this provides a pathway for victims to seek legal recourse in the event of an accident.
In April 2024,the European Union also adopted a directive (known as CS3D) on the European duty of care. The text, which was initially quite ambitious, was scaled back in 2025 and 2026. This development is part of a powerful trend toward environmental deregulation, under the guise of “simplification,” which followed the renewal of the European Parliament in 2024 and the appointment of the second von der Leyen Commission. The implementation timeline has been pushed back to 2029 (instead of 2027), and the scope of application—which was initially quite broad—now applies only to very large companies281. In the event of noncompliance, companies will be liable before national courts (rather than European ones). The requirement for companies to adopt and implement a transition plan for climate change mitigation has been removed. The extraterritorial scope of the directive—the fact that it applies to non-European companies operating in Europe—which was one of its most significant advances, has been retained.
Finally, it should be noted that the absence of legal liability is not limited to the chain of subcontractors but also applies within multinational corporations themselves. This is due to the principle of limited shareholder liability282, parent companies cannot be held financially liable for the activities of their subsidiaries283 even when they own 100% of their capital.
Thus, despite the scale of the 1984 Bhopal disaster and its human toll, Union Carbide faced only a minor financial penalty. Its CEO, Warren Anderson, was never held accountable. Dow Chemical, which acquired Union Carbide for $11 billion in 2001, has consistently refused to accept any responsibility in this matter. Among many examples worldwide, we can also cite Shell’s oil operations in Niger or Chevron’s operations in the Amazon region of Ecuador284.
Find out more
- Multinational Corporations: A History of the Contemporary World, edited by Olivier Petitjean and Ivan du Roy, La Découverte, 2025
- Multinational corporations have excessive power, in the module “Corporations in the Anthropocene era” in The Other Economy
- Guillaume Vuillemey, “Should Shareholder Liability Always Be Limited?”, Opinions & Debates No. 19, Louis Bachelier Institute, 2020
- Multinational Corporations, Development, and Corporate Arbitration, Chapter VII of UNCTAD’s Trade and Development Report 2022
- Market Power and Inequality: The Revenge of the Rentiers, Chapter VI of UNCTAD’s 2017 Trade and Development Report
International trade is useful but cannot be an end in and of itself
The growth of international trade in goods and services is consistently presented as a primary and legitimate goal of public policy. However, while trade is beneficial, it is important to remember that it must serve the public interest.
What is the purpose of trade?
From the perspective of a given country, international trade serves two purposes.
Procuring goods and services needed (or wanted) by the population
There are two possible scenarios.
- Either these goods and services are not available in the country—or are in short supply. This is the case with raw materials. For example, France has no oil or natural gas and lacks many metals and minerals, as well as certain agricultural products (such as coffee, chocolate, and exotic fruits). This is also true of certain manufactured goods that have never been produced—or have been produced only on a limited scale—in the country. France, and Europe more broadly, play a very limited role, for example, in the manufacture of digital goods (computers, smartphones, semiconductors, etc.).
- Either they are “produced more cheaply285” elsewhere; this is how China became the “world’s factory” by producing goods in almost every sector that are cheaper than those made in the West.
Finding markets for domestic productions
Companies may seek to expand their sales beyond their home country. This is particularly true in sectors where economies of scale286 are significant: the domestic market of a single country—unless it is as vast as China, the United States, Russia, India, or Brazil—cannot absorb the production volumes needed to recoup the investment.
This first step (selling abroad) leads to a second one (manufacturing abroad). This is how multinational corporations establish production capacity (or services) in third countries to sell their products directly on the market of that country. This approach by multinational corporations is not necessarily aligned with the interests and international trade policies of their home countries.
With the Industrial Revolution, Western economies shifted from a supply-driven economy to a “demand-driven economy.”
Until then, in fact, production was barely enough to feed a largely agricultural population (the last famine in Europe occurred in the late 19th century). Imported goods were primarily intended for a tiny minority (aristocrats and the upper middle class). Exports outside Europe during the Middle Ages consisted mainly of textiles. The goods traded within Europe were more varied287.
Starting in the 19th century, a new issue arose with the increasing frequency of overproduction crises caused by the power of machines288. Industrialists were faced with problems finding markets289. This gave rise to marketing290 (at the end of the 19th century) and the development of advertising, which gradually shifted from the goal of informing (raising awareness of products) to that of persuading (encouraging people to buy products).
This need to find markets for mass-produced goods was a key driver of international trade beginning in the 19th century, as well as of the conflicts that resulted from it (due to competition among actors and countries for those markets).
European colonization also gave Europeans access to resources that gradually became critical. India, for example, which had been under British rule since the early 17th century, supplied them with various products291. Rubber was imported from Southeast Asia (Indonesia and Malaysia) and Africa beginning in the late 19th century, with the emergence and subsequent development of the automotive industry. Spices and food products were imported from the tropics : coffee, sugar, cocoa, and tea. And precious and strategic metals such as gold (South America, South Africa), silver (South America), and tin (Malaysia, Indonesia, Bolivia).
This also gives rise to new economic strategies that intertwine economic and trade issues with issues of power. International trade is becoming a component of globalisation, in which national economies no longer operate solely on the basis of meeting needs.
Source: It was François Perroux who, in his book Economy and Society (PUF, 1960), introduced the distinction between a supply-oriented society and a consumption-oriented society.
Balancing imports and exports?
At the macroeconomic level, one might think that, in principle, a country cannot sustainably import more goods and services than it exports, but this is not always true. The balance of payments292, a key component of national accounts, is specifically designed to show how the current account deficit293 can be financed. This can be done through:
- capital income (from foreign investments),
- foreign investment within its territory,
- the indebtedness of various economic actors (though this is not an option available to all countries, and is not sustainable, with few exceptions).
The United States, whose trade deficit—which has been growing for 30 years—reached $100 billion in 2024, is a special case. The dollar’s special status since World War II shields the U.S. from any risk of payment refusal by exporters to the U.S. To better understand the link between currency and trade, see Essential 4.
Trade cannot be an end in itself
Trade thus makes it possible to pool production and sales among different countries, whether to acquire products that are not available domestically or to sell surplus goods in foreign markets.
The challenge, as is almost always the case in economics, is to keep the indicator at an acceptable level.
Avoiding dependence on strategic products
The COVID pandemic and the invasion of Ukraine have clearly highlighted some of Europe’s dependencies. EU citizens thus discovered that surgical masks and even common medications like acetaminophen were manufactured in China or India, which led to shortages during the first months of the health crisis. The invasion of Ukraine has highlighted the risks of relying on undemocratic countries for energy: the European Union imports more than 70% of the energy it consumes. We can also cite numerous other critical raw materials, such as rare earth elements, which are used in green transition technologies (particularly batteries), the digital industry, and even weapons. The value chain for these metals is entirely dominated by China, making them a strategic weapon in international power dynamics294.
Fighting environmental and social dumping
Presented as inherently beneficial, international trade is often a tool aimed at increasing the power of private actors. In particular, the recurring discourse in France and Europe about the need for the European economic area to be conducive to corporate competitiveness (by limiting social and environmental constraints) primarily reflects the interests of multinational corporations. Admittedly, these companies do create jobs, but that is not their primary concern, and their ties to local communities are weak. By pitting states or regions against one another, these companies evade their social and environmental responsibilities.
Looking at the economic cycle as a whole
Buying cheaper products is certainly beneficial to consumers, but not to producers and their employees. If consumers prefer to buy a toy“made in China,” they are creating jobs (and transferring foreign currency) in China. The widespread adoption of this behavior is problematic: domestic production—and the jobs it creates—will decline, unemployment will rise, and the savings consumers realize on their purchases will be partially offset by increases in taxes and fees and/or the loss of public services.
Find out more
- François Perroux, Economy and Society: Coercion, Exchange, Gift-Giving , PUF, 1960. See the review by Guy Dupuigrenet-Desroussilles in the Annales in 1962.
- François Crouzet, Trade and Empire: The British Experience with Free Trade Leading Up to World War I, Annales: Economies, Societies, Civilizations , 1964.
- On The Other Economy: the Markets, prices, and economic competition module and our articles Energy Dependence and Geopolitical Risks and Putting an end to ‘Say’s Law’, or the ‘Law of Markets’.
Preconceived notions
Free trade as an antidote to war and a guarantee of prosperity
Ever since Montesquieu, the notion of trade as a factor in peace has taken root in the collective imagination. In The Spirit of the Laws (1748), the philosopher wrote that“the natural effect of commerce is to promote peace,” suggesting that economic interdependence among societies could limit armed conflicts. A century later, Kant formulated the idea of“perpetual peace295,” based in part on trade between states.
This myth has become a contemporary dogma: international institutions such as the World Trade Organization (WTO), the International Monetary Fund (IMF), and the World Bank argue that trade liberalization simultaneously promotes international stability and economic prosperity. Governments in developed countries, including those within the European Union (a champion of free trade agreements), echo this narrative. The media amplifies it by linking globalisation with progress.
With Donald Trump’s second term and his aggressive pursuit of a trade war in the unilateral interest of his country, this narrative has gained even more traction. More and more analysts and commentators are contrasting the liberal, open world that previously prevailed with today’s world of economic warfare and imperialism. Here, we will examine just how misleading this view is. Periods of intense trade have coexisted with war, and globalisation has certainly not eliminated the violence inherent in economic power struggles, even if it has been less visible.
The ‘gentle trade’ myth
Trade as a driver of peace and prosperity
Trade has long been portrayed as a natural mechanism for peacemaking. Montesquieu and Kant saw economic exchange as a means of curbing violence by linking fortunes and making war costly. In the 19th century, British liberal doctrine reinforced this idea: imports and exports would create such interdependence that no state would have an interest in breaking the peace.
The European Union was built on the idea that economic integration among historically rival countries—led by France and Germany—would make war “economically senseless.” This is what Robert Schuman stated in 1950 in his speech proposing the creation of a European Coal and Steel Community (ECSC): “The solidarity in production thus established will make it plain that any war between France and Germany becomes not merely unthinkable, but materially impossible.”
While it is true that peace has reigned among these countries for 80 years, that in no way proves the general validity of the statement…
This vision is also central to the work of international institutions, as the WTO makes very clear in its 2023 World Trade Report.
This year’s World Trade Report examines the benefits of integration into world trade as well as the risks of fragmentation. It shows that trade has proved to be a source of security and peace, a driver of poverty reduction, and a critical tool for addressing climate change.
The theoretical justification: war would entail too high a cost to the economy
Ever since Ricardo first articulated the theory of comparative advantage in 1817, economists have put forward numerous arguments to justify the economic superiority of free trade over other forms of trade organization. As we explain in the Preconceived Idea 5, these arguments are highly debatable. Here, we focus on the argument that trade prevents war by making its cost too high.
In his plea Toward Perpetual Peace (1795), Immanuel Kant puts forward the same argument as Montesquieu. According to him, nations would benefit from maintaining economic exchanges, since war would interrupt the profits that result from them: “Civilized nations, when they engage in trade with one another, cannot fail to maintain peace.”296” The central idea is that economic interdependence encourages the peaceful resolution of conflicts. However, Kant emphasizes that trade alone is not enough to guarantee peace: it can play this role only within the framework of stable republican institutions and a federation of free states.
A modern argument extends Kantian logic: the more a country is integrated into global markets and the larger its middle class—which consumes imported goods—the more costly war becomes. Several studies297 attempt to show that trade and economic interdependence—especially when combined with a democratic system—can reduce the likelihood of conflict by increasing the economic and political costs of war.
However, as we will see in the next section, history shows that this effect is neither automatic nor universal. Trade can create incentives for caution, but it is not enough to prevent conflicts when other strategic or political considerations prevail. This is especially true in a context of widespread trade liberalization: while bilateral trade increases the opportunity cost of a conflict and thus reduces the risks, this is much less the case with multilateral trade. If a conflict arises with a trading partner, having many other trading partners can help offset the losses resulting from the conflict.
The empirical evidence: historical counter-examples
Commercial ties have not prevented major conflicts
History is full of examples showing that economic integration does not necessarily lead to peace.
Before the 1870–1871 war, which pitted France against Prussia and led to the fall of the Second French Empire and German unification, the two powers maintained significant economic ties. In 1862, following the free-trade treaty between France and England, France signed a trade agreement with Prussia and the German states of the Zollverein 298 that reduced tariff barriers and promoted industrial and agricultural trade between the two countries. The official goal was to stimulate trade, increase mutual prosperity, and, implicitly, contribute to political stability by making war less “rational” from an economic standpoint.
Despite this treaty and growing economic interdependence, political and diplomatic tensions led to war. Trade was not enough to prevent military mobilization.
The same pattern repeated itself a few decades later. On the eve of World War I, the major European powers were closely linked economically. But that did not prevent the outbreak of the conflict. Some historians have even argued for the opposite view299, arguing that the conflict stemmed from the struggle for economic dominance… The reality is likely more complex, but the fact remains that trade integration did not prevent the war, contrary to the “peace through trade” theory.
The drive to liberalise trade has at times fuelled violent conflicts
The following examples illustrate a reality that is often overlooked: when free trade is asymmetrical, it can be imposed by force and serve as a tool of imperial domination. Trade liberalization has at times been enforced “by gunboat,” leaving no doubt as to its purpose.
The Opium Wars (1839–1842 and 1856–1860)
The conflicts between England and China are one of the most emblematic examples of this. Far from promoting peace, trade was the direct cause of war in this case, revealing that international trade is not neutral but deeply intertwined with political and military power dynamics.
In the early 19th century, Qing China strictly limited trade with Westerners, permitting it mainly in the port of Canton. The British imported large quantities of tea, silk, and porcelain, which resulted in a significant trade deficit for the British East India Company. To rebalance their trade, they expanded the sale of opium produced in India and smuggled into China, despite its prohibition. Faced with the social and economic devastation caused by this drug, the Chinese empire attempted to crack down on this trade. In response to these trade restrictions, the United Kingdom chose the military route to defend its economic interests and maintain an extremely lucrative trade.
The First Opium War (1839–1842) concluded with the Treaty of Nanking (1842), which forced China to open its ports, the cession of Hong Kong, and the establishment of customs duties favorable to the Western powers. The Second Opium War (1856–1860) further intensified this pattern of coercion, expanding trade privileges and reinforcing foreign interference. These were full-scale wars, involving military operations, the bombardment of cities, and significant human casualties (numbering in the tens of thousands of deaths), mainly on the Chinese side. In China, they exacerbated opium addiction, disrupted economic and social life, and permanently weakened the Chinese state.
Colonisation and the forced opening of African economies to international trade
Through colonization, the European powers integrated (through widespread massacres, the seizure of land and resources, slavery, and cultural plunder300) vast regions of the African continent into global trade networks. They imposed asymmetrical trade relations: the export of raw materials and the import of European manufactured goods. This forced specialization gradually destroyed local agricultural, artisanal, and industrial activities—particularly in the textile and metallurgy sectors—depriving many regions of their economic autonomy.
This economic disarray was accompanied by social tensions, armed resistance, and internal conflicts301, often exacerbated by the colonial administrations themselves. Far from producing the promised prosperity and stability, this imposed trade liberalization contributed to a lasting weakening of local economic and political structures, creating dependent and vulnerable economies.
The impact of open borders on food self-sufficiency in the Global South
In West Africa, particularly in Senegal and the surrounding regions, the integration of peanuts into the global trade at the end of the 19th century serves as a telling example302. Colonial authorities encouraged—and at times imposed—agricultural specialization at the expense of local food crops in order to meet the needs of European industry. This rapid transformation of agricultural structures made local economies extremely dependent on fluctuations in world prices. When peanut prices plummeted in the 1880s, the consequences were immediate: impoverishment of the population, food insecurity, forced migration, and heightened social tensions. This commercial dependence permanently weakened local societies and fueled resistance to the colonial order. Here again, international trade—far from bringing stability and prosperity—was a factor in economic vulnerability and deep social imbalances.
A century later, many developing countries were forced to open their borders, particularly under the Washington Consensus303 which guided the IMF’s interventions beginning in the 1980s. The results of these interventions are debated within the economic community. One of the fundamental challenges in assessing them is that proponents of the neoliberal vision advocating this consensus often contrast it with a highly interventionist public policy that is economically nationalist and lacks control over public spending304. Consequently, comparisons are skewed because they fail to take into account the “third way”—a middle ground—that selective liberalization would represent.
The consequences for a number of countries in terms of food self-sufficiency are well documented: the destruction of local food systems in the face of subsidized agricultural products from developed economies, a shift toward export crops (cocoa, coffee, flowers, cotton, etc.) at the expense of food security, increased dependence on foreign markets, the impoverishment of small farmers, and rural exodus to cities or abroad.
This was the case, for example, with Ghana’s poultry sector, which was once able to meet a large portion of local demand but suffered a marked decline in the early 2000s, when imports of low-cost poultry rapidly surpassed domestic production. This situation was exacerbated by trade liberalization, which exposed local producers to unfavorable competition from imported products that were up to 30–40 percent cheaper. According to a study on the Ghanaian poultry industry305, one of the main obstacles to the growth of local production is precisely “the Ghanaian government’s failure to protect the nascent industry, leading to unfair competition from cheap imported products.”
This was also the case in Haiti, which, under pressure from the IMF, reduced its tariffs on rice from 150% to 50% in the early 1990s, and then to 3% in 1995. This liberalization led to the Haitian market being flooded with subsidized rice from the United States, causing local production to collapse306 and bringing an end to the country’s self-sufficiency in rice307.
Even in countries promoting free trade, globalisation has taken its toll
As we explain in the Essential 8, globalisation has created winners and losers, even in developed countries, which are strong advocates of free trade.
The past 30 years in Europe and the United States have been marked by accelerated deindustrialization. Rapid trade liberalization, combined with the integration of new economies with low production costs into the global marketplace—including, of course, China first and foremost—has led to the relocation of entire industrial sectors (textiles, athletic shoes, toys, electronic components, etc.). While this trend has led to lower prices for consumers and an overall increase in trade, it has also caused massive industrial job losses, weakened the middle class, and created a lasting sense of social decline in many regions.
These economic imbalances have fueled internal social tensions, increased distrust of institutions, and, ultimately, visible political instability. In both the United States and Europe, several studies308 show that the regions most exposed to international competition have been particularly susceptible to the rise of populism and the far right. Free trade, far from automatically producing prosperity and stability, has thus contributed to deep internal divisions, which manifest as enduring political tensions and a weakening of social cohesion—factors that may ultimately influence international relations themselves.
The Triumph of Free Trade and Persistent Power Dynamics
Since the early 2020s, there has been a growing number of arguments pitting, on the one hand, a rules-based liberal international order against, on the other, the resurgence of global geopolitical tensions and economic warfare.
That’s a bit too quick to forget that the current tensions didn’t arise out of nowhere. Since free trade aims to eliminate barriers to trade, it effectively fosters “free” competition among all parties. In this way, it favors the most powerful players, since not all countries and companies enter the competition with the same advantages and strengths. Furthermore, the mere existence of rules in no way guarantees that they are fair—nor that they will be respected, as demonstrated by the Trump administration’s numerous breaches of international trade rules, not to mention the countless violations of international law throughout history. These rules are the result of the balance of power at the time of their adoption and reflect, at least in part, the interests of the dominant players—namely, the most powerful nations and multinational corporations.
Far from being the epitome of economic and social cooperation, free trade can be based on domination and become a factor in economic warfare and geopolitical and social tensions, as we have seen above.
This is what Canadian Prime Minister Mark Carney said in his speech at the Davos Forum in January 2026, where he challenged the naïve (or cynical) vision of a peaceful liberal order and highlighted the rude awakening experienced by some of those who had benefited from it until then.
For decades, countries like Canada prospered under what we called the rules-based international order. We joined its institutions, we praised its principles, we benefited from its predictability. And because of that, we could pursue values-based foreign policies under its protection.
We knew the story of the international rules-based order was partially false that the strongest would exempt themselves when convenient, that trade rules were enforced asymmetrically. And we knew that international law applied with varying rigour depending on the identity of the accused or the victim.
New forms of economic domination
While global trade has grown considerably over the past few decades, it has by no means eliminated the power dynamics between states and with multinational corporations. On the contrary, it has reshaped them, giving rise to new forms of asymmetry and dependency. Far from being a space for equal exchange, contemporary international trade remains structured by enduring economic hierarchies.
An uneven distribution of value added
Some regions of the world specialize in low-value-added sectors—raw material extraction, export-oriented agriculture, and industrial assembly—while others focus on the most strategic stages: design, technological innovation, finance, logistics, and marketing.
As explained in Preconceived Idea 3, exports of natural resources (minimally processed or unprocessed) accounted for between half and three-quarters of the value of exports from developing economies during the period 1995–2024. In Africa, many economies remain heavily dependent on the export of raw materials or fossil fuels (minerals, cocoa, coffee, oil, and gas), a direct legacy of colonization. This dependence exposes these countries to volatility in global prices and limits their ability to move up the industrial value chain309.
Emerging countries such as Vietnam and Cambodia (electronics and textiles), Mexico (with“maquiladora” factories for the U.S. market), India (for the production of generic pharmaceuticals or electronic components, with limited local value added), Bangladesh and Ethiopia (in the textile sector) have become assembly hubs for manufactured goods destined for Western markets, capturing only a very small share of the products’ final value.
Conversely, developed countries retain control over technologies, brands, and distribution networks, reaping the lion’s share of the profits. It should also be noted that, as explained in Essential 9, within developed countries, globalisation has largely benefited multinational corporations and their shareholders. Current events regularly provide examples showing just how powerful these actors have become—to the point of pitting governments against one another (in fiscal, social, and environmental terms) and even imposing their agendas on governments (particularly in less wealthy countries).
Economic interdependence as a means of exerting pressure
Over the past two decades, a series of crises in finance, health, energy and geopolitics have laid bare the risks of extreme global integration. But more recently, great powers have begun using economic integration as weapons, tariffs as leverage, financial infrastructure as coercion, supply chains as vulnerabilities to be exploited.
You cannot live within the lie of mutual benefit through integration, when integration becomes the source of your subordination.
As Mark Carney explains very clearly, international economic integration can lead to dependence and be used as a means of exerting pressure on other nations.
In an article published in 2025310, researchers Henry Farrell and Abraham Newman examine how global economic networks (financial, logistical, technological) can be weaponized. They refer to this as “weaponized interdependence.” They explain how a state that controls a “strategic hub”—that is, a key node or point in a critical network—can exert pressure on actors who need to pass through that hub. This is what the United States does through its dominance in payment systems (SWIFT in particular), major digital platforms, and, more recently, semiconductors. On China’s part, this dominance is expressed through control of the value chain for strategic metals, particularly rare earths. The use of power and economic integration to exert pressure on other nations is nothing new, as evidenced by the extraterritorial nature of U.S. regulations311. The main new development lies in the fact that this pressure is being asserted officially and used on a widespread basis, as the Trump administration is doing.
Thus, far from promoting balanced development, free trade tends to lock certain economies into subordinate roles, while reinforcing the dominant position of industrial and financial powers. As we explain in Preconceived Idea 2, on protectionism, the Asian countries—led by China—that have succeeded in capitalizing on globalisation have done so without playing by the rules of free trade.
Free trade is therefore not neutral: it reproduces and transforms relationships of economic domination. It favors certain powers, keeps others in subordinate positions, and creates new vulnerabilities, particularly with regard to employment, industrial sovereignty, and social stability.
Free trade is not neutral: it serves geopolitical interests
The dominant narrative of the current era equates globalization with the growing reach (and porosity) of markets and an accelerating pace of technological change. It employs the language of “free trade” to promote the idea of a harmonious (win-win) world governed through clear rules and greater competition. But hyperglobalization has as much to do with profits and mobile capital as with prices and mobile phones and it is governed by large firms that have established increasingly dominant market positions.
Contrary to liberal rhetoric, which portrays the market as an autonomous and neutral mechanism, trade is never a purely economic process. It is always shaped, guided, and sometimes exploited by political and geopolitical strategies. Moreover, the call for free trade is very often hypocritical or even deceptive. It can coexist with protectionist measures, or apply only when such openness serves the interests of those who promote it.
A good example of this is the promotion of free trade by multinational corporations on the grounds that it would help achieve a“level playing field.”
Free trade does not lead to a “level playing field”
Free trade is often presented as the means to achieve a “level playing field,” that is, an environment in which all companies in a given market would be subject to exactly the same rules worldwide and would thus have the same ability to compete. This recurring demand by multinational corporations is said to foster “free and undistorted” competition—that is, competition without distortion—and thereby ensure maximum economic efficiency.
This ideal vision of free trade appears, at best, to be wishful thinking; at worst, an intellectual fraud. Seeking to standardize norms and regulations across the globe amounts to asserting that peoples have no right to preserve their cultural differences; it overlooks the fact that differing national circumstances are the result of history, which has created significant disparities between countries—for example, in terms of infrastructure, education, and development capacity. The European Union provides a striking example in this regard. It has established a largely effective free movement of goods and capital, while the mobility of workers and, above all, services remains limited and subject to numerous national regulations. However, the lack of fiscal, social, and environmental harmonization prevents the Union from being a truly level playing field.
Finally, it should be noted that multinational corporations themselves promote rules that protect their market power, particularly in the technology sector through intellectual property rights.
In reality, the major economic powers practice selective free trade. They advocate it when it works in their favor, but resort to protectionism as soon as their strategic interests are threatened. Industrial policies, government subsidies, technical or environmental standards, and export controls: these are all political tools hidden behind market rhetoric. The trade war between the United States and China, marked by tariff hikes and restrictions on sensitive technologies, clearly illustrates this instrumentalization of trade.
In Africa, this political dimension of trade is also evident. The trade agreements concluded between the European Union and several African countries (the EPAs, or Economic Partnership Agreements) have often been criticized312 for their asymmetry: the rapid opening of African markets to subsidized European products313, the weakening of local agriculture, and the restriction of industrial flexibility. Trade thus becomes a tool for exerting influence, rather than a simple, mutually beneficial exchange.
These examples show that the market is not a neutral arbiter. Trade liberalization can go hand in hand with economic sanctions, strategic dependencies, or imposed standards. Contemporary economic conflicts thus reveal that trade is not an antidote to war, but can become yet another battlefield where political and strategic power dynamics play out.
Highlighting this hypocrisy does not mean advocating for defensive protectionism or defending “pure” free trade divorced from power struggles—a separation that does not exist in reality. Rather, it is a call for a more lucid, realistic, and equitable conception of international trade, situated between inward-looking protectionism and aggressive free trade.
Thinking About Trade from a Global Perspective
The critique of the dogma of free trade presented here does not lead to a rejection of international trade, but rather to an abandonment of the idealistic narrative that portrays it as a vehicle for peace and prosperity—a narrative that stands in contrast to a practice that actually pursues other, less noble goals.
It is indeed clear that prosperity cannot automatically result from (or be dictated solely by) the “laws” of the global market; it also depends on environmental, social, educational, and industrial policies tailored to local contexts. Viewing trade as one tool among many—rather than as a universal guarantee of peace—is a necessary condition for sustainable and equitable globalisation.
Protectionism is said to be detrimental to economic development
Protectionism gets a bad rap among most economists, who favor free trade. Seen as synonymous with economic inefficiency, it is also believed to be a source of conflict and could even lead to chaos.
The philosophy of protectionism is a philosophy of war.
Trump’s second term, marked by trade wars and geopolitical aggression, seems to bear out this assertion. As we saw in Preconceived Idea 1, free trade is not necessarily a factor in peace. We will therefore focus here on the economic dimension.
What is protectionism?
The term “protectionism” refers to a set of measures taken by a government to protect domestic companies from foreign competition and thereby promote domestic production, preserve jobs, and reduce the trade deficit and dependence on foreign countries.
Often equated with the imposition of tariffs, protectionism actually encompasses a wide range of measures: quantitative restrictions (quotas, licenses, bans), price controls (for example, import taxes other than customs duties), controls on foreign investment, import restrictions motivated by environmental, social, or health concerns, and subsidies to domestic companies to improve their competitiveness relative to foreign firms. In addition to these “protective” measures, there are also measures aimed at promoting exports: export subsidies, or, conversely, restrictions on exports of strategic products314, controls on foreign investments (to prevent technology transfer), etc.
This diverse list, whose various measures are often grouped under the heading of tariff and nontariff trade restrictions315, warrants several comments.
- Protectionism is defined by default: any measure that hinders free trade is labeled as protectionist. As a result, on the one hand, measures with very different purposes are grouped under a single term with negative connotations, and the scope of protectionism is potentially infinite, since any national regulation can be included.
- It is, therefore, quite shocking that health and environmental measures are labeled as protectionist. This demonstrates the ideological power of the free-trade dogma and the hierarchy it establishes. According to this dogma, the virtues of free trade are supposedly more important than respect for human health and ecosystems.
- While intellectual property rights316 (patents, etc.) are listed among the non-tariff barriers to trade, they have, paradoxically, been afforded a very high level of protection, both in WTO agreements and in numerous bilateral and regional free trade agreements. Here, too, we see a hierarchy emerging in which the protection of intellectual property is placed very high on the list, as it is said to protect and thus stimulate innovation. This is highly debatable when one considers, as we saw in the section on multinational corporations, that IPRs are often used to maintain the profits of the largest players.
- VAT is not considered a protectionist measure, even though it discourages imports and encourages exports.317 This omission was highlighted in early 2025 by Donald Trump (who called on the Europeans to eliminate it).
- Nor does this list include another clearly protectionist measure: maintaining an undervalued currency, which makes imports more expensive and exports cheaper.
Monetary protectionism
For a country, currency protectionism involves keeping its currency undervalued to support the export competitiveness of its companies.
Here are some notable examples:
China has long been accused of undervaluing its currency (the renminbi) to boost its exports. Between the 1990s and the early 2010s, Beijing maintained strict control over the exchange rate318, preventing its currency from appreciating too sharply despite significant trade surpluses319. This led to tensions with the United States, which were strongly highlighted by Donald Trump during his first term 320. Today, the Chinese currency is still considered to be significantly undervalued.321
Japan was accused in the 1980s and 1990s of intervening in the foreign exchange market322 to prevent excessive appreciation of the yen, which would have harmed its exports. In August 1985, the exchange rate was approximately 240 yen to the dollar323. Economists and institutions estimated that the “equilibrium” exchange rate was actually less than 200 yen (or even less than 150) per dollar324. The Plaza Accord, signed in September 1985 by the United States, Japan, West Germany (FRG), the United Kingdom, and France, led to the yen’s revaluation: by late 1986, it stood at about 160 yen to the dollar. This revaluation had a recessionary effect in Japan. In response, the Bank of Japan sharply lowered interest rates, leading to the creation of a real estate bubble that burst in 2011. The economic policy pursued by Shinzo Abe, Prime Minister from 2012 to 2020 (“Abenomics”), was based in particular on a devaluation of the yen through highly “accommodative” monetary policies325 by the Bank of Japan.
When the euro was introduced, Germany benefited—compared to other European countries—from a euro whose value was lower than what the German mark would likely have been had it remained in circulation on its own. This situation gave the German economy a competitive advantage within the eurozone, particularly vis-à-vis the countries of Southern Europe, for which, moreover, a relatively strong euro (compared to the rest of the world) weighed on their competitiveness.
The Asian Tigers (Hong Kong, Singapore, Taiwan, and South Korea) also employed currency undervaluation strategies beginning in the 1960s and more notably in the 1970s, during their phase of rapid, export-oriented industrialization.
Criticisms and Shortcomings of Protectionism
Economic arguments against protectionism
As explained in Preconceived Idea 5, the arguments put forward by economists attempting to demonstrate the superiority of free trade are unconvincing. However, one should not conclude, conversely, that protectionism is the perfect solution.
Protectionism can prove to be doubly harmful.
This is the case when governments adopt protectionist measures under pressure from lobbies that do not want to face international competition. This leads to the “artificial” maintenance of rent-seeking situations, which are detrimental to economic efficiency. In other words, protectionism limits productivity gains326 by preventing domestic firms from competing with other firms that have lower production costs. As explained in Essential 9.2.3, intellectual property rights are often used by multinational corporations to increase their market power and preserve their rent-seeking advantages.
Furthermore, the implementation of protectionist measures can cause prices of the affected products to rise and thus contribute to inflation, which can ripple through the entire economy if the goods in question are widely used (such as energy). However, the inflationary effect is not inevitable. Higher tariffs can be offset by lower profit margins for companies throughout the value chain—whether they are exporters, importers, distributors, or logistics firms. This decline in margins, however, can also have consequences by limiting their ability to invest or reducing their cash flow.
Negative consequences of protectionism: concrete examples
From the 1950s to the 1980s, many Latin American countries adopted import-substitution policies to reduce their dependence on imported industrial goods and stimulate the development of local industries. This model, inspired by the work of structuralist economists such as the Argentine Raúl Prebisch, aimed to encourage domestic production through high tariffs, import quotas, and strict trade controls.
The goal was to allow nascent industries to develop sheltered from foreign competition, but these protectionist measures often proved to be a source of economic inefficiencies. Without competitive pressure, many domestic companies lacked sufficient incentive to innovate or improve their productivity, which resulted in high production costs and products of relatively low quality compared to those available abroad.
A notable example is the automotive industry in Argentina327. High tariffs and local content requirements were implemented to develop a domestic vehicle manufacturing sector. While the industry did grow in the 1960s and 1970s, this policy also placed a significant burden on the balance of payments328 due to the need to import parts and components, and failed to achieve a sufficient level of international competitiveness.
The negative effects of import substitution policies were not limited to the manufacturing sector. In several countries, protectionist measures were combined with domestic administrative price controls to limit their inflationary effects. The result: shortages, the rise of black markets, and a loss of confidence in the national currency—consequences that have been documented in various Latin American economies.
Despite the development of certain local industries, these efforts to support national industrialization have not eliminated dependence on imported technologies and equipment. In countries such as Brazil, intensive industrialization has been accompanied by a continuous need to import capital goods and technological inputs, which has contributed to widening trade deficits329.
To finance these policies and offset external imbalances, several countries turned to external borrowing. The rise in U.S. key interest rates in the late 1970s, led by Federal Reserve Chairman Paul Volcker, made this massive debt one of the major factors behind the Latin American debt crisis of the early 1980s, which plunged the entire region into a decade of economic stagnation and severe macroeconomic pressures.
Many economists have advocated for protectionism
From the very beginning, protectionism has been viewed as a means of asserting sovereignty
The German economist Friedrich List (1789–1846), in The National System of Political Economy (1841), criticized the universalism of British free trade and advocated a strategy of temporary protection, allowing time for nascent enterprises to develop and acquire the know-how necessary to compete with their foreign rivals. The American Henry Charles Carey (1793–1879) develops a similar argument in The Past, the Present, and the Future (1848), arguing that protectionism would promote industrialization, higher wages, and social cohesion.
Recent debates on free trade have focused primarily on the issues of deindustrialization and the loss of sovereignty—issues that were precisely at the heart of List and Carey’s arguments.
Criticism of free trade by leading 20th-century economists
John Maynard Keynes opposed free trade as early as the 1930s, noting that countries with trade deficits saw their economies weaken while surplus countries grew richer at the expense of others. He advocated for tariffs on imports from surplus countries to prevent trade imbalances330 and favored a certain degree of economic self-sufficiency for each nation331.
Economist Dani Rodrik, a recognized expert on international trade, criticizes the overly liberal view of trade. As early as 1998332, he highlighted the growing inequalities linked to globalisation as well as the economic losses suffered by certain categories of workers. He argues that governments must accompany trade liberalization with appropriate social and industrial policies.
In The Globalization Paradox, published in 2011, he elaborated on his concept of the “political trilemma of globalization”, according to which it is impossible to simultaneously reconcile democracy, national sovereignty, and globalisation. He advocated for a more moderate form of globalisation that respects national particularities. In 2017333, he criticized the dogma of free trade and advocated for a more pragmatic economic policy that combines trade openness with appropriate protections for workers and domestic businesses. He criticizes the zealots of globalisation for engaging in poor economic science and ignoring the nuances inherent in the discipline that should have inspired caution. He advocates for a pluralistic global economy in which nation-states would retain sufficient autonomy to craft their own social contracts and develop economic strategies tailored to their needs.
Paul Krugman, who was initially a strong advocate of free trade, moderated his position in the 2000s and 2010s by acknowledging that globalisation could have negative effects on workers in developed countries.
It’s no longer safe to assert that trade’s impact on the income distribution in wealthy countries is fairly minor.
In particular, he highlighted the consequences of offshoring to China and the loss of manufacturing jobs in the United States. He acknowledged that international trade can widen inequalities and requires supporting policies (redistribution, training, social protection).
Joseph Stiglitz, “Nobel Prize” in Economics335, criticizes globalisation and the inequalities it creates. In the book The Great Disillusionment (2003), he criticizes the role of the IMF and the World Bank in imposing liberalization policies on developing countries.
James Kenneth Galbraith336 emphasizes the harmful effects of free trade on employment and inequality, particularly in the United States, and advocates for more interventionist economic policies to protect workers.
Throughout history, many countries have successfully implemented protectionist measures
While we have seen previously that protectionist policies can have negative impacts on the countries that implement them, there are also many historical examples to the contrary. In his book, A Brief History of Equality (2021), Thomas Piketty notes that protectionism“played a central role not only in Europe’s rise to power, but also in virtually all successful instances of economic development throughout history”337. He cites 17th– and 18th-century England, the United States following its independence, 19th-century France and Germany, and Japan, South Korea, Taiwan, and China in the second half of the 20th century (at different times).
In the history of the European economy, protectionism has by far been the norm
It was not until the mid-19th century, with the repeal of the Corn Laws338 in 1846 in England that free trade first gained recognition, though it did not become universally accepted. It would not become the “dominant ideology” in international trade until after World War II.
Economic historian Paul Bairoch339, in his analysis of the 19th and early 20th centuries, shows that economic history is not one of constant and dominant free trade. Protectionism was the norm for many industrialized countries and was often correlated with periods of growth, while periods of trade liberalization were the exception. He emphasizes that countries that successfully industrialized in the 19th and 20th centuries (such as the United States and Germany) often did so under protectionist policies, imposing tariffs to protect their nascent industries. Conversely, countries forced into free trade (particularly colonies) saw their industrial development slowed or prevented. He also points out that Great Britain did not industrialize under free trade, but under a strongly protectionist regime, and that it adopted free trade only after it had secured its industrial supremacy. This strategy follows a logic already denounced in the 19th century by Friedrich List, cited above, according to which dominant countries promote free trade when it serves their interests, while having rejected it during their own phase of catching up.
This research has been supported by the work of other economists. For example, in his book Kicking Away the Ladder (2002)340, Ha-Joon Chang, a professor at Cambridge, shows how developed countries used protectionist policies to grow, before pressuring developing countries to open up to free trade. In the same vein, Erik Reinert, in his book How Rich Countries Got Rich… and Why Poor Countries Stay Poor (2007), argues that rich countries developed through interventionist policies, not through free trade.
Protectionism and Mercantilism
One form of protectionism is mercantilism, a dominant doctrine in Europe from the 16th to the 18th century, based on the idea that a nation’s wealth is measured by its accumulation of precious metals (particularly gold and silver), often obtained through a trade surplus.
To achieve this goal, governments adopted protectionist measures -to promote exports and to reduce imports- in order to bring more gold and silver into the country, such as:
- high tariffs on imported products to discourage the consumption of foreign goods;
- export subsidies to stimulate domestic production for foreign markets;
- restrictions on the importation of luxury goods or goods deemed nonessential;
- Support for domestic manufacturers to promote self-sufficiency.
This mercantilism is outdated: it flourished in a world dominated by a supply-driven economy, when a country’s primary concern was to procure the goods deemed essential by the ruling authorities.
The “neo-mercantilism” practiced by the Asian Tigers (from the 1960s to the 1990s) and China (beginning with the “revolution” led by Deng Xiaoping, in 1978) added exchange rate management and control over foreign investment and overseas investment to this arsenal. It represents a different approach—that of an export-oriented economy—where the primary concern is no longer supply but the need to find markets to sell surplus production.
The ideological dominance of free-trade advocates has not impeded protectionist policies
Despite the primacy of free trade that emerged in economic discourse and international trade negotiations following World War II, many Western countries have implemented protectionist policies. These policies were driven by industrial policy objectives or by the desire to protect strategic sectors vulnerable to international competition.
The U.S. Auto Market
In the 1980s, for example, the United States pursued a protectionist policy in the automotive sector to counter the influx of Japanese cars.
Market Share of Japanese Car Brands in the United States, 1968–2020
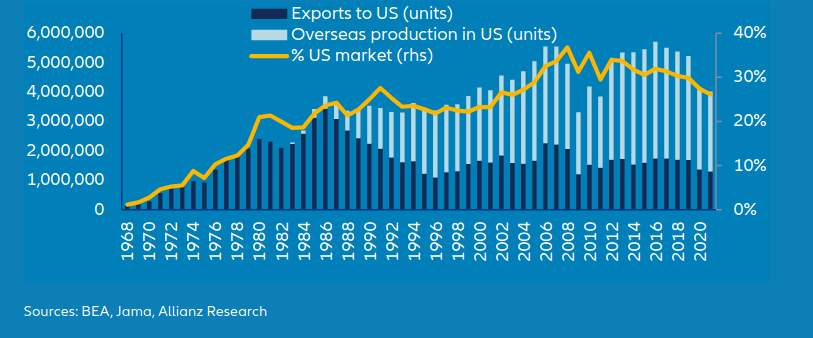
Source: The Chinese Challenge to the European Automotive Industry, Allianz Research, 2023.
Reading: In 2020, Japanese cars accounted for about 27% of the U.S. market. About two-thirds of these vehicles are manufactured in the United States, with the rest being imported.
In the wake of the oil crises and the passage of the Clean Air Act of 1970, Japanese cars—which were smaller and more fuel-efficient—became increasingly popular among American consumers. As a result, their share of U.S. new car registrations rose from 3% in the 1970s to 20% in 1980. At the same time, the number of jobs in the sector fell from 1.1 million in 1979 to 650,000 in 1982.
To counter this competition, the U.S. government implemented import quotas in 1981. Japanese automakers then opened factories to manufacture vehicles directly in the United States. They thus continued to gain market share, but production in the United States (and the associated jobs) gradually increased until it accounted for about two-thirds of sales.
Agricultural Production in Switzerland
Switzerland strongly protects its agricultural sector to sustain an industry that would obviously not be competitive due to its geography. It maintains a system of high agricultural tariffs. According to the OECD341, the average tariff rate applied to agricultural imports is significantly higher than that for non-agricultural products (28.5% in 2023 overall, with much higher tariffs on certain products such as dairy and meat). In addition, there are just under 50,000 farms spread across approximately 1 million hectares342) receive subsidies from the federal government totaling approximately 4 billion euros in 2022343.
These protectionist policies have helped sustain the domestic agricultural sector. It is now necessary for them to evolve to better address environmental challenges, as indicated in a report by the Sustainable Development Solutions Network Switzerland published in 2023344 : ” Food security is under threat. Wars, pandemics, climate change, and the loss of biodiversity are also jeopardizing Switzerland’s food supply. “
The selective and evolving protectionism that powered China’s rise
In the late 1970s, Deng Xiaoping set China on a course of profound and dramatic economic transformation345. This transformation was based on strategic and gradual protectionism, aimed at building a solid national productive capacity, which in many cases had been highly inefficient. One of the first measures taken was to create special economic zones (Shenzhen, Zhuzai, Xiamen, and Shantou) where foreign investment was permitted but strictly regulated. Foreign companies were often required to partner with local entities in the form of joint ventures, thereby promoting the transfer of technology and know-how. Access to the Chinese market was contingent on local production requirements, quotas, and domestic content obligations. Export prices were deliberately set extremely low (this dumping was, in fact, a form of protectionism). Tariff and non-tariff barriers protected emerging industries.
At the same time, the government maintained tight control over its financial system. The major banks remained state-owned, directing credit toward sectors deemed strategic: steel, energy, telecommunications, and later electronics, automotive, and digital technologies. The yuan, particularly in the 1990s and 2000s, was kept at a relatively low level relative to the dollar (see the box on monetary protectionism).
Even after China joined the World Trade Organization in 2001, Beijing retained its industrial policy tools. Government subsidies, preferential access to land and public procurement, and planning through five-year plans have enabled the emergence of major national champions. More recently, the “Made in China 2025” program illustrates this commitment to moving upmarket while reducing technological dependence on foreign countries.
Thus, China’s development did not result at all from a free-trade policy but, on the contrary, from selective and evolving protectionism. The opening up was genuine, but it was state-led, combining global integration with the methodical defense of its industrial interests.
Exposure to international competition at too rapid a pace has caused considerable social and economic damage
We will illustrate this point with several examples.
The collapse of the USSR
At the turn of the 1990s, the collapse of the USSR346 and, more broadly, the governments of Eastern European countries, sparked heated debates over how these countries should “transition” to a market economy. Proponents of an evolutionary or gradualist approach advocated a gradual loosening of state control, allowing economic actors to learn the new rules of the game. It was precisely this approach that Deng Xiaoping had adopted in China in the 1980s347. Proponents of “shock therapy,” on the other hand, advocate rapid reforms to prevent resistance and reap the supposed benefits as quickly as possible.
It is this second path that Russia has chosen, on the advice of the IMF and Western experts such as Jeffrey Sachs. The main measures of this “shock therapy”348”—price liberalization, privatization, and trade liberalization—were launched almost simultaneously starting in 1992, within a very short period of time. The consequences were disastrous349
- Effective January 2, 1992, prices were largely liberalized, thereby bringing an end to the system of administered prices. This decision triggered a surge in inflation during 1992. A policy of monetary and fiscal stabilization was then implemented, but it did not begin to yield results in terms of curbing inflation until 1994–1995.
- At the same time, the government launched a sweeping privatization program based on the distribution of vouchers to the public. Between 1992 and 1994, thousands of state-owned enterprises were transferred to the private sector. In 1995, the so-called “loans-for-shares” phase accelerated the concentration of major industrial assets in the hands of a small number of players, contributing to the emergence of the oligarchs.
- Finally, beginning in 1992, Russia rapidly opened up to international trade by significantly lowering trade barriers and gradually integrating its economy into global markets.
This “therapy,” adopted in many countries of the former USSR, was generally an economic and social disaster: it led to the disappearance of entire sectors of the economy that were unable to withstand competition, enriched oligarchs in some cases, and resulted in widespread corruption. Erik Reinert cites the case of Mongolia (a “Eastern Bloc” country that followed the same path): “In Over the 50 years leading up to the 1991 reforms, Mongolia slowly but surely built up a diversified industrial sector […]. [This sector] was virtually wiped out in just four years, between 1991 and 1995, and never recovered. “350
The reunification of the two Germanys
The reunification carried out by Chancellor Kohl in 1990 had very serious social and economic consequences in the East, particularly because of the exchange rate adopted between the two Marks351 and the rapid privatization of East German companies (more than 80% of which were closed or sold). The cost of East German products skyrocketed artificially as a result of the parity established between the two currencies. Exports collapsed. It is estimated that 4 million industrial jobs were lost in just a few years. The unemployment rate rose from 0% in 1989 to nearly 20% in some regions of the East during the 1990s. The social upheaval was severe (a loss of bearings and values, feelings of nostalgia, humiliation, and abandonment) despite significant financial transfers from West to East, amounting to approximately 1,500 billion marks between 1990 and 2004352 to modernize infrastructure and public services and to support the economy.
Toward a realistic approach to international trade
A country can promote trade where it brings mutual benefits, while protecting strategic sectors, jobs, and infrastructure, and limiting excessive dependence on critical actors or raw materials. Recent geopolitical crises have clearly highlighted Europe’s heavy energy dependence on authoritarian regimes. It is also necessary to recognize the diversity of economic paths: some prioritize domestic industrialization, while others focus on technological innovation or sustainable agriculture.
Rather than treating international trade as sacrosanct or, conversely, engaging in unilateral and imperialistic practices, as Donald Trump has done, it would be desirable to distinguish between controlled openness and dogmatic free trade, to restore economic sovereignty and the pluralism of development models, while viewing trade as a political tool in the service of cooperation and not as an automatic guarantee of peace and prosperity.
Find out more
- Ali Laïdi, A Global History of Protectionism, Passé composé, 2022.
- Dani Rodrik, The Globalization Paradox, W. W. Norton & Company, 2011
- Joseph Stiglitz, The Great Disillusionment, Fayard, 2003
- Paul Bairoch, Myths and Paradoxes of Economic History, La Découverte, 2005 (1st edition in English, 1993); Kozul-Wright, “Globalization Myths: Some Historical Reflections on Integration, Industrialization, and Growth in the World Economy,” UNCTAD Discussion Paper, 1996.
Globalisation is said to have systematically facilitated the development of poor countries
Globalisation is often portrayed as having benefited people in developing countries, a large portion of whom, thanks to their integration into global value chains (GVC),353, have been able to escape extreme poverty. This assertion, largely based on the success of countries in East and Southeast Asia (China and the “Asian Tigers”354 and, to a lesser extent, the “Tigers” of Southeast Asia355), is highly debatable.
First, it should be emphasized that the financialisation of the global economy—a hallmark of hyper-globalisation—is one of the major causes of the numerous financial crises that have struck the developing world since the 1980s, as these countries are particularly exposed and vulnerable to massive inflows and outflows of capital.356
Furthermore, as we will see in this Preconceived Idea with the exception of Asian successes, the developing world does not appear to be the primary beneficiary of trade growth.
Apart from some successful cases in Asia, there has been very little evidence of broad-based trade-induced structural change in other parts of the developing world regions.
Overall, China’s development has primarily resulted in increased demand for raw materials, which has reinforced the hyper-specialization and dependence of many countries on these types of exports, a trend further reinforced by the period of sharply rising commodity prices from 2005 to 2015.
Finally, while the expansion of manufacturing GVC has enabled a greater number of countries to participate in the international division of labor by drawing on their reserves of low-wage labor, this participation has been limited to certain narrow, low-value-added segments and has rarely allowed them to diversify and move into more technology-intensive activities.
Developing countries are not the main beneficiaries of trade expansion
Since the early 1950s, global trade in goods has grown dramatically: the volume of goods exports has increased more than 45-fold over the past 70 years.
As can be seen in the graph below, the share of developing economies (in blue) in global merchandise exports has risen sharply since the end of World War II, from just over 30% to nearly half the value of global exports.
Share of Exports by World Region in the Total Value of Global Exports (1948–2024)
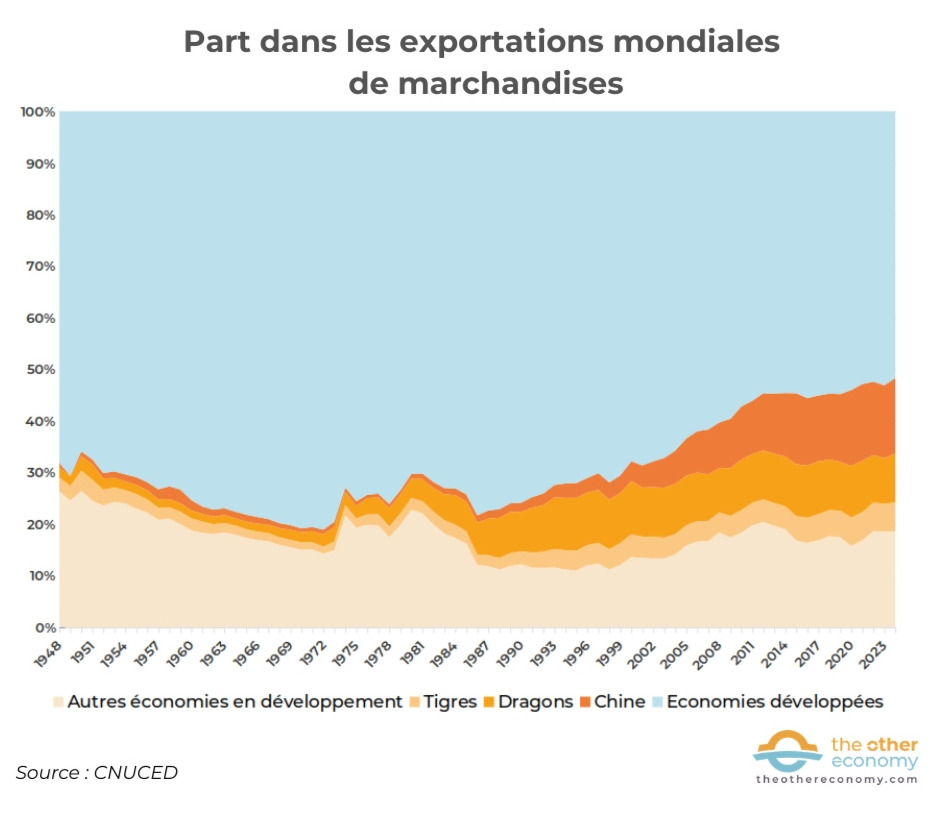
Source: UNCTAD Database – Commodities Series : Total Trade and Percentage of World Trade
The categorization of countries into developed economies (blue) and developing economies (orange) is based on the UNCTAD classification (2025 version). South Korea, which has been classified as a developed country since 2021, is included here among the developing world alongside the other “Asian Tigers” in order to highlight long-term trends.
However, once China and the “Asian Dragons” are excluded, the trend is quite different.
At just under 30 percent of the value of global exports, the share of developing countries (excluding China and the Asian Tigers) declined until the first oil crisis (1973). During the following decade, rising oil prices boosted exports from developing countries (though this actually applied only to oil-producing countries) before declining again in the late 1980s. Since then, the share of these countries—which remains low—has risen steadily from a low of around 13% to 24% in 2024 (with an increasing share accounted for by the Tigers).
During the same period, the population of this region increased fivefold, rising from 43% to 68% of the world’s population357. It is clear that the integration of developing countries into global trade has remained limited. The very strong growth in global merchandise trade over the past seventy years has primarily benefited developed economies, as well as China and the Asian Tigers.
A heavy reliance on raw material exports
Over half of developing countries’ exports come from the exploitation of natural resources
An analysis of the types of goods exported by developing countries (excluding China and the Asian Tigers) is particularly illuminating. It highlights the dominant share of exports derived from the direct exploitation of natural resources.
Commodities account for more than 50% of the value of goods exports from developing countries (excluding China and the Asian Tigers) over nearly the entire period from 1995 to 2024
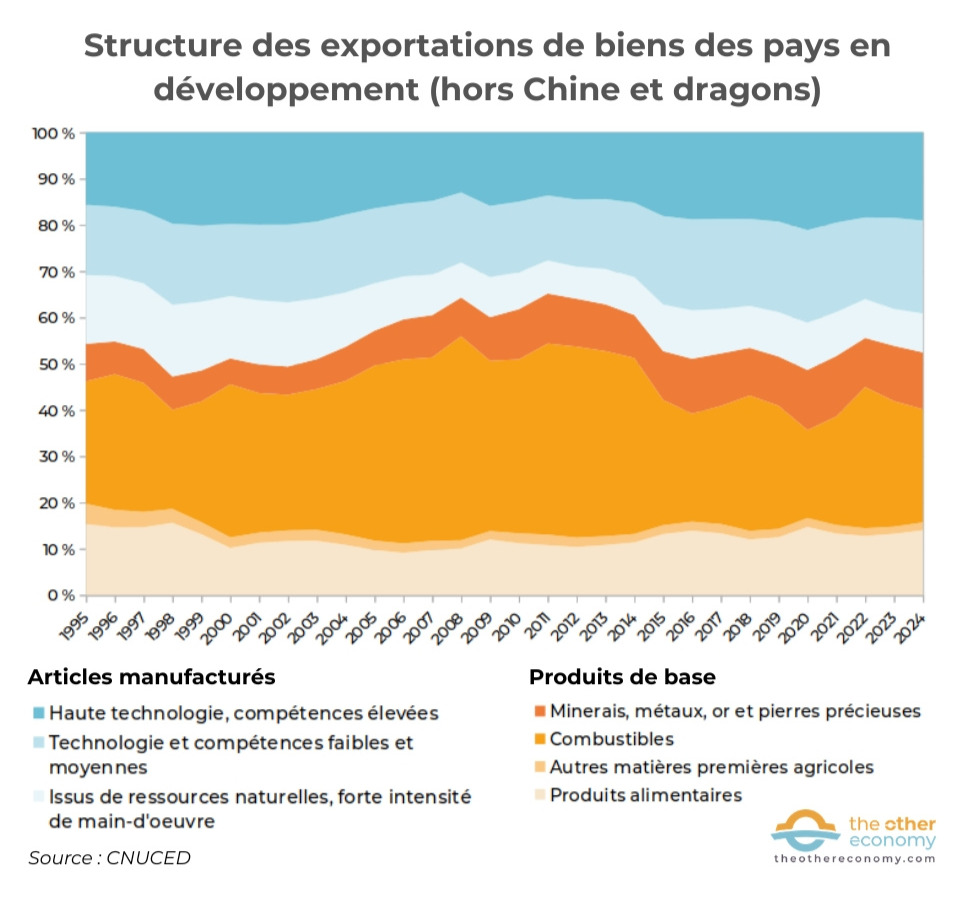
Source: UNCTAD database – Merchandise Trade Matrix series – annual.
Products are categorized according to the Standard International Trade Classification, Revision 3 (SITC Rev. 3) for commodities, and the subcategory “Grouping of Manufactured Articles by Degree of Processing” for manufactured articles. These classifications are available on the UNCTAD website (2025 version).
This dependence is even more pronounced when we consider, in addition to commodities, manufactured goods derived from natural resources358 which accounted for between half and three-quarters of the value of their exports during the 1995–2024 period.
We did not include exports of services in the chart above because data are not available prior to 2005. They account for approximately 20% of total exports of goods and services from developing countries (excluding China and the Dragons) starting in 2015 (and around 15% in the preceding period)359. They are highly concentrated: the top ten exporters account for nearly two-thirds of the group’s service exports in 2024 (with India’s exports alone accounting for 22%).
A perilous dependence
An economy is considered “commodity-dependent” when commodities account for more than 60% of its merchandise exports. According to a UNCTAD report360, over the 2021–2023 period, two-thirds of developing economies (95 out of 143) were in this situation. This proportion rises to 80% when considering the least developed countries361. As the report points out, the situation has changed very little since the 2012–2014 period.
Exports from developing economies that are heavily dependent on their natural resources
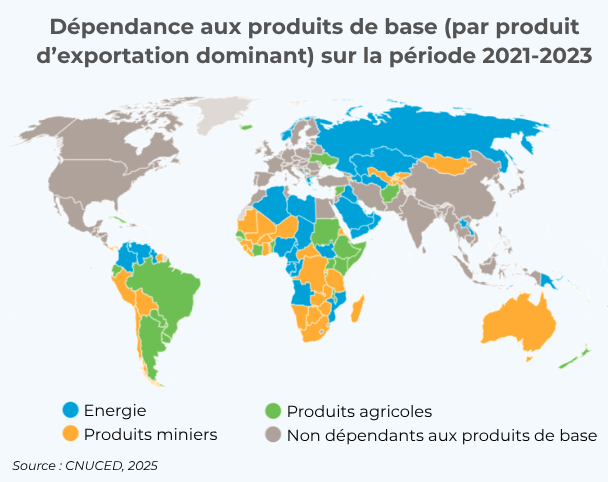
Source: The State of Commodity Dependence 2025, UNCTAD.
Reading: In 2021–2023, Russia is among the commodity-dependent countries (where commodities account for at least 60% of the value of its exports), with energy as its dominant export. The online chart on the UNCTAD website is interactive and allows users to view the exact percentages. For Russia, energy accounts for 55.7% of exports, agricultural products for 9.6%, and mineral products for 11.2%.
The situation obviously varies from country to country depending on the type of product exported and the volume of exports. However, in all cases, maintaining a very high level of a single type of export over a long period of time indicates a lack of economic diversification and, above all, carries risks.
Such dependence, long been a global concern, hinders economic resilience and leaves developing nations vulnerable to price volatility and external shocks.
Commodity prices are subject to significant fluctuations, as can be seen in the graph below. This vulnerability to fluctuations in commodity prices can lead to a deterioration in the terms of trade362 between imports and exports.
Relative Changes in Global Commodity Prices, 1995–2004
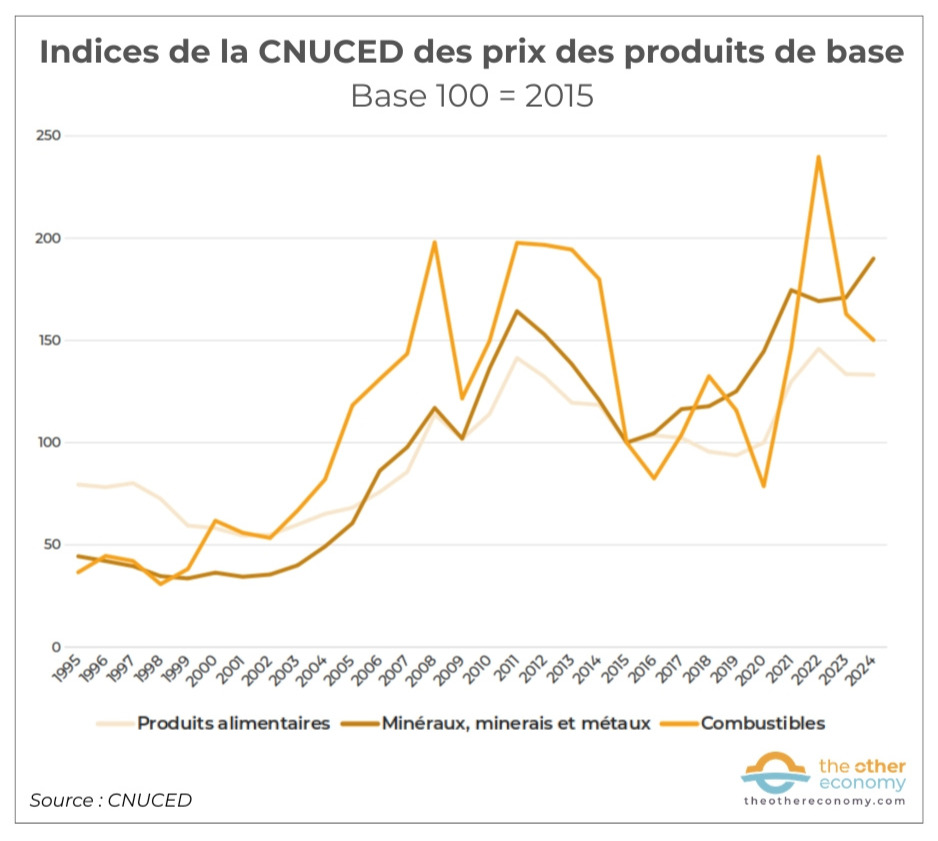
Source: UNCTAD Database – UNCTAD Commodity Price Index Series.
With regard to non-renewable resources (fossil fuels, minerals, and metals), an additional risk is, of course, the depletion of deposits. The example of the island of Nauru, whose economy collapsed in the early 2000s after the depletion of the phosphate deposits that had been the source of its wealth until then, is emblematic.
Finally, when it comes to food and agricultural raw materials, vulnerability is exacerbated by climate change and the consequences of unsustainable farming practices. This is illustrated by the example of cocoa, whose global production has fallen dramatically due to intensive farming practices that have made crops less resistant to pests and droughts363. The closure of the Strait of Hormuz following the war in Ukraine also highlighted the risks posed by dependence on imported inputs (fertilizers and energy in particular)364 in economies reliant on agricultural exports.
The Case of Sub-Saharan Africa
As can be seen on the map above, most African countries continue to specialize in the export of minimally processed raw materials: hydrocarbons, minerals, and tropical agricultural products. This specialization leaves them highly vulnerable to volatility in global prices and limits the spillover effects on other economic sectors.
Globalisation has not led to significant industrialization on the continent, with the exception of a few isolated cases365. Global value chains are often “truncated” there: extraction or primary production takes place locally, while processing and value creation occur elsewhere. This pattern perpetuates forms of dependence inherited from the colonial era.
Furthermore, international competition has weakened local food-producing agriculture in the face of subsidized imports from developed countries366. The promotion of cash crops (cocoa, coffee, cotton, etc.) has sometimes increased foreign exchange earnings, but at the cost of heightened food insecurity and greater exposure to climate shocks. Economic and political elites often capture the lion’s share of the benefits of economic liberalization, while the majority of the population remains excluded.
The natural resource curse
Far from being synonymous with prosperity, an abundance of natural resources can have disastrous consequences for a country’s development. This is the “resource curse.” The term was first used by the British economist Richard Auty in 1993367, this term refers to the range of negative consequences associated with the exploitation of an abundant natural resource.
Economic consequences
These are often referred to as the “Dutch disease,” in reference to the difficulties the Netherlands faced following the discovery and exploitation of large natural gas fields in Groningen beginning in the 1950s. The rise in export revenues led to an appreciation of the Dutch currency, resulting in a decline in the competitiveness of other exports. At the same time, imported goods, which had become cheaper, undermined entire sectors of the national economy. As Gilles Carbonnier explains, “ This trend is driving a wave of consolidation in the extractive sector (…). However, from a structural perspective, the extractive sector often remains an enclave, with little spillover effect on other national economic sectors, whether upstream or downstream. Furthermore, oil and mining operations are not particularly labor-intensive and cannot absorb the unemployment resulting from the difficulties faced by other economic sectors. “368
Political, social, and environmental consequences
The negative consequences of a single resource’s dominance in a country’s economy are not merely economic; they often stem from the institutional weakness of the affected states and the disproportionate power wielded by the entities exploiting the resource. Nigeria, Iraq, Libya, Venezuela, Angola (hydrocarbons), Sierra Leone (“blood diamonds”), the Democratic Republic of the Congo (copper), Guinea (gold and bauxite) are all countries with fragile or even failing institutions.
In the Fragile States Index Annual Report 2024369, compiled by the NGO The Fund for Peace, they rank among the lowest-scoring states. This is no coincidence. The “curse of natural resources” is both a cause and a consequence of weak institutions at all levels: limited capacity to negotiate with “extractive” companies—whether domestic or foreign—the capture of extraction rents by a privileged class (and thus a failure to redistribute it to educational and social programs), corruption, the exacerbation of internal or external armed conflicts and a weak capacity to maintain order, and the denial of environmental impacts as well as those on local communities living near exploited areas, etc.
The report Pipe Dreams: How Oil and Gas Fail to Deliver Economic Development in Africa, published in 2026, confirms all of these findings. Based on an analysis of the situation in 13 African oil- and gas-producing countries, the authors show that decades of production have failed to ensure the development of these countries. “Across all oil-producing African countries, the evidence shows that fossil fuels have enriched the wealthiest, hindered economic development, and made economies vulnerable to external shocks. The profits have gone to multinational corporations and elites, while communities have borne the costs associated with pollution, the loss of their livelihoods, and economic instability.”
The integration into manufacturing value chains
Globalisation has also led to the integration of certain developing countries into manufacturing value chains, driven in particular by the availability of a low-wage workforce.
In theory, the exploitation of an abundant, low-wage labor force is justified by the idea that, starting from a situation of very low wages, these wages gradually rise as technological progress generates productivity gains. This is what happened in Western Europe during the 19th and 20th centuries with the emergence of factories and successive waves of technical innovations (machine tools, the division of labor along production lines, automated machines, robots, etc.). However, social progress is not the “natural” result of technical progress, as the economist Anton Brender has shown370. They also rely on social achievements and the gradual creation of laws and institutions that make them possible.
Furthermore, the situation of the first countries to industrialize is incomparable to that of developing countries trying to integrate into value chains that are already globalized. The imbalance of power between the multinational corporations at the head of these value chains—most often from developed economies—and their suppliers, as well as the weak bargaining power of developing countries, has limited the economic expansion promised by globalisation. These companies have, in fact, organized production in such a way as to retain control over high-profit activities carried out in developed countries, while developing countries are confined to production and assembly activities. Thus, even when countries export products with medium or high technology intensity, this does not necessarily mean that they capture all the returns generated by the value chain. This is illustrated in particular by the “smiling curve.” Furthermore, tax, social, and environmental competition among suppliers and countries hinders wage growth as well as improvements in working conditions and environmental protection.
The Smiling Curve
First used in 1992 by Stan Shih371, founder of Acer, the smile curve is a simplified graphical representation of the fragmentation of production into different segments along global value chains: R&D, design, manufacturing, marketing, and services.
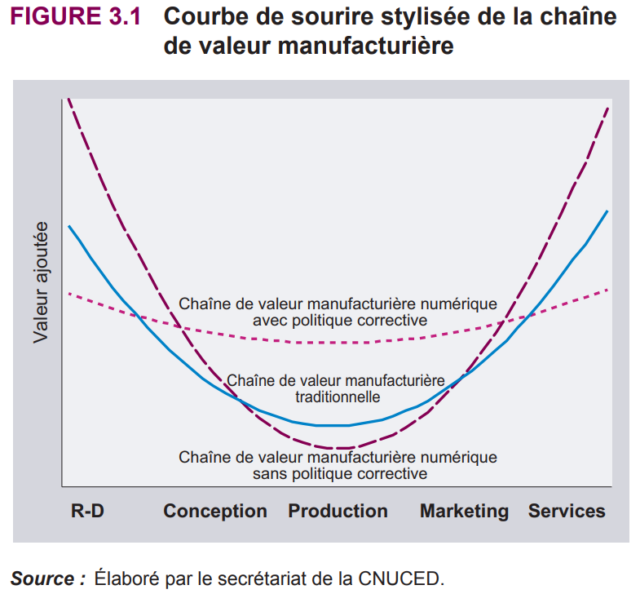
Source: Trade and Development Report 2018, UNCTAD (p. 80)
This fragmentation is reflected in the geographic distribution of economic power and labor. The countries where leading companies are headquartered (primarily developed economies and, increasingly, China and Southeast Asia) concentrate the high-yield activities of the pre- and post-production segments, where profit margins are highest. Developing countries, the “manufacturing hubs,” are most often confined to the lower-margin activities of the “production” segment of the manufacturing process. These countries thus find themselves “trapped in ‘low-cost industrialization’ or ‘prematuredeindustrialization.’”372
It should be noted that while the international division of labor benefits the multinational corporations at the head of global value chains (and their shareholders)373, this is not necessarily (or not entirely) the case for the host countries. On the one hand, tax evasion374 by multinational corporations, as well as the decline in corporate tax rates resulting from tax competition among nations, reduce government revenues. On the other hand, the “outsourcing” of production segments to low-wage regions leads to dangerous de-industrialisation and a loss of value added375 and a significant loss of jobs for the countries of origin. This dynamic fuels inequality and the loss of social cohesion, as the new jobs created at the ends of the supply chain are often insufficient to offset the jobs lost and, above all, are out of reach for those “left behind,” whether geographically or in terms of the skills required.
More generally, the idea that an abundant, low-wage workforce laboring under poor conditions is a viable path to social progress and development is contradicted by the facts. The examples of China and the Asian Tigers have shown that a development strategy cannot rely solely on cheap labor.
Multilateralism and free trade are thought to always go hand in hand
In official documents and in common thinking, free trade is very often equated with multilateralism. However, the two concepts are quite different. As we will see, free trade is not necessarily multilateral (there are many bilateral or regional free trade agreements or treaties), and multilateralism can apply to many non-trade areas. Furthermore, multilateral trade agreements can be designed without making free trade a primary principle by including, for example, health, social, or environmental rules. This is the whole point of mirror measures376.
Free trade should not be confused with multilateralism
Multilateralism, Bilateralism, Polylateralism: Definitions
Multilateralism is a system of international relations that emphasizes negotiations, mutual commitments, cooperation, and agreements among several countries377, with the aim of establishing common rules. It thus differs from unilateralism (action by a single state) or bilateralism (relations between two states). The multilateral approach378 can be applied to many issues beyond trade, such as health, migration, climate, digital technology and personal data management, natural resources, space, taxation, accounting and economic data management, financial stability, and armaments…
In summary, this approach is well-suited to global commons; Europe’s support for it stems not only from ethical considerations but also from a desire for effectiveness: it is easy to see that the fight against pandemics is greatly improved when the transfer of data, knowledge, and best practices is multilateral.
Former WTO Director-General Pascal Lamy recently introduced the concept of “polylateralism,” which“involves fostering dialogue among international actors who have almost no place within the framework of formalistic multilateralism among nation-states379.” These actors may include NGOs, labor unions, businesses, cities, or regions that have a specific interest in or relevance to an international issue.
What are the defining characteristics of free trade?
Free trade is a principle aimed at promoting the development of international trade by removing national tariff and non-tariff barriers that may restrict the trade in goods and services.
The removal of non-tariff barriers can extend as far as the harmonization of standards in production processes. The goal is to facilitate market access for exporting companies—particularly multinationals—by reducing the costs they incur in adapting to these standards and enabling them to achieve economies of scale: if a product can easily be adapted to larger markets, it may become less expensive to produce.
Proponents of free trade believe that it necessarily benefits consumers by increasing their choices and lowering prices. This overlooks the fact that consumers are also citizens and employees who are affected by offshoring and who may have an interest in maintaining high social, environmental, or health standards.
Tariff and Nontariff Barriers (or distortions)
Trade barriers are measures implemented by a country to regulate or restrict the import and export of goods and services.
Tariff barriers are taxes on imported goods. The main ones are customs duties, which have returned to the forefront of the international agenda with the trade war launched by the Trump administration380. While recent decades have been marked by extremely significant reductions in customs duties, they have not disappeared entirely. For example, the EU sets the rates of customs duties applied to various products imported into the Union each year381.
Non-tariff barriers are “general policy measures other than ordinary customs duties that can have an economic impact on international trade in goods by altering the quantities traded or the prices.”382
They are often justified on social, health, environmental, or security grounds. Non-tariff barriers encompass a wide range of measures that have been classified by UNCTAD: technical barriers383, sanitary and phytosanitary measures (e.g., the EU bans certain pesticides in imported agricultural products), quantitative restrictions (quotas, licenses, bans), price measures (taxes other than customs duties), government subsidies, or public procurement rules, etc.
It should be noted that, according to this definition, neither VAT nor currency undervaluation are tariff or non-tariff barriers, even though they can be used for protectionist purposes.
Learn more: International Classification of Non-Tariff Measures, UNCTAD, 2019; Trade Analysis and Information System (TRAINS) database, which lists non-tariff measures as well as trade defense measures (antidumping measures and safeguard measures384
The failure of multilateralism has not spelled the end of free trade
Throughout the second half of the 20th century, trade liberalization was pursued through multilateral negotiations. In 1995, the creation of the WTO—the culmination of this process—also marked the end of trade multilateralism (with the failure of the Doha Round), but not the end of efforts to promote free trade. In fact, it wasn’t until the 2008 financial crisis that the primacy of free trade began to be questioned, and it wasn’t until Donald Trump’s first term that trade policies truly began to shift.
From the GATT to the WTO: a multilateral framework for promoting free trade
From the adoption of the General Agreement on Tariffs and Trade (GATT) in 1947 to the creation of the WTO in 1995, various international trade agreements have been based on free trade and have focused on removing tariff barriers and, later, non-tariff barriers. This has not changed under the WTO, which has essentially carried over the rules that had been negotiated previously.
What is the WTO’s mission?
The Agreement Establishing the WTO contains no article defining the organization’s objectives. As specified in Article III, its functions consist primarily of:
- administer a global system of trade rules: the WTO Agreements;
- establish a framework for negotiating multilateral trade agreements;
- resolve trade disputes among its members in accordance with existing regulations.
It is striking to note that the various texts included in the WTO Agreements385 consist primarily of rules and obligations. No article addresses the overarching objectives that explain the rationale behind these provisions.
You need to browse the WTO website to understand the general direction of international trade policy: the WTO defines itself as “an organization for liberalizing trade. It’s a forum for governments to negotiate trade agreements. It’s a place for them to settle trade disputes. It operates a system of trade rules. “. The promotion of free trade is thus clearly at the core of the organization’s DNA, as is also evident in its guiding principles, its missions, and its advocacy for open trade.
The difference from the Havana Charter is striking. Adopted in 1948, this charter established an International Trade Organization (which never came into being due to opposition from the U.S. Congress), whose general purpose is stated in the very first article: “To achieve the objectives set forth in the Charter of the United Nations, particularly the raising of living standards, full employment, and the conditions for progress and development in the economic and social order envisaged in Article 55 of that Charter.”
Since the 2000s, free trade has taken place within a bilateral or regional framework
Launched in 2001 by the WTO, the Doha Round of negotiations stalled over the issue of agriculture—specifically, developed countries’ market access for agricultural products from developing countries and the elimination of export subsidies in this sector. This marked the end of multilateral trade negotiations. It is worth noting, however, a positive development in the Doha Round regarding public health—specifically, the issue of generic drugs386.
Since 2017, the Dispute Settlement Body—the WTO’s primary tool for enforcing international trade rules—has been rendered ineffective by the first Trump administration.
Following the failure of the WTO, trade liberalization has continued through bilateral or regional trade agreements. In its database on regional trade agreements (accessed on 08/14/26), the WTO lists 386 such agreements, more than three-quarters of which are bilateral.
Since the WTO was established, the number of regional trade agreements in force has more than tripled, rising from 100 in 1995 to 376 in 2025
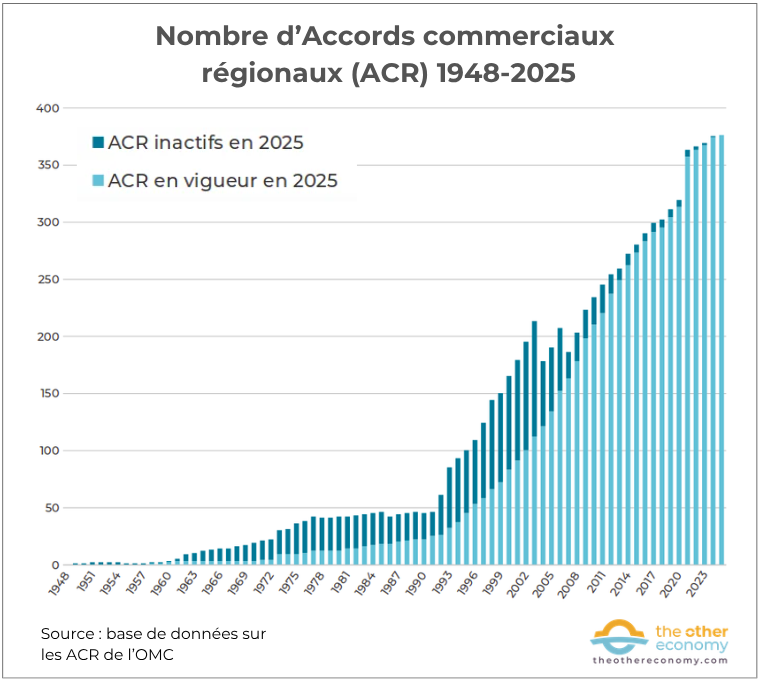
Source: WTO database on Regional Trade Agreements (RTAs)
Reading: In 1999, 150 ACRs were in effect, 72 of which are still in effect in 2025. The increase in the number of agreements between 2020 and 2021 is due to new agreements signed by the United Kingdom to replace its pre-existing agreements as a member of the European Union.
The stated goal remains the same: to promote free trade, and thus to eliminate not only tariffs but also non-tariff barriers. These agreements have been widely criticized for their lack of transparency, their social and environmental consequences, and the power they grant to multinational corporations over national governments (through private arbitration tribunals387).
The End of Free Trade?
Since the 2007–2008 financial crisis, the primacy of free trade has gradually been called into question. Criticism has gained a wider audience and greater credibility beyond anti-globalisation movements. It focuses on the social and environmental consequences of unchecked free trade, as well as the increasingly obvious risks posed by the expansion of globalised supply chains. A consensus thus appears to be emerging, regardless of political affiliation, on the importance of protecting domestic industries or the agricultural sector for strategic, economic, and social reasons alike.
China’s economic success has also contributed to this growing awareness. Indeed, it was notably the combination of a gradual and controlled opening of its markets and planned industrial policies that enabled the country to become, first, “the world’s factory” and, later, a (if not THE) global leader in several cutting-edge technologies (e.g., the digital and energy transition sectors).
In advanced economies, industrial policy is gradually regaining its prestige in the face of the free-market paradigm. It is fully embraced in the United States, particularly with Joe Biden’s launch in 2022 of an ambitious investment policy388 in green industries and digital technologies, involving numerous measures classified as “non-tariff barriers”: subsidies for the energy transition and semiconductor industries, preferential treatment for domestically produced renewable energy and vehicles, restrictions on the export of chips for generative AI, and so on. The EU, on the other hand, is significantly more cautious in this regard.
US-China trade war
The use of trade for the purposes of economic warfare and the assertion of geopolitical power is the most visible manifestation of the challenge to free trade. This is evident, for example, in the return of tariffs to the trade policy agenda. This was particularly highlighted by Donald Trump with the Liberation Day (April 2, 2025), this resurgence of tariffs (which began during his first term and was not challenged by his successor) is being promoted as part of a narrative that portrays the United States as a “victim” of the rest of the world.
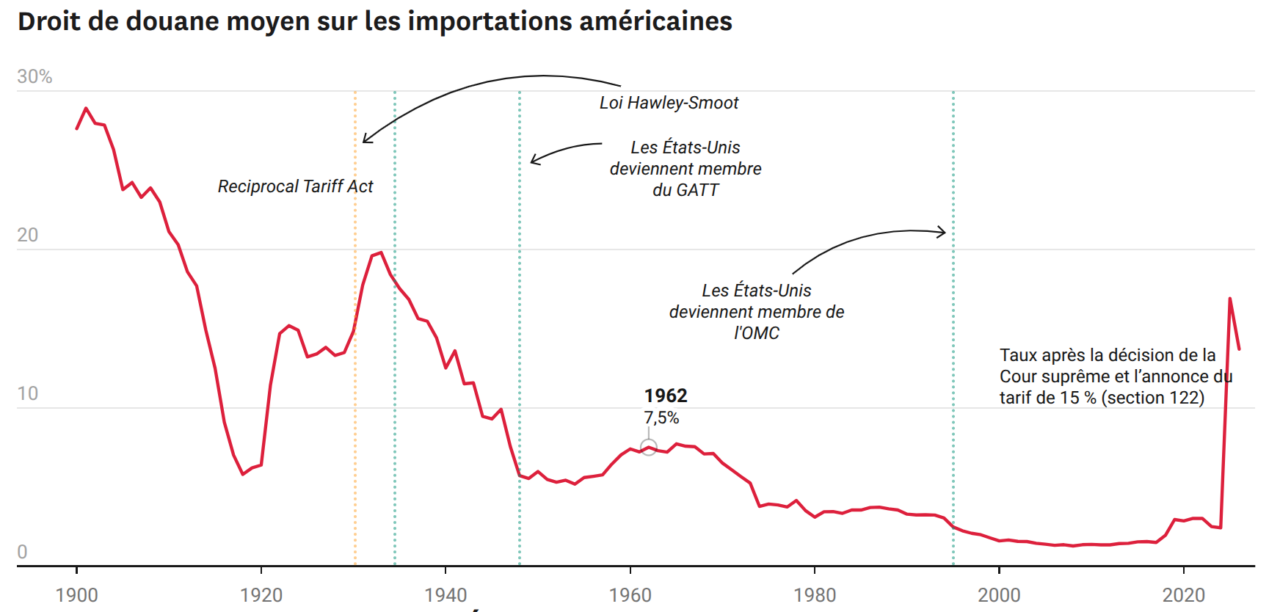
Trump and the Trade War, Le Grand Continent (accessed in May 2026)
While most countries—and notably the European Union—have negotiated a reduction in these unilateral tariffs, China has responded by “arming itself”389 critical minerals. Leveraging its dominant position in the value chain390 for several essential minerals in the tech, energy, low-carbon vehicle, and defense sectors, China has adopted new export rules for seven rare earth elements in response to U.S. tariffs391. Foreign companies must now obtain licenses392 when they wish to import these rare earths as well as products containing them (such as magnets, for example).
The liberalization of trade that began in the aftermath of World War II was justified by the idea that the growth of trade promoted peace and global economic development. However, the myth of “happy globalisation” was short-lived. Free trade has served the interests of the most powerful players, particularly multinational corporations: in a context where these players wield market power393 , leaving the market “free” means giving these actors the means to maintain their dominant position. The significant social consequences for those left behind by globalisation are fueling current international geopolitical tensions and posing risks to democracy.
In this context, the multilateral approach remains the preferred option in an interdependent world that must manage multiple commons. In the absence of global multilateralism—which is illusory in the current context of growing tension—regional multilateralism could be a path worth encouraging, provided that it is based not on free-trade ideology but rather on the goal of fair trade, with trade serving the common good.
The economic superiority of free trade has supposedly been demonstrated by economists
While not universally supported, free trade394 is widely promoted by economists: many, starting with the British economist David Ricardo, have attempted to demonstrate the superiority of this form of trade organization over others. While there are numerous theoretical arguments in its favor, they remain debatable and contested.
The Major Classical Theories of International Trade and Their Limitations
The Ricardian model: an extremely flawed argument
The “theorem” of comparative advantage developed by David Ricardo is often presented as theoretical proof in favor of free trade. However, it proves nothing because it is based on an extremely simplified model of economic reality. It overlooks essential aspects:
- Not all products and forms of production are equal: a country that is “strong” in the supply of basic agricultural goods—and that limits itself to that—has no chance of developing any industry;
- the creation of industrial dependence on one or more non-allied countries that could exploit this dependence to their advantage;
- the social and political effects of deindustrialization;
- the fact that free trade creates winners and losers, and that the gains of some do not “offset” the losses of others;
- the services provided by nature on a macroeconomic scale, such as a relatively stable climate (before human-induced climate change) or breathable air…
Furthermore, in Ricardo’s time, offshoring was virtually nonexistent. The weakening of democratic institutions resulting from the loss of power by local and national elected officials (who lack the means to prevent offshoring or to set tax and environmental regulations) is therefore not a factor in his reasoning. Today, the mobility of capital calls into question the very logic of comparative advantage.
Furthermore, studies show that the specialization touted by Ricardo can create industrial and geopolitical dependencies, a fact of which Europe is becoming increasingly aware in the wake of the COVID crisis.
“Rybczynski’s Theorem”395 in particular highlights that a country’s specialization leads to the gradual disappearance of other productive sectors. This explains why developed economies are deindustrializing, while developing economies primarily produce goods for export—sometimes at the expense of their own domestic industries and agriculture. The Niger Delta provides a prime example of this396 since foreign oil companies began operating there.
The Heckscher-Ohlin-Samuelson (HOS) models
In the 1930s, building on the Ricardian approach, Swedish economists Eli Heckscher and Bertil Ohlin developed a model known as the HO model, which was later expanded upon by Paul A. Samuelson and Wolfgang S. Stolper, hence the acronym HOS model. Heckscher and Ohlin concluded from their model that each country exports goods that make intensive use of the factors of production in which it is relatively best endowed. The Stolper-Samuelson theorem shows that trade favors the abundant factor and penalizes the scarce factor, thereby altering the domestic income distribution.
However, these findings were empirically challenged as early as the 1950s:
Leontief’s Paradox
First observation: Why aren’t we seeing the industrial specialization predicted by these models? In 1953, economist Wassily Leontief realized397 an econometric study aimed at empirically testing the HOS model, according to which countries export goods produced from the resources in which they are most abundantly endowed. He showed that the United States, despite being rich in capital, exports labor-intensive goods, thereby calling into question the model’s conclusion. This paradox has been confirmed by subsequent studies.398
The unanswered question of intra-industry trade
Second observation: How can we explain that very similar countries, such as Germany and France in the 1950s, with similar factors of production, traded similar goods? And why did “intra-industry trade”—which refers to trade between countries in goods or services belonging to the same industry or sector—increase sharply after World War II? These observations call into question the theoretical findings of HOS.
Modern Theories of International Trade
Linder, Grubel, and Lloyd and Intra-Industry Trade
Several models and theories were then developed beginning in the 1960s to explain the intra-industry trade paradox.
In 1961, Staffan B. Linder published a book399 in which he argues that intraindustry trade between similar countries can be explained by demand patterns. Countries that have reached the same level of development would thus have the same demand structure. This is an interesting but incomplete observation. Linder shows that similarities in demand can give rise to intra-industry trade, but does not truly explain it. What is missing is a mechanism that makes trade preferable to autarky—a question that other economists would go on to explore.
In 1975, Herbert Grubel and Peter Lloyd proposed a formula for measuring the extent of intra-industry trade. This formula, known as the Grubel-Lloyd index, provides evidence of growth in intra-industry trade in developed countries.
Krugman and economies of scale
In the late 1970s, economist Paul Krugman400, considered one of the founders of the New Theory of International Trade, incorporated economies of scale into his analysis401 (and thus the fact that, contrary to neoclassical theory, returns are most often increasing), the theory of monopolistic competition, and product differentiation. He explains intra-industry trade among similar countries by consumers’ desire for access to a variety of products.
This is one of the most common arguments in favor of free trade, which is said to lead to a greater variety of available goods and higher productivity through competition among businesses. In reality, free trade favors large companies that are able to take advantage of economies of scale and leads to the formation of oligopolies.
In 1990, Paul Krugman showed402 that trade promotes industrial concentration in certain regions, creating centers of competitiveness through positive externalities and agglomeration effects. He continued to advocate for free trade in a widely read book published in 1998 Globalization is not to blame. The virtues and limits of free trade . But he acknowledges that, in sectors where increasing returns to scale and learning effects are strong (such as aerospace or high technology), a strategic trade policy might be justified.403
Increased productivity and its impact on inequality
In 2003, economist Marc J. Melitz404 shows that free trade primarily benefits the most productive firms. He also demonstrates how the overall growth in sectoral productivity generated by reallocations contributes to an increase in welfare. In this article, this gain is measured by a decline in the price index, resulting from the increase in average productivity generated by trade-induced inter-firm reallocations. He thus highlights an effect of trade that had not been previously recognized. Of course, one can debate this definition of well-being, which is purely linked to purchasing power and consumption.
But in 2010, Helpman, Itskhoki, and Redding405 demonstrated that free trade creates winners and losers not only among countries but also within a single country. It increases wage inequality between workers in exporting firms and those in “domestic” firms and has a mixed impact on unemployment: it promotes the expansion of exporting firms, which hire more workers, and is detrimental to the least productive, most vulnerable firms, which may go out of business, potentially leading to unemployment.
Contemporary Models of International Trade: Simulation Tools Rather Than Demonstrations
Major national and international institutions (IMF, World Bank, OECD, European Commission) now rely on mathematical models406 to analyze international trade and assess the effects of trade policies. These models play a central role in the formulation of economic policy recommendations. However, their use raises a key question: Do these tools demonstrate the superiority of free trade, or do they merely simulate the effects of trade liberalization under given assumptions?
We can identify three major families of models, whose conceptual and normative limitations must be explicitly highlighted.
Gravity models: describing flows rather than causes
First introduced empirically by Jan Tinbergen in 1962, gravity models are based on an analogy with the law of gravity: trade between two countries increases with their economic size and decreases with geographic distance. Their strength lies in their ability to accurately capture the patterns observed in trade data.
These models have been progressively expanded and now incorporate transportation costs, trade barriers, and certain institutional effects. Research such as that by Anderson and van Wincoop407 place these relationships within a broader framework that encompasses overall economic exchanges.
However, these models remain primarily descriptive: they explain where and with whom countries trade, but say much less about why certain specializations might arise, or what the social, industrial, and political effects of such trade might be. They provide no indication of the “benefits” of free trade.
Computable general equilibrium (CGE) models: formal consistency at the cost of highly questionable assumptions
EGC models are designed to simulate the impact of changes in trade policy on the economy as a whole. They incorporate multiple countries, multiple sectors, and the interactions between supply, demand, and prices. By design, they converge toward a simultaneous equilibrium of supply and demand across all markets.
Widely used models such as GTAP, LINKAGE, ENVISAGE, and MIRAGE are employed to assess the expected effects of free trade agreements on trade flows, income, and sectoral specialization.
But, like all general-equilibrium models408, their formal consistency rests on assumptions that have not been empirically verified. Consequently, these models cannot in any way prove that free trade is optimal: they merely show that it can yield gains (measured using questionable metrics) within the hypothetical framework on which they are based.
Empirical analyses based on the most widely used computable general equilibrium models—GTAP409 and LINKAGE from the World Bank410 — show that the net gains from trade liberalization are remarkably small, even under the assumption of complete liberalization: less than one cent per day per capita for the developing world, according to GTAP. Moreover, these gains are very unevenly distributed even within developing countries: a handful of countries (Brazil, Argentina, Vietnam, China, India) capture the vast majority of them—and in some realistic scenarios, countries like Bangladesh or much of sub-Saharan Africa come out worse off. A critical review of these models411 further highlights that these estimates suffer from questionable structural assumptions that tend to overestimate the benefits.
Although more sophisticated, dynamic stochastic general equilibrium (DSGE) models still do not prove the superiority of free trade
DSGE models incorporate a time dimension and uncertainty through random shocks (technological, financial, political, or trade-related). They make it possible to analyze not only the immediate effects of trade policies, but also their medium- and long-term trajectories.
Models such as GIMF (IMF), NiGEM (NIESR), and E3ME (Cambridge Econometrics) provide a more complex view of global macroeconomic interactions than CGE models and sometimes incorporate environmental or energy dimensions.
Nevertheless, despite their sophistication, these models, too, are based on structural assumptions that are as strong as they are unrealistic (rational expectations, representative behavior, long-term stability), which limit their descriptive and normative scope. They help inform economic policy decisions, but in no way constitute a theoretical demonstration of the superiority of free trade.
Econometric estimates of the benefits of free trade are inconclusive
The valuation of the economic benefits of free trade is questionable
Several studies have highlighted the positive economic effects of trade liberalization. A study published in 2007412 on several free trade agreements (FTAs) showed that, on average, an FTA roughly doubles bilateral trade between two member countries after 10 years. According to another study published in 2016413, a 1% reduction in tariffs would result in an increase of approximately 0.49% in exports for ECOWAS countries414 to the European Union, illustrating a positive econometric effect of free trade on trade flows. Estimates from the World Bank415 suggest that greater trade openness can increase GDP growth by 1 to 1.5 percentage points, leading to a 10% to 20% rise in incomes after a decade. Finally, another study shows that trade agreements tend to increase bilateral trade between participating countries.416
These results are sometimes interpreted as evidence of overall economic gains associated with free trade. But in fact, they do not support such conclusions. In fact, much of this research relies on gravity models or computable general equilibrium models (whose limitations we discussed in the previous section) to estimate the impact of free trade agreements on trade flows or GDP.
What are the impacts of free trade on well-being and the environment?
The indicators of “success” in trade liberalization relate to the volume of trade flows or GDP, not to social progress. The fact that trade liberalization leads to increased trade says nothing about the quality of life of the populations involved, much less about the quality of their environment or the preservation of their natural resources. As for GDP, it is well established that it is not an indicator of “social well-being” or of economic and social health.
Recent empirical studies show that free trade agreements may be associated with a decline in human development indicators at the subnational level, with gains concentrated in certain urban areas or social groups, while other regions suffer lasting losses.417
The limitations of assessing free trade
Finally, these studies, based on empirical data, cannot evaluate free trade per se, an abstract concept defined in theory as the absence of all tariff and nontariff barriers (across all economic sectors), which does not occur in such “pure” form in reality.
Economist Luis Moreles-Flores418 summarizes his analysis of numerous empirical studies of this type as follows: “Three aspects of the empirical literature make it very difficult to draw any reliable policy conclusions: (a) the criteria used to define the concept of “free trade,” (b) the underlying assumptions embedded in the econometric techniques used to estimate causal effects, and (c) the widespread desire among academic economists to produce scientific results in the form of universally valid generalizations. The analysis highlights a troubling disconnect between, on the one hand, the objectives and findings of scientific economic research and, on the other hand, the type of data that would be useful for guiding concrete policy deliberations. “
Thus, neither theoretical models nor empirical studies can rigorously and universally demonstrate the superiority of free trade. Contemporary analyses show, on the contrary, that trade liberalization produces varied effects, creates winners and losers, and, in many cases, justifies selective and regulated trade policies.
- Historians themselves disagree among themselves… ↩︎
- Ashley Scott et al., “Exotic Foods Reveal Contact Between South Asia and the Near East During the Second Millennium BCE,” PNAS, 2020. ↩︎
- See, for example, Janet Abu Lughod, Before European Hegemony: The World System A.D. 1250–1350, Oxford University Press, 1989. ↩︎
- For further explanation and examples, see page 22 of The Statistical Review of World Trade 2016, WTO. ↩︎
- To learn more about the 1947 GATT Agreement and subsequent rounds of negotiations, visit the WTO website. See also Essential 7 on the international institutional framework. ↩︎
- The customs union is an area free of customs duties between internal borders, where a common customs tariff is applied to goods from third countries. ↩︎
- which increased from six to nine in 1973. ↩︎
- Une chaîne de valeur mondiale (CVM) comprend l’ensemble des activités interdépendantes réalisées à travers le monde par différentes entreprises pour mener un produit de sa conception à son utilisation finale (voire à sa fin de vie). Elles impliquent un très fort niveau de coordination entre les acteurs. À la tête des CVM se trouvent des multinationales, dont dépendent de fait les autres acteurs de la chaîne. En savoir plus dans l’Essentiel sur les CVM dans notre module Mondialisation et commerce international. ↩︎
- They range from approximately 6,000 billion to more than 32,000 billion (in current dollars). Sources: For goods, Merchandise Trade Matrix (UNCTAD); for services , 2005–2024 : Exports and Imports by Service Category (UNCTAD) and 1995–2004: WTO database. ↩︎
- The average annual growth rate of exports of goods and services (by value) reached nearly 9.5% for the period 1995–2008 and declined to about 3% for the period 2008–2024 (with eight years in which the value of exports declined). ↩︎
- Une chaîne de valeur mondiale (CVM) comprend l’ensemble des activités interdépendantes réalisées à travers le monde par différentes entreprises pour mener un produit de sa conception à son utilisation finale (voire à sa fin de vie). Elles impliquent un très fort niveau de coordination entre les acteurs. À la tête des CVM se trouvent des multinationales, dont dépendent de fait les autres acteurs de la chaîne. En savoir plus dans l’Essentiel sur les CVM dans notre module Mondialisation et commerce international. ↩︎
- See, for example, the TIVA database developed by the OECD or the Asian Development Bank’s GVC indicators. See also the work of Alessandro Borin and Michele Mancini, two World Bank economists who developed a framework for analyzing exports to identify traditional bilateral trade (where exported goods are consumed directly by the importer) and upstream and downstream participation in global value chains: Measuring What Matters in Global Value Chains and Value-Added Trade, Policy Research Working Paper, World Bank, 2019. ↩︎
- A country’s domestic value added from exports refers to the share of goods and services exported by that country that is produced domestically. Foreign value added refers to the share of foreign-sourced inputs in the production of goods and services intended for export. ↩︎
- Source: Global Value Chain Development Report 2023 (Figure 1.2), WTO. ↩︎
- See this technical note from the WTO Statistics Division, which explains the sources used to compile international trade statistics. ↩︎
- For example, a subsidiary that “owns” a multinational corporation’s brand may sell the service (intellectual property rights) associated with its use to all other companies in the group. ↩︎
- See the UNCTAD database— Goods and Services Series (MBP6): exports and imports of goods and services, annual. Since 2021, South Korea has been classified as a developed country. To enable long-term comparisons, we have included it in the developing economies category for the entire period. ↩︎
- These statistics include all 27 countries that made up the European Union in 2028, plus the United Kingdom, which left the EU in 2021. It should be noted that the decline in trade also applies to Germany. ↩︎
- Une chaîne de valeur mondiale (CVM) comprend l’ensemble des activités interdépendantes réalisées à travers le monde par différentes entreprises pour mener un produit de sa conception à son utilisation finale (voire à sa fin de vie). Elles impliquent un très fort niveau de coordination entre les acteurs. À la tête des CVM se trouvent des multinationales, dont dépendent de fait les autres acteurs de la chaîne. En savoir plus dans l’Essentiel sur les CVM dans notre module Mondialisation et commerce international. ↩︎
- These are South Korea, Hong Kong, Singapore, and Taiwan. ↩︎
- Roland Rajah and Ahmed Albayrak, China versus America on Global Trade, Lowy Institute, January 2025. ↩︎
- The Asian Tigers are also sometimes referred to as the second-generation newly industrialized countries (in contrast to the Asian Dragons). They also include the Philippines. ↩︎
- With the exception of the United States, Canada, Greenland, Bermuda, and Saint Pierre and Miquelon, which are classified as developed economies. ↩︎
- In financial terminology, financialization refers to the growing reliance on external financing—and in particular, on debt—by all economic agents. ↩︎
- According to the dashboard maintained by the Stability Council, global financial assets rose from approximately $176 trillion in 2006—3.4 times GDP—to nearly $500 trillion in 2024—4.5 times GDP (GDP in current dollars, World Bank database). ↩︎
- ↩︎
- Une chaîne de valeur mondiale (CVM) comprend l’ensemble des activités interdépendantes réalisées à travers le monde par différentes entreprises pour mener un produit de sa conception à son utilisation finale (voire à sa fin de vie). Elles impliquent un très fort niveau de coordination entre les acteurs. À la tête des CVM se trouvent des multinationales, dont dépendent de fait les autres acteurs de la chaîne. En savoir plus dans l’Essentiel sur les CVM dans notre module Mondialisation et commerce international. ↩︎
- To learn more about the Bretton Woods system, see Essential 7 on the international institutional framework and the Essential on floating exchange rates in the Module on Money. ↩︎
- La balance des paiements est un document de comptabilité nationale qui dresse chaque année le solde des échanges entre l’ensemble des agents économiques résidents d’un pays et le reste du monde. Il comprend en particulier la balance des biens et services (le solde des exportations et des importations) et permet de savoir si un pays est créditeur ou débiteur du reste du monde. En savoir plus dans l’encadré sur la balance des paiements de notre module Dette et déficits publics. ↩︎
- The prefix “euro” comes from the fact that the first transactions of this type took place in Europe, but it has no connection to the euro (which did not exist at the time) or to Europe itself. ↩︎
- See the article “It All Began in September 1957…,” by Ronen Palan, Alternatives Économiques, 2014. ↩︎
- This situation is known as the “Triffin dilemma,” named after the economist who theorized it. The dominant country must constantly run an external deficit so that foreign economic agents can hold its currency (which serves as the basis for international trade). If this is not the case, foreign economic agents lack the liquidity to pay for their international purchases (a situation that prevailed in the 1950s). Conversely, if the dominant country runs a deficit that is too large and too prolonged, this ultimately undermines confidence in the reserve currency. ↩︎
- La balance des transactions courantes (ou balance courante ou compte des transactions courantes) dresse le solde des échanges entre les résidents d’un pays et le reste du monde dans 4 domaines : 1/ les échanges de biens (balance commerciale), 2/ les échanges de services. 3/ les revenus primaires, c’est-à-dire les rémunérations perçues et versées en contrepartie des contributions transfrontalières à la production en travail (salaires des travailleurs frontaliers ) et en capital (flux de dividendes et d’intérêts), 4/ les revenus secondaires c’est-à-dire les transferts courants entre résidents et non‐résidents (ex : en France, les versements de la France aux institutions européennes ou internationales, et les envois de fonds des travailleurs immigrés vers leur pays d’origine). Ce document de comptabilité nationale est inclus dans la balance des paiements. En savoir plus dans l’encadré sur la balance des paiements de notre module Dette et déficits publics. ↩︎
- This increase in the deficit is linked in particular to the economic recovery in Europe and Japan (which now have less need for American products and are even competing with them) as well as to significant U.S. spending (the creation of the Medicare program, and increased military spending driven by the Cold War and the Vietnam War). ↩︎
- In 1981, amid high inflation caused by the oil crises of 1973 and 1979, the chairman of the U.S. Federal Reserve, Paul Volcker, decided—in accordance with the quantity theory of money (a controversial theory)—to sharply raise interest rates to 20 percent. ↩︎
- The distinction between FDI and portfolio investment was established by Stephen H. Hymer in his dissertation, The International Operations of National Firms: A Study of Direct Foreign Investment, completed in 1960 at MIT (and published in 1976). ↩︎
- Une chaîne de valeur mondiale (CVM) comprend l’ensemble des activités interdépendantes réalisées à travers le monde par différentes entreprises pour mener un produit de sa conception à son utilisation finale (voire à sa fin de vie). Elles impliquent un très fort niveau de coordination entre les acteurs. À la tête des CVM se trouvent des multinationales, dont dépendent de fait les autres acteurs de la chaîne. En savoir plus dans l’Essentiel sur les CVM dans notre module Mondialisation et commerce international. ↩︎
- While the term “FDI” is the most commonly used in French, the OECD uses the term “IDI”. ↩︎
- This 10% limit was set by the OECD. ↩︎
- Les actifs incorporels sont des “biens” intangibles, tels les droits de propriété intellectuelle (brevets, marques, droits d’auteurs, logiciels, bases de données clients, dessins industriels etc.), les fonds de commerce ou les droits au bail. En savoir plus dans l’Essentiel sur les multinationales du module Mondialisation et commerce international. ↩︎
- See “What Is Real and What Is Not in the Global FDI Network?”, IMF working paper (2019), and “International Investments Overestimated by 40%,” by Christian Chavagneux, Alternatives Economiques (December 20, 2019). ↩︎
- Source: UNCTAD database, “Foreign Direct Investment: Inward and Outward Flows and Stocks.” ↩︎
- Trade and Development Report 2020 —Chapter 5: Rethinking Multilateralism for a Better Recovery. The report presents (page 132), for 30 developing countries, the ratio of external payments to new FDI inflows for the periods 1990–2008 and 2009–2019. Eight countries had a ratio greater than 1 (net outflow of payments) for the 1990–2008 period, and 14 for the subsequent period. ↩︎
- Michael Porter introduced the concept of the value chain in 1985 in his book The Competitive Advantage: Creating and Sustaining Superior Performance, NY: Free Press. The concept was subsequently revised several times, leading to the development of the concept of the global value chain. ↩︎
- For example, the value chain for apparel extends from fiber production (agricultural or chemical) to the retail sale of clothing to the end consumer, including weaving, dyeing, garment design and assembly, marketing, and distribution. ↩︎
- U.S. Tariffs Are Upsetting the Global Automotive Industry’s Complex System, Marc Chevallier, Alternatives Économiques, (April 7, 2025). ↩︎
- See the report European Industry Facing the Chinese Steamroller, High Commission for Strategy and Planning, 2026. ↩︎
- Les accords de protection des investissements ont pour objectif de faciliter la circulation des capitaux (en particulier les investissements directs à l’étranger – IDE). Ils apportent des garanties juridiques aux investisseurs de chaque État signataire contre les mesures (nationalisation, évolution législative ou réglementaire) que le gouvernement d’un autre État signataire pourrait prendre et qui nuiraient à leurs investissements. Ces accords sont vivement critiqués car ils servent souvent de base à des procès contre des États, menés par des entreprises s’opposant à des évolutions législatives motivées par des enjeux sanitaires, sociaux ou écologiques. De plus, ces procès se déroulent dans tribunaux d’arbitrages privés opaques. C’est par exemple le cas du Traité sur la Charte de l’Énergie. ↩︎
- ↩︎
- The North American Free Trade Agreement, which was replaced in 2020 by the Canada–United States–Mexico Agreement (USMCA). ↩︎
- Les barrières (ou “distorsions”) aux échanges commerciaux sont des mesures mises en place par un pays pour réguler ou restreindre l’importation et/ou l’exportation de biens et services. Les barrières tarifaires sont essentiellement les droits de douane. Les barrières non tarifaires sont des réglementations ou des restrictions administratives qui impactent l’importation ou l’exportation de biens (en influençant les prix ou les quantités). Les motivations peuvent être d’ordre économique, sanitaire, environnementales ou sociales. En savoir plus dans l’Idée reçue Multilatéralisme et libre-échange iraient toujours de pair dans notre module Mondialisation et commerce international. ↩︎
- Maritime Transport: UNCTAD Releases New Statistics, April 2025. ↩︎
- Container ships (14% of the world fleet’s tonnage in 2024, compared with 2% in 1980); dry bulk carriers for iron ore and other metals, coal, grain, cement, sand, and fertilizers (43% of global fleet tonnage in 2024, compared to 27% in 1980) ; oil tankers (28% of the world fleet’s tonnage in 2024, compared to 50% in 1980). Source: Study on Maritime Transport 2024, UNCTAD (page 37 of the French summary). ↩︎
- TEU = Twenty-Foot Equivalent Unit: This is the unit of measurement for transported volumes. One TEU is equivalent to a container that is 20 feet long, 8 feet wide, and 8 feet high (or 33m³). ↩︎
- In terms of infrastructure and computer hardware, the sector includes giants such as Intel Corporation and NVIDIA Corporation for microprocessors, TSMC for semiconductor manufacturing, and Apple Inc. and Samsung Electronics for computers and phones. Digital services and software are dominated by Microsoft Corporation, Google LLC, and the Chinese companies Tencent and Alibaba Group. In the field of digital economy platforms, Amazon.com and Uber Technologies are major players on the international stage, along with the Chinese companies Didi Chuxing and Ant Group. ↩︎
- This relative stability does not mean that there have been no wars or economic crises at the local or regional level, but rather that these have not been significant enough to destabilize the international order. ↩︎
- See The Geopolitics of Straits, by Pauline Pic and Frédéric Lasserre, Editions du Cavalier Bleu, 2025, and Ormuz and the Others: The 14 Straits That Control Global Trade, by Jules Grandin, Les Echos, May 11, 2026. ↩︎
- Closure of the Red Sea to Maritime Shipping: Yet Another ESG Risk for Global Trade, Anne-Catherine Husson-Traore, Novethic (12/22/23); Red Sea Crisis on Wikipedia. ↩︎
- See the Wikipedia article on the 2021 Suez Canal blockage and Michaël Zerrouki Albertini, Suez Canal Blockage: Who Will Pay for the Damage?”, The Conversation (April 21, 2021). ↩︎
- Panama Canal: A Highly Sought-After Maritime Route, But One Threatened by Climate Change, Blandine Garot, Novethic (March 7, 2025). In fact, monumental projects are planned to adapt the canal to water shortages: “Inside the Panama Canal’s Mega-Project Plan to Engineer Its Way Through Severe Droughts of the Future,” Lori Ann LaRocco, CNBC (September 13, 2025). ↩︎
- See the analyses by OWN, an expert in cyber threat intelligence, and the France Cyber Maritime association: Observatory of Cyberconflicts and Maritime Theaters of Operations (2025), Overview of Maritime Cyber Threats (2023), Overview of Maritime Cyber Threats (2022). ↩︎
- “France’s Loss of Economic Sovereignty,” by Alexandre Mirlicourtois, XerfiCanal (April 27, 2020). ↩︎
- Why Is France Facing a Shortage of Medicines? Justin Delépine, Alternatives Economiques (December 21, 2022). See also the book by Baptiste Poterszman (member and contributor to The Other Economy) and Hugo Pouzet: Medications: What Causes the Shortages?, Presse des Mines, 2026. ↩︎
- See the Wikipedia article ” 2020–2023 Electronics Component Shortage.” ↩︎
- “French Agricultural Productivism: The Enemy of Our Food Sovereignty,” by Matthieu Jublin, Alternatives Economiques (February 27, 2025). ↩︎
- Facing Uncertainty: The Great Comeback of Vertical Integration, Philippe Silberzahn, Elucidations, 2025. ↩︎
- Source: UNCTAD Database, Merchandise Trade Matrix. ↩︎
- See Did Trump Drive Modi into Xi Jinping’s Arms? Understanding the Sino-Indian Rapprochement, Christophe Jaffrelot, Le Grand Continent, 2025. ↩︎
- Harsh V. Pant and Kalpit A. Mankikar, The Fatal Flaw in India’s China Strategy: Economic Dependence Will Make New Delhi Forever Vulnerable to Beijing , Foreign Affairs, Nov. 14, 24. ↩︎
- Éric Monnet, Changes in the International Monetary System, in The Global Economy 2024, Editions La Découverte, 2023. ↩︎
- Le taux de change est le prix d’une monnaie par rapport à une autre. Pour en savoir plus, voir la partie Qu’est ce que le taux de change et comment impacte-t-il l’économie ? dans notre module Mondialisation et commerce international. ↩︎
- La balance des transactions courantes (ou balance courante ou compte des transactions courantes) dresse le solde des échanges entre les résidents d’un pays et le reste du monde dans 4 domaines : 1/ les échanges de biens (balance commerciale), 2/ les échanges de services. 3/ les revenus primaires, c’est-à-dire les rémunérations perçues et versées en contrepartie des contributions transfrontalières à la production en travail (salaires des travailleurs frontaliers ) et en capital (flux de dividendes et d’intérêts), 4/ les revenus secondaires c’est-à-dire les transferts courants entre résidents et non‐résidents (ex : en France, les versements de la France aux institutions européennes ou internationales, et les envois de fonds des travailleurs immigrés vers leur pays d’origine). Ce document de comptabilité nationale est inclus dans la balance des paiements. En savoir plus dans l’encadré sur la balance des paiements de notre module Dette et déficits publics. ↩︎
- See the United Nations website, which lists currencies that are legal tender. Note that some currencies are used in multiple countries. This is particularly true of the dollar, which is used in 13 other countries and territories (Ecuador, El Salvador, the British Virgin Islands), and the euro, which, in addition to the 20 countries in the eurozone, is also the currency of several other countries and territories ( Andorra, Vatican City, French Guiana, etc.) ↩︎
- Les réserves de change d’un pays sont les avoirs en devises, en or et en DTS (Droits de tirage spéciaux) détenus par la Banque centrale d’un État. En savoir plus, dans l’Essentiel sur le système monétaire international de notre module Mondialisation et commerce international. ↩︎
- Le marché des changes est le marché sur lequel les devises peuvent être achetées ou vendues. En anglais Forex Market ou FX market. En savoir plus dans l’Essentiel sur le système monétaire international dans notre module Mondialisation et commerce international. ↩︎
- See a detailed list in the article “Basics of International Payments: Definition and How They Work” on the stripe.fr website. ↩︎
- “SWIFT (Society for Worldwide Interbank Financial Telecommunication) is a cooperative that provides secure messaging services used by more than 11,000 financial institutions in over 200 countries. SWIFT acts as an intermediary that does not transfer funds itself, but sends payment orders that are settled through the accounts that institutions maintain with one another for this purpose. SWIFT is used to carry out various types of international transactions, including money transfers, issuing letters of credit, and processing securities transactions. ” Source: Basics of International Payments: Definition and How They Work, on the stripe.fr website. ↩︎
- For example, in September 2025, the euro’s share of international payments drops from 22.77% to 13.25% if payments within the eurozone are excluded. In terms of IT infrastructure and hardware, the sector includes giants such as Intel Corporation and NVIDIA Corporation for microprocessors, TSMC for semiconductor manufacturing, and Apple Inc. and Samsung Electronics for computers and phones. Digital services and software are dominated by Microsoft Corporation, Google LLC, as well as the Chinese companies Tencent and Alibaba Group. In the field of digital economy platforms, we find Amazon.com and Uber Technologies on an international scale, as well as the Chinese companies Didi Chu Xing and Ant Group. Source: RMB Tracker, October 2025, SWIFT. ↩︎
- In reality, the process is more complex: it may involve several financial institutions as well as a payment system. See the article “Basics of International Payments: Definition and How They Work” on the stripe.fr website. ↩︎
- Le taux de change est le prix d’une monnaie par rapport à une autre. Pour en savoir plus, voir la partie Qu’est ce que le taux de change et comment impacte-t-il l’économie ? dans notre module Mondialisation et commerce international. ↩︎
- For example, in 2019, imports by French companies from Switzerland or Turkey were mostly invoiced in euros (approximately 70% and 90%, respectively). In contrast, imports from the United States and China were primarily invoiced in dollars (more than 80% and approximately 70%, respectively). See “The Pass-Through of Exchange Rate Changes to Import Prices in France: The Role of Invoicing Currencies,” Bulletin de la Banque de France (2022). ↩︎
- There is no official list of convertible currencies. See, for example, the list on the b2bpay.co website. ↩︎
- First, let’s clarify that the term “capital” is not limited here to investments in a company’s equity but encompasses all financing instruments, including bonds and bank loans. For more information, see our article on the different meanings of the word “capital.” ↩︎
- La balance des transactions courantes (ou balance courante ou compte des transactions courantes) dresse le solde des échanges entre les résidents d’un pays et le reste du monde dans 4 domaines : 1/ les échanges de biens (balance commerciale), 2/ les échanges de services. 3/ les revenus primaires, c’est-à-dire les rémunérations perçues et versées en contrepartie des contributions transfrontalières à la production en travail (salaires des travailleurs frontaliers ) et en capital (flux de dividendes et d’intérêts), 4/ les revenus secondaires c’est-à-dire les transferts courants entre résidents et non‐résidents (ex : en France, les versements de la France aux institutions européennes ou internationales, et les envois de fonds des travailleurs immigrés vers leur pays d’origine). Ce document de comptabilité nationale est inclus dans la balance des paiements. En savoir plus dans l’encadré sur la balance des paiements de notre module Dette et déficits publics. ↩︎
- EUR/USD reference rate displayed on the ECB’s website (accessed on 05/06/26). ↩︎
- La balance des transactions courantes (ou balance courante ou compte des transactions courantes) dresse le solde des échanges entre les résidents d’un pays et le reste du monde dans 4 domaines : 1/ les échanges de biens (balance commerciale), 2/ les échanges de services. 3/ les revenus primaires, c’est-à-dire les rémunérations perçues et versées en contrepartie des contributions transfrontalières à la production en travail (salaires des travailleurs frontaliers ) et en capital (flux de dividendes et d’intérêts), 4/ les revenus secondaires c’est-à-dire les transferts courants entre résidents et non‐résidents (ex : en France, les versements de la France aux institutions européennes ou internationales, et les envois de fonds des travailleurs immigrés vers leur pays d’origine). Ce document de comptabilité nationale est inclus dans la balance des paiements. En savoir plus dans l’encadré sur la balance des paiements de notre module Dette et déficits publics. ↩︎
- The eurozone has a floating exchange rate regime with other countries. The single currency used by the eurozone countries effectively establishes a fixed exchange rate regime among those countries. ↩︎
- The Exchange Rate Mechanism (ERM II) was established between the Eurosystem (the ECB and the national central banks of the euro area) and the central banks of Denmark and Bulgaria. Check the ECB’s website for the central rates of the Danish krone and the Bulgarian lev against the euro. ↩︎
- “Monetary cooperation between Africa and France involves France, two monetary unions (UEMOA and CEMAC, comprising 8 and 6 African countries, respectively), and the Union of the Comoros.” Learn more on the Banque de France’s website. ↩︎
- In principle, the exchange rate is fixed, but the reference rate is adjusted regularly based on predetermined parameters or on a more discretionary basis. ↩︎
- Exchange rates are floating, but central banks regularly intervene in the markets to limit fluctuations relative to a specific currency or a basket of currencies. ↩︎
- La balance des transactions courantes (ou balance courante ou compte des transactions courantes) dresse le solde des échanges entre les résidents d’un pays et le reste du monde dans 4 domaines : 1/ les échanges de biens (balance commerciale), 2/ les échanges de services. 3/ les revenus primaires, c’est-à-dire les rémunérations perçues et versées en contrepartie des contributions transfrontalières à la production en travail (salaires des travailleurs frontaliers ) et en capital (flux de dividendes et d’intérêts), 4/ les revenus secondaires c’est-à-dire les transferts courants entre résidents et non‐résidents (ex : en France, les versements de la France aux institutions européennes ou internationales, et les envois de fonds des travailleurs immigrés vers leur pays d’origine). Ce document de comptabilité nationale est inclus dans la balance des paiements. En savoir plus dans l’encadré sur la balance des paiements de notre module Dette et déficits publics. ↩︎
- ↩︎
- La couverture de change consiste à se prémunir contre les variations du taux de change (c’est-à-dire les variations du prix de la monnaie par rapport aux autres). En savoir plus sur la page La couverture des risques de change sur le site compta-online. ↩︎
- As a reminder, annual global exports of goods and services total 32,000 billion dollars. These figures clearly illustrate the disconnect between trade in the real economy and foreign exchange transactions. ↩︎
- “Net-net” figures are adjusted to account for double-counting among brokers, both locally and across borders. ↩︎
- It also includes the balance of cross-border income (wages of cross-border workers, dividend and interest flows with the rest of the world) and current transfers between residents and nonresidents (payments to European or international institutions, remittances from immigrant workers to their countries of origin). The exchange rate also affects these balances. ↩︎
- This view is based on strong assumptions: perfect price and wage flexibility, competitive markets, and the absence of rigidities. Economist Jagdish Bhagwati advocated for less intervention in foreign exchange markets. He argued that flexible exchange rates facilitate external adjustment in response to economic shocks. Mundell contributed to the idea that, under a floating exchange rate regime, external adjustments are facilitated by the exchange rate. His model shows that, under a floating exchange rate regime with perfect capital mobility, monetary policy can be effective in stabilizing the economy. ↩︎
- Milton Friedman was a staunch advocate of floating exchange rates. See “The Case for Flexible Exchange Rates”, Essays in Positive Economics, 1953. ↩︎
- Trade and Development Report 2015, p. 67. ↩︎
- This phenomenon is determined by the sum of the price elasticities of imports and exports, known as the Marshall-Lerner condition. See this explanation by Jacques Adda in Alternatives Économiques (June 1, 1996): The Ins and Outs of the J-Curve. ↩︎
- See our article on the different meanings of the term “capital”. ↩︎
- ↩︎
- See the 2015 Trade and Development Report, UNCTAD, Chapter 3. ↩︎
- See the 2015 Trade and Development Report, UNCTAD, Chapter 2. ↩︎
- Suman S. Basu, Emine Boz, Gita Gopinath, Francisco Roch, Filiz D. Unsal. A Conceptual Model for the Integrated Policy Framework, International Monetary Fund, 2020. ↩︎
- Eric Monnet, Changes in the International Monetary System, in The Global Economy 2024, La Découverte, 2023. ↩︎
- Thomas Carré, Zilan Huang, Florian Surre, Developments in China’s Financial Markets, Trésor Eco No. 319, 2022.
↩︎ - “Le taux directeur est le taux d’intérêt fixé par une banque centrale pour les prêts qu’elle accorde aux banques commerciales qui en ont besoin. Il influence le taux d’intérêt auquel les banques commerciales prêtent à leur tour à leurs clients, notamment les ménages et les entreprises“. Les banques centrales utilisent en général plusieurs taux directeurs (la BCE en utilise trois) selon la durée des prêts accordés. Source : fiche pédagogique de la Banque de France sur les taux directeurs. En savoir plus sur la politique monétaire dans notre module sur la monnaie et avec notre fiche Dynamique des taux d’intérêt. ↩︎
- See Nusrate Aziz, “Why Does Uncovered Interest Parity Fail Empirically?,” International Review of Financial Analysis, 2024; Eugene F. Fama, “Forward and Spot Exchange Rates,” Journal of Monetary Economics, 1984; Charles Engel, “A Model of Foreign Exchange Rate Indetermination,” Working Paper, University of Washington, 1996, which show that currencies of countries with high interest rates paradoxically tend to appreciate rather than depreciate as expected—a paradox known as the “forward premium puzzle.” ↩︎
- The carry trade involves borrowing in a currency with a low interest rate and investing those borrowed funds in another currency with a higher interest rate, thereby capitalizing on the interest rate differential between two countries—and thus between two currencies. ↩︎
- The UIP theory is based on “standard” assumptions in neoclassical economics that have not been verified in practice: no restrictions on capital flows between countries; efficient financial markets (in the sense that they reflect all available information); rational expectations regarding future exchange rates and interest rates; and the absence of risk premiums. In reality, investors demand a risk premium to invest in risky currencies; this premium is embedded in the interest rate differential but not directly observable, which decouples interest rates from anticipated exchange rate movements. ↩︎
- This is not the case with the money supply in domestic currency, which cannot be used to purchase goods and services abroad—with the exception of the dollar, which, at this point, is a universal currency. ↩︎
- See data from the World Gold Council— Gold Reserves by Country. Data from Q3 2025. ↩︎
- Source: ECB Data Portal – “Balance of Payments and Other External Statistics ” series – reserve assets (Q3 2025 data). ↩︎
- The Bank of China does not interact directly with these entities but rather with the banks where they hold their accounts. ↩︎
- See, for example, The Issue of Exchange Rates Is the Blind Spot in the G7 Negotiations on Global Imbalances, an interview with Shahin Vallée and Brad Setser in Le Grand Continent (February 15, 2026). ↩︎
- See, in particular, Rafaël Cezar and Éric Monnet, Capital Controls and Foreign Reserves Against External Shocks: Combined or Alone?, Banque de France, 2021. ↩︎
- In the wake of the 2007–2008 crisis, many countries implemented “accommodative” monetary policies, characterized first by a reduction in key interest rates and then by the introduction of quantitative easing. ↩︎
- Example taken from Éric Monnet, Changes in the International Monetary System, in The Global Economy 2024, Editions La Découverte, 2023. ↩︎
- MISSING NOTE: consensus-washington ↩︎
- See Éric Monnet, Changes in the International Monetary System, in The Global Economy 2024, Editions La Découverte, 2023. ↩︎
- See, for example, The Beginnings of Globalization… 4,000 Years Ago, National Geographic, (March 10, 2021). ↩︎
- The predominant practice at that time was coastal shipping, that is, sailing from one port to another without ever losing sight of land. ↩︎
- On the European side, examples include: the Mediterranean Sea, known as “Mare Nostrum” by the Romans, and the Adriatic Sea for the Republic of Venice. ↩︎
- New instruments (compass, astrolabe, quadrant) made it possible to navigate on the open sea. With the invention of a new type of ship, the caravel, it became possible to sail against the wind. ↩︎
- Examples: the circumnavigation of the Cape of Good Hope in 1488, Christopher Columbus’s crossing of the Atlantic (1492), and the first circumnavigation of the globe, begun by Ferdinand Magellan and completed by Juan Sebastián Elcano in 1522. ↩︎
- Shipwrecks, piracy, the captain’s disappearance along with the cargo. ↩︎
- The East India Company. ↩︎
- The Dutch East India Company. ↩︎
- In a corporation, the company’s capital is owned by shareholders and represented by a security that can be bought or sold. Shareholders’ liability is limited to their capital contribution. This distinguishes it from a partnership—the most common legal form at the time—which is formed intuitu personae (that is, in a manner tied to the individuals), by partners who hold partnership interests representing their capital contributions but cannot transfer them (or can do so only under very restrictive conditions). Furthermore, they are jointly and severally liable, with unlimited liability, for losses and debts. ↩︎
- See Violaine Faubert, “What Lessons Can We Learn from the First Wave of Globalization (1870–1914)?” Économie & prévision, 2012, and Suzanne Berger, “Our First Wave of Globalization: Lessons from a Forgotten Failure”, Seuil, 2003. ↩︎
- Le taux de change est le prix d’une monnaie par rapport à une autre. Pour en savoir plus, voir la partie Qu’est ce que le taux de change et comment impacte-t-il l’économie ? dans notre module Mondialisation et commerce international. ↩︎
- In the United Kingdom, the Joint Stock Companies Act of 1844 broadened access to the formation of joint-stock companies, which had previously been possible only by royal charter or special act. In 1855, the Limited Liability Act introduced limited liability for shareholders. In France, the limited liability corporation (société anonyme à responsabilité limitée) was first mentioned in the Commercial Code in 1807 but remained subject to administrative authorization. It was the 1867 Law on Commercial Companies that authorized their free formation. ↩︎
- See, in particular, Essential 1 and Essential 3 in this module. ↩︎
- Olivier Descamps, Romuald Szramkiewicz, History of Business Law, La Librairie Juridique, 2024 (4th edition). ↩︎
- The 1609 publication of the work Mare Liberum by the Dutch jurist Hugo Grotius marked a significant milestone in the debate over the legal status of the high seas. ↩︎
- The 1958 Geneva Convention (which comprises four conventions that entered into force between 1962 and 1966), the United Nations Convention on the Law of the Sea (signed in 1982, entered into force in 1994), the United Nations Treaty on the High Seas or Treaty on Biodiversity Beyond National Jurisdiction (signed in 2023, entered into force in 2026). Learn more on the UN website. ↩︎
- Originally limited to 3 nautical miles (1 nautical mile equals 1.852 km) from the shore, the coastal zone over which a state exercises sovereignty has been gradually expanded. Known as territorial waters, this zone now extends to 12 nautical miles. It is supplemented by a contiguous zone of 12 miles over which the coastal state exercises certain powers. Finally, in the exclusive economic zone (200 miles from the shore), the coastal state exercises economic sovereignty: it may explore and exploit the seabed and its subsoil, regulate fishing, exploit living natural resources, and so on. For more details, see the Wikipedia page on the Law of the Sea. ↩︎
- The right to navigate and exploit economic resources, the duty to protect the marine environment, the duty to provide assistance… ↩︎
- “Originally, the only subjects [of public international law] were states, but the proliferation of international organizations during the 20th century has gradually led to them being regarded as subjects (known as ‘derivative subjects’).” See the Wikipedia page on public international law. ↩︎
- Guillaume Vuillemey, The Age of Deglobalisation, Seuil, 2022 (p. 67). ↩︎
- An oil spill is “a discharge into the sea of a significant quantity of crude oil or heavy petroleum products, forming a slick that is driven by the winds toward the coast” (Larousse). The term was coined by a French journalist following the sinking of the Torrey Canyon (March 18, 1967), a Liberian-flagged oil tanker owned by a subsidiary of the Union Oil Company of California. According to statistics from the ITOPF (International Tanker Owners Pollution Federation), nearly 800 oil spills occurred in the 1970s, two-thirds of which were large-scale (> 700 metric tons). ↩︎
- The International Convention on Civil Liability for Oil Pollution Damage was adopted in 1969 (and entered into force in 1975). ↩︎
- Merchant Fleet by Flag and Ship Type, UNCTAD Database. For 2025, we use the list of flags of convenience published by the International Seafarers’ Federation. ↩︎
- See the Niger Delta page on the UNPO (Unrepresented Nations & Peoples Organization) website. ↩︎
- Jemima O’Farrell et al., “Quantifying the Impact of Crude Oil Spills on the Mangrove Ecosystem in the Niger Delta Using AI and Earth Observation,” Remote Sens, 2025. ↩︎
- Faithwin Gbadamosi, Jared Aldstadt, “The Interplay of Oil Exploitation, Environmental Degradation, and Health in the Niger Delta: A Scoping Review,” Trop Med Int Health, 2025. ↩︎
- See, for example , “Oilwatch Demands Cleanup and Restoration as UN Decries Niger Delta Divestment,” Environews Nigeria (September 19, 2025). ↩︎
- See, for example , “Nigeria: Internal Documents Show Shell Ignored Its Own Pollution Alerts,” Agence Ecofin (June 4, 2026). ↩︎
- Verônica Garcia Donoso, Land Use Change in the Amazon Region: What Is Driving Deforestation?, in Rethinking Amazonian Cities in the State of Rondônia, The Latin American Studies Book Series, Springer, 2026. ↩︎
- Bolivia, Brazil, Colombia, Ecuador, French Guiana, Guyana, Peru, Suriname, and Venezuela. ↩︎
- MAAP #235: AI-powered real-time detection of deforestation caused by gold mining in the Amazon, Monitoring of the Andes Amazon Program (November 13, 2025). ↩︎
- See, for example , François Bost , “Free Trade Zones: Interfaces of Globalization,” Annales de géographie, 2007; Kenji Omi, “Extraterritoriality” of Free Zones: The Need for Strengthened Customs Enforcement, World Customs Organization, 2019; World Investment Report 2019—Special Economic Zones, UNCTAD. ↩︎
- Michel Engman, Osamu Onodera, Enrico Pinali, Export Processing Zones: Their Past and Future Role in Trade and Development, OECD, 2007. ↩︎
- Douglas Zhihua, Global Experiences with Special Economic Zones: Focus on China and Africa, World Bank, 2015. ↩︎
- See here for a list of free zones in the United Arab Emirates. ↩︎
- See Dubai Eases Business Regulations for Free Zone Companies, on the website of the expatriate consulting firm Magellan (June 16, 2025). ↩︎
- MISSING NOTE: limites-planetaires ↩︎
- Gabriel Santos Carneiro, Guilherme Magacho, Etienne Espagne, Leveraging International Trade for the Ecological Transition: Quantifying the Drivers of Planetary Boundaries, Ecological Economics, 2026 (working paper available for download on the AFD website). ↩︎
- See, for example: Manfred Lenzen et al., “International Trade Drives Biodiversity Threats in Developing Nations, ” Nature, 2012; CO2 Emissions Embodied in International Trade, Bulletin de la Banque de France, 2020; Andrew K. Jorgenson, Environment, Development, and Ecologically Unequal Exchange, Sustainability, 2016. ↩︎
- Une chaîne de valeur mondiale (CVM) comprend l’ensemble des activités interdépendantes réalisées à travers le monde par différentes entreprises pour mener un produit de sa conception à son utilisation finale (voire à sa fin de vie). Elles impliquent un très fort niveau de coordination entre les acteurs. À la tête des CVM se trouvent des multinationales, dont dépendent de fait les autres acteurs de la chaîne. En savoir plus dans l’Essentiel sur les CVM dans notre module Mondialisation et commerce international. ↩︎
- MISSING NOTE: tonne-equivalent-co2 ↩︎
- And 23% of energy-relatedCO2 emissions. ↩︎
- This accounts for 16% of transportation emissions. It should be noted that the global warming potential of contrails (which varies greatly depending on the circumstances) is not included in these estimates of aviation’s contribution to global warming. ↩︎
- Global CO2 emissions from trucks and buses in the Net Zero Scenario, 2000–2030, IEA 2023. ↩︎
- Carbon intensity represents emissions relative to a specific measure (per unit of GDP, per capita, or per t.km—that is, per metric ton of cargo transported over 1 km). The carbon intensity of the maritime sector is less than 10 gCO2e/t-km, while that of the aviation sector is greater than 1,000 gCO2e/t-km. ↩︎
- Lead, mercury, arsenic, cadmium, nickel, vanadium, chromium… ↩︎
- Heavy Fuel Oil: The Impure Blood of Globalisation, Sylvain Besson, Le Temps, October 2016. ↩︎
- Degassing is the process of removing residual gases from fuel tanks or crude oil tanks after the tanks have been emptied. The International Convention for the Prevention of Pollution from Ships (MARPOL), which entered into force in 1983, prohibits degassing on the high seas and requires treatment facilities in ports. ↩︎
- Ballast water is pumped into a ship’s tanks to keep it balanced when it is sailing without a cargo. Once it arrives at its destination, the ship discharges this water to load its cargo. This water often contains non-native marine organisms (bacteria, algae, mollusks) that can become invasive species when released into a new ecosystem. Examples of invasive species transported by ballast water: the Mnemiopsis leidyi jellyfish in the Black Sea (which has devastated local fisheries) and zebra mussels in the North American Great Lakes. ↩︎
- According to the World Shipping Council, an average of about 1,300 containers are estimated to have fallen overboard each year over the past decade. However, this is only a conservative estimate, given that very few such incidents are reported. See, for example , “Containers Lost at Sea: A Danger That Has Gone Under the Radar,” by Julien Bouissou and Marie-Béatrice Baudet, Le Monde (May 7, 2021). ↩︎
- International ports and airports, as well as roads and railways, for the portion related to international trade. ↩︎
- Proposal for a Directive Restructuring the Union Framework for the Taxation of Energy Products and Electricity (COM/2021/563 final). ↩︎
- Une entreprise fait des économies d’échelle quand les coûts de production d’une unité supplémentaire baissent à mesure que les volumes produits augmentent. Cette situation se rencontre dans les secteurs où les coûts fixes (et notamment les investissements initiaux) sont très élevés : à mesure que la production augmente, les coûts fixes par unité diminuent. C’est le cas dans la plupart des secteurs industriels, et plus encore du numérique (ex : logiciels, jeux vidéos etc.). Ce type de modèle économique implique d’avoir accès à des marchés de taille importante pour écouler la production. Voir l’encadré sur les économies d’échelle dans notre module Mondialisation et commerce international. ↩︎
- Le pouvoir de marché désigne la capacité d’un acteur économique à agir pour conserver sa position dominante. Cela peut être en jouant sur les prix ou en influençant les normes et les pouvoirs publics en sa faveur. En savoir plus dans l’Essentiel sur les multinationales dans notre module Mondialisation et commerce international. ↩︎
- Florence Pendrill et al., Disentangling the Numbers Behind Agriculture-Driven Tropical Deforestation, Science, 2022. ↩︎
- In other words, deforested land is, in fact, productive agricultural land in the years that follow. The rest of the deforested areas are primarily related to agriculture but are not converted into cropland or pasture in the year following deforestation. ↩︎
- David L.A. Gaveau et al., Slowing deforestation in Indonesia follows declining oil palm expansion and lower oil prices.PLoS ONE, 2022. ↩︎
- See, for example , “Saving the Cerrado: Supermarkets, Bunge, and Governments Must Act Now,” Mighty Earth, 2023. ↩︎
- Financial Speculation and the Mortgaging of the Amazon, Pierre-Louis Choquet, AOC, June 18, 2025. ↩︎
- Shefali Sharma, “The Great Climate Greenwash: Global Meat Giant JBS’s Emissions Jump 51% in Five Years,” Institute for Agriculture & Trade Policy, 2022. ↩︎
- See, for example, the Wikipedia website for a chronological list and a list organized by industry type. ↩︎
- China, the United States, Russia, France, and the United Kingdom. ↩︎
- Relations with the UN are governed by negotiated agreements. Some of these agreements predated the establishment of the United Nations. ↩︎
- UNEP’s revenue in 2024 totaled less than $800 million. It comes almost exclusively from voluntary contributions from member states, other UN agencies, or private actors (foundations, NGOs, financial institutions). Source: UNEP 2024 Annual Report. ↩︎
- See the complete list of specialized agencies on the UN website. ↩︎
- While the Food and Agriculture Organization of the United Nations (FAO) is increasingly incorporating environmental issues into its work (nearly 15% of its 2024–2025 budget), the involvement of the International Maritime Organization or the International Civil Aviation Organization is driven more by the defense of sectoral interests than by a genuine consideration of these issues. ↩︎
- See Sylvestre-José-Tidiane Manga, “The World Environment Organization: How Can It Rise from the Ashes of the December 2009 Copenhagen Climate Change Conference? ” Revue québécoise de droit international, 2009, and “A World Environment Organization: Finally Moving from Words to Action on Climate Change,” an op-ed by Benjamin Joyeux, Vandana Shiva, Philippe Lamberts, and Olivier de Schutter published in Libération (April 21, 2016). ↩︎
- The United Nations Secretariat is the depositary for more than 560 multilateral treaties covering a wide range of topics, such as human rights, disarmament, and environmental protection. See the UN treaty collection. ↩︎
- A multilateral treaty is concluded between at least three states. ↩︎
- HFCs are very potent greenhouse gases (GHGs). Unlike other GHGs, they do not occur naturally. These gases have, in fact, been manufactured by humans for use in certain economic activities (propellants, refrigerants, etc.). HFCs have gradually replaced CFCs, which were banned by the Montreal Protocol due to their destructive impact on the ozone layer. For more information, see the section on halocarbons in our article Counting Greenhouse Gas Emissions.” ↩︎
- Entré en vigueur début 2026, le mécanisme européen d’ajustement carbone aux frontières (MACF ; CBAM en anglais pour Carbon Border Adjustment Mechanism) consiste à taxer, dans les secteurs les plus émetteurs de gaz à effet de serre (acier, ciment, engrais, etc.), les importations de marchandises provenant de pays aux normes climatiques moins strictes que celles de l’Union européenne. En savoir plus sur le site de la Commission européenne. ↩︎
- Decision 1/CMA.7, Global Mutirão: Uniting Humanity in a Global Mobilization Against Climate Change, Belém, November 2025. ↩︎
- Read about the history of the legal battle surrounding the Global Environmental Pact and its aftermath on the dedicated website. ↩︎
- The value of the dollar was then set at 35 dollars per ounce of gold (1 ounce of gold = 28.3 g), which means that one gram of gold was worth 1.2 dollars. Today, one gram of gold is worth more than 100 dollars. ↩︎
- The World Bank Group consists of five institutions, including the IBRD; the International Development Association (IDA), founded in 1960; the International Finance Corporation (IFC), founded in 1956; the International Centre for Settlement of Investment Disputes (ICSID), founded in 1965; and the Multilateral Investment Guarantee Agency (MIGA), founded in 1988. ↩︎
- “The ‘Washington’ referred to in this article refers both to the political Washington—including Congress and senior administration officials—and to the technocratic Washington—including international financial institutions, U.S. government economic agencies, the Federal Reserve, and think tanks.” ” What Washington Means by Policy Reform,” John Williamson, 1990. ↩︎
- United Nations Development Program. ↩︎
- The three United Nations framework conventions adopted following the Second Earth Summit in 192 (on climate change, biological diversity, and combating desertification), the Stockholm Convention on Persistent Organic Pollutants (2001), the Minamata Convention on Mercury (2013), and the Agreement on the Conservation and Sustainable Use of Marine Biological Diversity of Areas Beyond National Jurisdiction (2023). ↩︎
- See, for example, the Climate Policy Initiative’s work on climate investment needs or the estimated investment needs for the green transition in the European Union. ↩︎
- The Trump administration views the IMF and World Bank’s climate commitments as a “departure” from their missions, Émilie Legendre, AEF info (04/30/25); Trump has brought the IMF to heel: behind the scenes at the Washington meetings, Shahin Vallée, Le Grand Continent (10/23/25). ↩︎
- La balance des paiements est un document de comptabilité nationale qui dresse chaque année le solde des échanges entre l’ensemble des agents économiques résidents d’un pays et le reste du monde. Il comprend en particulier la balance des biens et services (le solde des exportations et des importations) et permet de savoir si un pays est créditeur ou débiteur du reste du monde. En savoir plus dans l’encadré sur la balance des paiements de notre module Dette et déficits publics. ↩︎
- For more information on the GATT and the various rounds of negotiations, see the WTO’s website and Chapter 27 of History of Economic Events: From the Industrial Revolution to the Present Day, by Bernard Blancheton, Dunod, 2022 (latest edition). ↩︎
- One of the most well-known is the most-favored-nation clause. Each signatory state undertakes to grant to the other states any advantage it would grant to a third state. ↩︎
- A tariff concession refers to a commitment made by a country to reduce or limit its customs duties on certain imported goods. These concessions are included in a bound tariff, which is a list of the binding tariff commitments made by members. ↩︎
- Les barrières (ou “distorsions”) aux échanges commerciaux sont des mesures mises en place par un pays pour réguler ou restreindre l’importation et/ou l’exportation de biens et services. Les barrières tarifaires sont essentiellement les droits de douane. Les barrières non tarifaires sont des réglementations ou des restrictions administratives qui impactent l’importation ou l’exportation de biens (en influençant les prix ou les quantités). Les motivations peuvent être d’ordre économique, sanitaire, environnementales ou sociales. En savoir plus dans l’Idée reçue Multilatéralisme et libre-échange iraient toujours de pair dans notre module Mondialisation et commerce international. ↩︎
- The WTO agreements essentially consist of the following texts: the Framework Agreement establishing the WTO, the predecessor agreements governing the three major areas of trade (GATT for goods, GATS for services, and TRIPS for intellectual property), the dispute settlement mechanism, and the trade policy review mechanism. They also include plurilateral trade agreements that do not include all WTO members. ↩︎
- Le recours aux tribunaux d’arbitrage privé est souvent inclus dans les traités de commerce ou de protection des investissements. Ils ont pour objet de régler les différends entre États ou entre entreprises et États, sans avoir recours au droit d’un des États concernés ni au droit international. L’arbitrage privé est de plus en plus critiqué pour son manque de légitimité et de transparence d’autant plus quand il est utilisé pour attaquer des États ayant développé des politiques environnementales, sociales ou sanitaires que les entreprises considèrent comme nuisibles à leurs investissements. Pour en savoir plus sur certaines utilisations de l’arbitrage privé, voir notre fiche sur le Traité sur la Charte de l’Énergie. ↩︎
- La balance des transactions courantes (ou balance courante ou compte des transactions courantes) dresse le solde des échanges entre les résidents d’un pays et le reste du monde dans 4 domaines : 1/ les échanges de biens (balance commerciale), 2/ les échanges de services. 3/ les revenus primaires, c’est-à-dire les rémunérations perçues et versées en contrepartie des contributions transfrontalières à la production en travail (salaires des travailleurs frontaliers ) et en capital (flux de dividendes et d’intérêts), 4/ les revenus secondaires c’est-à-dire les transferts courants entre résidents et non‐résidents (ex : en France, les versements de la France aux institutions européennes ou internationales, et les envois de fonds des travailleurs immigrés vers leur pays d’origine). Ce document de comptabilité nationale est inclus dans la balance des paiements. En savoir plus dans l’encadré sur la balance des paiements de notre module Dette et déficits publics. ↩︎
- China’s economic opening is therefore not based on free trade, because—unlike the neoliberal “laissez-faire” prescriptions—it has not been accompanied by a withdrawal of the state or by the usual measures to reduce tariff and non-tariff barriers. ↩︎
- This is the case, for example, with Paul Krugman, who in his article The Myth of Asia’s Miracle, published in Foreign Affairs (1994), stated: “Asian growth, like that of the USSR during its period of rapid growth, appears to be the result of an extraordinary increase in factors of production such as labor and capital rather than efficiency gains.” ↩︎
- [global-value-chain-note] ↩︎
- China dominates the entire rare earth value chain: mining, refining, and cutting-edge technologies that use these minerals, such as magnets. By 2024, China will account for 60% of the mining and 90% of the refining of rare earths used to make magnets (which are essential, in particular, for wind turbines and electric car motors). See the Global Critical Minerals Outlook 2025, IEA 2025, and the Critical Minerals Data Explorer database. ↩︎
- Even though it is beginning to crumble due to Donald Trump’s erratic trade and military policies. ↩︎
- ↩︎
- See, for example , “The European Union Faces the Challenge of the Decoupling of Sino-American Value Chains,” Trésor-Éco Bulletin No. 308, published by the Directorate General of the Treasury, June 2022. ↩︎
- See the BRICS+ page (formerly BRIC, then BRICS) on the Géoconfluences website. ↩︎
- See the book by Jean Drèze and Amartya Sen, An Uncertain Glory: India and Its Contradictions, Princeton University Press, 2013, and Jayati Ghosh’s article India in the Changing Global Economy, in Economics, Volume 2: India and the International Economy, 2015. ↩︎
- Une chaîne de valeur mondiale (CVM) comprend l’ensemble des activités interdépendantes réalisées à travers le monde par différentes entreprises pour mener un produit de sa conception à son utilisation finale (voire à sa fin de vie). Elles impliquent un très fort niveau de coordination entre les acteurs. À la tête des CVM se trouvent des multinationales, dont dépendent de fait les autres acteurs de la chaîne. En savoir plus dans l’Essentiel sur les CVM dans notre module Mondialisation et commerce international. ↩︎
- 87.2% in 2025, according to the International Labor Organization (ILO). ↩︎
- See, for example, data from the World Inequality Database: the top 1% of the population holds 40% of the wealth, compared with 6.2% for the poorest half of the population. ↩︎
- Report by Valérie Crova and Fabien Gosset on FranceInfo: India: Inequality Greater “Than During the British Era,” “the Worst in the World” (April 18, 2024). ↩︎
- Werner Baer, Import Substitution and Industrialization in Latin America: Experiences and Interpretations, Latin American Research Review, 1972. See also the Preconceived Idea about protectionism. ↩︎
- MISSING NOTE: consensus-washington ↩︎
- See this article by Mylène Gaulard: “The Role of Early Deindustrialization in the Current Brazilian Crisis,” Outre-Terre, 2016. ↩︎
- See Blake C. Clayton, A Twenty-First-Century Supercycle? Long-Term Trends in Metal and Energy Prices , Commodity Markets and the Global Economy, 2015. ↩︎
- To combat drug trafficking, we must challenge certain tenets of free-market economics: an interview with Clotilde Champeyrache in Alternatives Économiques ( February 13, 2025). ↩︎
- See his book The Age of Deglobalization: Protecting the Commons from Free Trade , Seuil, 2022. ↩︎
- See his book Inequality in the World. The Economy of the Contemporary World , Gallimard, 1996 (reprinted in 2019) and this book review by Éric Keslassy: Pierre-Noël Giraud, L’inégalité du monde, Lectures, 2020. ↩︎
- MISSING NOTE: multinationales ↩︎
- [global-value-chain-note] ↩︎
- Une entreprise fait des économies d’échelle quand les coûts de production d’une unité supplémentaire baissent à mesure que les volumes produits augmentent. Cette situation se rencontre dans les secteurs où les coûts fixes (et notamment les investissements initiaux) sont très élevés : à mesure que la production augmente, les coûts fixes par unité diminuent. C’est le cas dans la plupart des secteurs industriels, et plus encore du numérique (ex : logiciels, jeux vidéos etc.). Ce type de modèle économique implique d’avoir accès à des marchés de taille importante pour écouler la production. Voir l’encadré sur les économies d’échelle dans notre module Mondialisation et commerce international. ↩︎
- Le terme Ultra High Net Worth (UHNW) est utilisé en finance et en gestion de patrimoine pour désigner les individus dont le patrimoine net est extrêmement élevé. Généralement, une personne est considérée comme UHNW si elle possède un patrimoine net de 30 millions de dollars ou plus. On peut en estimer le nombre aujourd’hui à environ 510 000 (source : World Ultra Wealth Report 2025). Ce tout petit groupe reste lui-même extrêmement hétérogène, une toute petite fraction concentrant bien plus de richesse et de pouvoir que le reste du groupe. ↩︎
- A nickname for an industrial region in the northeastern United States. ↩︎
- The China Shock: Learning from Labor Market Adjustment to Large Changes in Trade, National Bureau of Economic Research, 2016. ↩︎
- See the book by Anne Case and Angus Deaton on this subject, Deaths from Despair. The Future of Capitalism. PUF, 2021. ↩︎
- See “Income Inequality in Rich Countries in Light of the ‘Palma’,” Observatoire des inégalités, 2021, and the study by Moritz Kuhn and José-Víctor Ríos-Rull, “Income and Wealth Inequality in the United States: An Update Including the 2022 Wave.” NBER Working Paper, 2025. ↩︎
- See, for example, “The Growing Inequality in Life Expectancy Among Americans,” KFF Health News, 2025. ↩︎
- The World Bank has defined an international extreme poverty threshold. Since 2025, this threshold has been set at $3 per day per person at 2021 purchasing power parity (learn more about poverty indicators in our article How Is Poverty Measured?). For information on China, see Four Decades of Poverty Reduction in China, World Bank and Development Research Center of the State Council of China, 2022. ↩︎
- Le coefficient de Gini est un indicateur couramment utilisé pour quantifier les inégalités de revenus. Sa valeur est comprise entre 0 et 1 : une valeur de 0 correspond à une « égalité parfaite » (chaque ménage reçoit la même fraction des revenus) et une valeur de 1 représente une « inégalité parfaite » (la fraction de la population la plus riche reçoit l’intégralité des revenus). Pour en savoir plus, voir notre fiche Comment mesurer les inégalités monétaires ? ↩︎
- See this more detailed analysis: Persistent Inequalities, Moderate Redistribution, and Growing Financialization, by Yves Dimicoli, Revue Marxiste d’Économie, 2025. ↩︎
- See the Wikipedia page on Xinjiang Internment Camps, particularly the sections titled China cables (2019) and Xinjiang papers (2019). ↩︎
- To learn more about the thresholds used to define company size in European Union countries and in France, see our module on Corporations in the Anthropocene era. ↩︎
- OECD Outlook on SMEs and Entrepreneurship, 2023. ↩︎
- Raphael Auer, Kathrin Degen, Andreas M. Fischer, Low-Wage Import Competition, Inflationary Pressure, and Industry Dynamics in Europe, European Economic Review, 2013 (working paper available at ideas.repec.org). ↩︎
- See this seminal book by Daron Acemoglu and James Robinson Why Nations Fail: The Origins of Power, Prosperity, and Poverty, Flammarion, 2025 (French translation). The authors, along with their colleague Simon Johnson, were awarded the “Nobel Prize” in Economics in 2024 for their work on this very topic. See, for example: Nobel Prize in Economics: Why Are Some Nations Rich and Others Poor?, Thierry Verdier, The Conversation, 2024. ↩︎
- MISSING NOTE: multinationales ↩︎
- Une chaîne de valeur mondiale (CVM) comprend l’ensemble des activités interdépendantes réalisées à travers le monde par différentes entreprises pour mener un produit de sa conception à son utilisation finale (voire à sa fin de vie). Elles impliquent un très fort niveau de coordination entre les acteurs. À la tête des CVM se trouvent des multinationales, dont dépendent de fait les autres acteurs de la chaîne. En savoir plus dans l’Essentiel sur les CVM dans notre module Mondialisation et commerce international. ↩︎
- Contrary to what neoclassical theory asserts, returns are therefore increasing in a great many sectors: they rise as production volumes increase (provided, of course, that the output is sold). Learn more in our module on Markets, prices, and economic competition. ↩︎
- As shown in the chart, only contracts involving certain industries are included here. ↩︎
- NEM = non-equity mode = modes of international production without equity participation. ↩︎
- Le pouvoir de marché désigne la capacité d’un acteur économique à agir pour conserver sa position dominante. Cela peut être en jouant sur les prix ou en influençant les normes et les pouvoirs publics en sa faveur. En savoir plus dans l’Essentiel sur les multinationales dans notre module Mondialisation et commerce international. ↩︎
- That is, an analysis of the structure of links between multinational corporations, focusing on control (through full or partial ownership) of companies. See Stefania Vitali, James B. Glattfelder, and Stefano Battiston, “The Network of Global Corporate Control,” PLoS ONE, 2011. ↩︎
- Olivier Petitjean, Ivan du Roy (eds.) Multinational Corporations: A History of the Contemporary World, La Découverte, 2025. ↩︎
- Goodwill refers to the difference between the amount paid by an investor to acquire a company’s shares (that is, the market value in the case of a publicly traded company) and the company’s book equity. ↩︎
- See Intangible Asset Market Value Study, Ocean Tomo, 2021. See also The Value of Global Corporate Intangible Assets Rises to a Record $80,000 Billion in 2024, World Intellectual Property Organization (February 28, 2025), and Cap 40 Financial Profile—2023 Edition, E&Y. ↩︎
- These intangible assets, which are not recognized on the balance sheet, would, however, be correctly valued by the market, as their value is equal to the difference between the company’s reported tangible assets and its market capitalization. From this perspective, the speculative aspect of rising stock prices does not exist—a view that is, to say the least, debatable. ↩︎
- See, for example, German Gutiérrez and Thomas Philippon, “Declining Competition and Investment in the U. S.,” NBER, 2017; German Gutiérrez and Thomas Philippon, “How EU Markets Became More Competitive Than U.S. Markets: A Study of Institutional Drift,” NBER, 2018. ↩︎
- Since 1990, the number of Regional Trade Agreements (RTAs) in force (in the year in question) has increased more than eightfold, rising from 45 in 1990 to 376 in 2025. Source: WTO RTA database. ↩︎
- Trade and Development Report 2018, Box 2.2, UNCTAD. ↩︎
- See Amazon Confidential: An Investigation into the Secrets of Global Domination, by Dana Mattioli, Grasset, 2024. How Amazon Kills the Competition and Plunders Innovators, a video by Christine Kerdellant on XerfiCanal (October 17, 2024). ↩︎
- Particularly in the context of public-private partnerships (PPPs). See, for example, the “inflating” of prices by Alstom, Siemens, and others in connection with major infrastructure projects in Brazil (Brazil: Corruption Allegations Mount Against Alstom, Olivier Petitjean, Observatoire des Multinationales (February 10, 2014)) or the “African ports scandal” involving the Bolloré Group: Ports in Africa: Vincent Bolloré Soon to Face Trial, Carole Assignon, Deutsche Welle (March 20, 2026). ↩︎
- See the UNCTAD Trade and Development Report 2017 (Chapter VI.D.2). ↩︎
- The declaration refers to the right to grant “compulsory licenses” (authorizing a third party to produce a patented product or process without the patent holder’s consent), the right to determine what constitutes a national emergency, the right to establish its own IPR exhaustion regime (unlike a national exhaustion regime, an international exhaustion regime allows for parallel imports—that is, the purchase of patented products on a foreign market for resale on the domestic market). Exhaustion refers to the principle that once an item incorporating intellectual property rights is placed on the market in a given territory, it may subsequently be resold, transferred, or distributed without further authorization from the rights holder. ↩︎
- Quote from the WTO’s website. ↩︎
- For a detailed analysis, see Carlos M. Correa, “Mitigating the Regulatory Constraints Imposed by Intellectual Property Rules under Free Trade Agreements,” South Centre, Research Paper 74, 2017. ↩︎
- Les barrières (ou “distorsions”) aux échanges commerciaux sont des mesures mises en place par un pays pour réguler ou restreindre l’importation et/ou l’exportation de biens et services. Les barrières tarifaires sont essentiellement les droits de douane. Les barrières non tarifaires sont des réglementations ou des restrictions administratives qui impactent l’importation ou l’exportation de biens (en influençant les prix ou les quantités). Les motivations peuvent être d’ordre économique, sanitaire, environnementales ou sociales. En savoir plus dans l’Idée reçue Multilatéralisme et libre-échange iraient toujours de pair dans notre module Mondialisation et commerce international. ↩︎
- See UNCTAD’s 2017 Trade and Development Report, Chapter VI: Market Power and Inequality: The Revenge of the Rentiers. ↩︎
- This practice involves acquiring overlapping patents in order to cover a significant portion of economic activity, as well as potential downstream inventions. ↩︎
- This practice involves filing an excessive number of patents in order to hinder future research. ↩︎
- Michele Boldrin and David K. Levine, The Case Against Patents, The Journal of Economic Perspectives, 2013. Download the PDF of the working paper here. ↩︎
- See Suzanne Berger, Made in the World: The New Frontiers of the Global Economy, Seuil, 2006. ↩︎
- as Guillaume Vuillemey puts it (see Essential 8). ↩︎
- See Public Aid to Businesses: A Status Report, a summary of the report by the French Senate Commission of Inquiry on the Evaluation of Public Aid to Businesses, published on July 1st, 2025. ↩︎
- Olivier Petitjean, Ivan du Roy (eds.) Multinational Corporations: A History of the Contemporary World, La Découverte, 2025. ↩︎
- The University of Oxford estimated the production cost of the vaccine at about one euro, while it was sold for between 10 and 20 euros. ↩︎
- Source: Boursorama. ↩︎
- Olivier Petitjean, Ivan du Roy (eds.) Multinational Corporations: A History of the Contemporary World, La Découverte, 2025. ↩︎
- It applies to multinational companies headquartered in France that employ a total of at least 5,000 employees, and to those with more than 10,000 employees that are headquartered abroad. ↩︎
- Originally, the CS3D applied to all companies with more than 1,000 employees and global net revenue exceeding 450 million euros. These thresholds have been raised to 5,000 employees and 1.5 billion in revenue. ↩︎
- Aujourd’hui, dans les sociétés par action, c’est-à-dire dont le capital est détenu par des actionnaires, la responsabilité de ces derniers est limitée à leur apport en capitaux. Ils ne peuvent être tenus financièrement responsables de ses dettes ou de ses impacts sociaux ou environnementaux. Ce principe de responsabilité limitée n’a pas toujours été la norme : il a émergé avec la création des Compagnies des Indes au XVIIe siècle et s’est généralisé à partir de la seconde moitié du XIXe siècle. En savoir plus dans l’Essentiel 5 de notre module Mondialisation et commerce international et dans l’Idée Reçue 4 du module sur l’Entreprise à l’ère de l’Anthropocène. ↩︎
- beyond their capital investment. ↩︎
- Olivier Petitjean, Ivan du Roy (eds.) Multinational Corporations: A History of the Contemporary World, La Découverte, 2025. ↩︎
- Yes, but at what social and environmental “cost”? To better understand the concept of cost, see our article Definition of the concept of cost in economics. ↩︎
- Une entreprise fait des économies d’échelle quand les coûts de production d’une unité supplémentaire baissent à mesure que les volumes produits augmentent. Cette situation se rencontre dans les secteurs où les coûts fixes (et notamment les investissements initiaux) sont très élevés : à mesure que la production augmente, les coûts fixes par unité diminuent. C’est le cas dans la plupart des secteurs industriels, et plus encore du numérique (ex : logiciels, jeux vidéos etc.). Ce type de modèle économique implique d’avoir accès à des marchés de taille importante pour écouler la production. Voir l’encadré sur les économies d’échelle dans notre module Mondialisation et commerce international. ↩︎
- See Mark Cartwright, Trade in Medieval Europe, World History Encyclopedia, 2021. ↩︎
- It should be noted that the Industrial Revolution relied on European energy resources (coal and water for hydropower) and did not create a need for energy imports, unlike the current situation in Europe. ↩︎
- Ignored by “Say’s Law,” formulated in the early 19th century by Jean-Baptiste Say, which states that every product necessarily finds a market because it has generated purchasing power equal to its production. This law is simply false, both theoretically and empirically, as we explain in our article Putting an End to Say’s Law or the Law of Markets. ↩︎
- Pierre Volle, Marketing: Understanding Its Historical Origins, Eyrolles. MBA in Marketing, Editions d’Organisation, 2011. ↩︎
- From the rule of the East India Company (1600–1858) through direct administration under the British Crown (1858–1947), various types of goods were exported to England. The main ones were: textiles (particularly cotton fabrics and jute), indigo, spices, and foodstuffs—especially tea and wheat—as well as precious stones and jewelry, precious woods, and handicrafts. Furthermore, opium cultivation was encouraged in Ceylon (now Sri Lanka) and later in India, with the opium subsequently exported to the rest of the British Empire and to China. See, for example, François Crouzet, Commerce and Empire: The British Experience of Free Trade until World War I, Annales. Economies, Societies, Civilizations, 1964. ↩︎
- La balance des paiements est un document de comptabilité nationale qui dresse chaque année le solde des échanges entre l’ensemble des agents économiques résidents d’un pays et le reste du monde. Il comprend en particulier la balance des biens et services (le solde des exportations et des importations) et permet de savoir si un pays est créditeur ou débiteur du reste du monde. En savoir plus dans l’encadré sur la balance des paiements de notre module Dette et déficits publics. ↩︎
- La balance des transactions courantes (ou balance courante ou compte des transactions courantes) dresse le solde des échanges entre les résidents d’un pays et le reste du monde dans 4 domaines : 1/ les échanges de biens (balance commerciale), 2/ les échanges de services. 3/ les revenus primaires, c’est-à-dire les rémunérations perçues et versées en contrepartie des contributions transfrontalières à la production en travail (salaires des travailleurs frontaliers ) et en capital (flux de dividendes et d’intérêts), 4/ les revenus secondaires c’est-à-dire les transferts courants entre résidents et non‐résidents (ex : en France, les versements de la France aux institutions européennes ou internationales, et les envois de fonds des travailleurs immigrés vers leur pays d’origine). Ce document de comptabilité nationale est inclus dans la balance des paiements. En savoir plus dans l’encadré sur la balance des paiements de notre module Dette et déficits publics. ↩︎
- See, for example, “Restrictions on Rare Earth Exports and Tariffs: Understanding the Escalation Between China and the United States,” Le Grand Continent (10/12/25). ↩︎
- See, for example, Toward perpetual peace? Yes, with Kant! , an article by Franck Olivar on the Radio France website (November 27, 2020). ↩︎
- Kant, Toward Perpetual Peace, 1795, Article 6, Section II. ↩︎
- See, for example: Erik Gartzke, The Capitalist Peace, American Journal of Political Science, 2007, and John R. Oneal and Bruce Russett, The Kantian Peace: The Pacific Benefits of Democracy, Interdependence, and International Organizations, 1885–1992, World Politics, 1999. ↩︎
- See the Treaties between France and Prussia and the States of the Zollverein of August 2, 1862. The Zollverein was a customs union founded in 1834 by several German states (the Kingdom of Prussia, the Landgraviate of Hesse-Kassel, the Kingdom of Bavaria, the Kingdom of Württemberg, the Kingdom of Saxony, and all the states comprising Thuringia). At its peak, it included up to 25 German states. ↩︎
- Lenin (in his book Imperialism, the Highest Stage of Capitalism, 1916) and certain historians have interpreted World War I as the culmination of economic and imperial rivalries among major industrial powers. According to Fritz Fischer (Germany’s Aims in the First World War, W.W. Norton, 1967), the war reflected Germany’s desire to consolidate a dominant position in Europe and gain access to additional resources, markets, and spheres of influence, against a backdrop of intensified industrial competition with the United Kingdom and France. Contemporary research emphasizes that these economic factors were intertwined with broader political, diplomatic, and military dynamics, such that the war cannot be reduced to a mere struggle for access to resources or markets (Christopher Clark, The Sleepwalkers: Summer 1914—How Europe Marched Toward War , Flammarion, 2013, and Margaret MacMillan, The War That Ended Peace: The Road to 1914, Random House, 2013; Andrew Feinstein, The Shadow World: Inside the Global Arms Trade, McMillan, 2011). ↩︎
- See, among many other examples, this episode of France Culture’s Le Fil de l’Histoire on the Voulet and Chanoine mission to Niger: Colonial Massacres That Are Constantly Forgotten,”France Culture (March 6, 2026). ↩︎
- See Catherine Coquery-Vidrovitch’s book, Sub-Saharan Africa: Continuities and Discontinuities , Payot, 1993. ↩︎
- See Samir Amin’s book, West Africa at a Standstill: The Political Economy of Colonization, 1880–1970 , Les éditions de Minuit, 1971. ↩︎
- MISSING NOTE: consensus-washington ↩︎
- See the note The Washington Consensus stands the test of time better than populist policies by economist Douglas Irwin for the Peterson Institute for International Economics (December 4, 2020). ↩︎
- Kwamina Ewur Banson, Gobinath Muthusamy, Ebenezer Kondo, “The Import-Substituted Poultry Industry: Evidence from Ghana,” International Journal of Agriculture and Forestry. 2015. ↩︎
- IMF Survey: IMF Plans Additional Aid for Haiti, 2008. ↩︎
- While Haiti’s domestic production met the population’s needs until 1980, by 1990 it was covering only 66% of those needs. See “Has the U.S. Rice Export Policy Condemned Haiti to Poverty?”, World Hunger Education Service, 2010. ↩︎
- See J. Lawrence Broz, Jeffry Frieden, and Stephen Weymouth, Populism in Place: The Economic Geography of the Globalization Backlash, International Organization, 2021. See also Dani Rodrik, Why Does Globalization Fuel Populism? Economics, Culture, and the Rise of Right-Wing Populism , Annual Review of Economics, 2021. ↩︎
- The UNCTAD 2024 Report on Economic Development in Africa confirms that the drop in commodity prices in 2014 and the COVID-19 pandemic have highlighted the structural vulnerabilities of African economies, significantly impacting investment and growth. Dependence on commodity exports exposes the affected countries to external shocks and limits their ability to invest in sectors with higher value added. ↩︎
- Henry Farrell and Abraham Newman, “The Weaponized World Economy,” Foreign Affairs, 2025. ↩︎
- The extraterritoriality of U.S. regulations refers to the application of U.S. laws to foreign companies or entities, even outside U.S. territory. It is based primarily on the central role of the dollar in international transactions, which often pass through the U.S. financial system. But it is not limited to currency: it also concerns access to the U.S. market, economic sanctions (OFAC), export and technology controls, and anti-corruption efforts (FCPA). Thus, a foreign company may face sanctions if it uses the dollar, U.S. technologies, or has economic ties to the United States. This mechanism gives the United States significant influence over the global economy and has drawn criticism, particularly in Europe, for infringing on sovereignty. ↩︎
- Statements from African unions and stakeholders criticize the EPAs, in particular because European agricultural products are perceived as competing directly with local production—in part due to differences in production costs and the existence of public subsidies in Europe. ↩︎
- See this article by Olayinka Idowu Kareem, “The Effects of European Union Trade Policies on Africa: Evidence from Africa’s Domestic and EU Markets,” IJEPS (2025). It shows that the export of European agricultural products to African markets—in sectors such as dairy and other foodstuffs—can undermine the competitiveness of local producers, particularly when European subsidies make these products artificially cheaper. ↩︎
- The purpose of export controls is to prevent foreign competitors from gaining access to essential products in a value chain. For example, the Biden administration in the United States has imposed export restrictions on chips used for generative AI, and China has tightened export controls on several critical minerals used in the tech, energy, low-carbon vehicle, and defense sectors. For more information, see the box on the economic war between the United States and China in Preconceived Idea 4. ↩︎
- Les barrières (ou “distorsions”) aux échanges commerciaux sont des mesures mises en place par un pays pour réguler ou restreindre l’importation et/ou l’exportation de biens et services. Les barrières tarifaires sont essentiellement les droits de douane. Les barrières non tarifaires sont des réglementations ou des restrictions administratives qui impactent l’importation ou l’exportation de biens (en influençant les prix ou les quantités). Les motivations peuvent être d’ordre économique, sanitaire, environnementales ou sociales. En savoir plus dans l’Idée reçue Multilatéralisme et libre-échange iraient toujours de pair dans notre module Mondialisation et commerce international. ↩︎
- Les droits de propriété intellectuelle (DPI) sont conférés à une personne physique ou morale pour protéger sa création intellectuelle, en lui donnant un droit exclusif sur l’utilisation de sa création pendant une certaine période. Ils relèvent de deux catégories : -les droits d’auteur pour les œuvres littéraires, artistiques et numériques (logiciels, bases de données etc.) ; -la propriété industrielle pour les innovations (ex : les brevets protègent les inventions) et les signes distinctifs (marques, logos, indications géographiques). En savoir plus, sur les DPI dans nos module Mondialisation et commerce international, et Marché, prix et concurrence. ↩︎
- In France, the VAT rate is 20% on most products. It is added to the selling price of imported products but not to that of products exported by French companies. If the country receiving French exports has a lower VAT-type tax, this constitutes an advantage for French exporters. ↩︎
- Le taux de change est le prix d’une monnaie par rapport à une autre. Pour en savoir plus, voir la partie Qu’est ce que le taux de change et comment impacte-t-il l’économie ? dans notre module Mondialisation et commerce international. ↩︎
- Vincent Berthoumieux et al., Chinese Protectionism, School of Economic Warfare, 2018. ↩︎
- See China Responds to the U.S. After the Treasury Designates Beijing a ‘Currency Manipulator, by Sam Meredith, CNBC (August 6, 2019). ↩︎
- Quantifying this is difficult, and estimates vary. See, for example, the analysis by Robin Brooks, an expert at Brookings, who estimates it at 20 percent: “Quantifying China’s Substantial RMB Undervaluation” (March 28, 2025). ↩︎
- Le marché des changes est le marché sur lequel les devises peuvent être achetées ou vendues. En anglais Forex Market ou FX market. En savoir plus dans l’Essentiel sur le système monétaire international dans notre module Mondialisation et commerce international. ↩︎
- See “Japan Forfeits 30 Years to the Gyrations of the Yen,” nippon.com (April 14, 2016) and the IMF’s 1985 Annual Report (p. 31) ↩︎
- Bonnie E. Loopesko and Robert A. Johnson, “Realignment of the Yen-Dollar Exchange Rate: Aspects of the Adjustment Process in Japan,” International Finance Discussion Papers (1987) ↩︎
- Monetary policy measures aimed at stimulating the economy, such as lowering key interest rates or quantitative easing, are described as accommodative. ↩︎
- La productivité du travail désigne le rapport entre la production réalisée et le travail nécessaire pour y parvenir. La production est mesurée le plus souvent en valeur monétaire (on utilise alors la valeur ajoutée pour une entreprise ou le PIB pour un pays). Elle peut également être mesurée en grandeur physique (ex : le nombre de voitures fabriquées, ou les tonnes de céréales produites) quand il s’agit d’analyser une entreprise ou un secteur. La quantité de travail est mesurée soit en nombre d’heures, soit en nombre d’emplois. Pour en savoir plus voir le module Travail et Chômage. ↩︎
- See this Wikipedia article: Automotive industry in Argentina. ↩︎
- La balance des paiements est un document de comptabilité nationale qui dresse chaque année le solde des échanges entre l’ensemble des agents économiques résidents d’un pays et le reste du monde. Il comprend en particulier la balance des biens et services (le solde des exportations et des importations) et permet de savoir si un pays est créditeur ou débiteur du reste du monde. En savoir plus dans l’encadré sur la balance des paiements de notre module Dette et déficits publics. ↩︎
- See this article from the Encyclopedia Britannica: Import-substitution industrialization. ↩︎
- Max Maurin, J.M. Keynes, Free Trade and Protectionism, L’Actualité économique, 2010 ↩︎
- John Maynard Keynes, “National Self-Sufficiency, The Yale Review, 1933; translated into French by Marc Mousli: De l’autosuffisance nationale, L’Économie Politique, 2006. ↩︎
- Dani Rodrik, “Has Globalization Gone Too Far?”, Challenge, 1998. ↩︎
- Straight Talk on Trade: Ideas for a Sane World Economy, Dani Rodrik, Princeton University Press, 2017. ↩︎
- Trade and Inequality Revisited, accessed February 5, 2026. ↩︎
- Au sujet du Nobel d’économie, voir Pourquoi le « Nobel d’économie » n’est pas un prix Nobel comme les autres, Anne-Aël Durand — Le Monde (09/10/2023). ↩︎
- See his book, translated into French and published in 2009, The Predatory State. ↩︎
- A Brief History of Equality, Thomas Piketty, Seuil, 2023 (page 90). ↩︎
- The Corn Laws were a set of “regulations enacted in the United Kingdom between 1773 and 1815 to regulate the trade in grain with foreign countries.” They were repealed on May 15, 1846, by the Parliament of Westminster. Learn more on the Wikipedia page on the Corn Laws. ↩︎
- In his fascinating book Myths and Paradoxes of Economic History (La Découverte, 2005; first edition 1999). These discussions are detailed on pages 31–81 in the chapters on free trade and protectionism. ↩︎
- See this review by Jan Emblemsvåg of Ha-Joon Chang’s book Kicking Away the Ladder: Development Strategy in Historical Perspective, On the Horizon: The International Journal of Learning Futures, 2005. ↩︎
- Agricultural Policy Monitoring and Evaluation 2025, OECD. ↩︎
- Agriculture page on the official About Switzerland website (12/28/2023) ↩︎
- 3.7 billion Swiss francs. See the 2023 Agricultural Report from the Swiss Federal Office for Agriculture. Swiss agriculture has three categories of subsidies: direct payments (76% of the total), production and sales promotion, and improvements to production infrastructure and social measures. ↩︎
- The Future of Food in Switzerland, Sustainable Development Solutions Network Switzerland, 2023. ↩︎
- See, for example, the article on Géoconfluences. ↩︎
- The USSR comprised 15 entities that are now independent states: the Russian Federation, the three Baltic states that are now members of the EU (Lithuania, Estonia, Latvia), Ukraine, Belarus, Armenia, Georgia, Moldova, Kyrgyzstan, Uzbekistan, Tajikistan, Azerbaijan, Turkmenistan, and Kazakhstan. ↩︎
- See Isabella Weber, How China Escaped Shock Therapy, Routledge, 2021. Read a review of the book by Antonin Chenard in La Vie des Idées (March 20, 2023) and the translated excerpts in Le Grand Continent (June 10, 2021): How China Escaped Shock Therapy: The Debate on Market Reform. ↩︎
- The Russian shock therapy program was primarily developed and implemented by the Russian reformers themselves, under the influence of IMF recommendations. ↩︎
- See, for example, Criticisms of the Choice of Shock Therapy, a chapter from the book The Dangerous Liaisons Between the Russian State and the Russian Economy by Jacques Fontanel and Ivan Samson, L’Harmattan, 2003; Maxime Petrovski and Renaud Fabre, “The ‘Therapy’ and the Shocks: Ten Years of Economic Transformation in Russia, ” Hérodote, 2002 . See also Chapter 11 of The Shock Doctrine by Naomi Klein, 2007. ↩︎
- Erik S. Reinert, Globalization in the Periphery as a Morgenthau Plan: The Underdevelopment of Mongolia in the 1990s, Chapter 6 in Globalization, Economic Development, and Inequality, Edward Elgar Publishing, 2004. ↩︎
- Starting in July 1990, a conversion rate of 1 East German mark to 1 West German mark was adopted for wages, pensions, certain benefits, and certain expenses (rent, electricity), and a rate of 2 to 1 for assets held in bank accounts (and, more generally, financial assets). See the Wikipedia article on the East German mark. ↩︎
- See Markus Gabel, Aufbau Ost: Between Disillusionment, Dilemma, and Renewal, Perspectives on the German Economy, 2005. ↩︎
- Une chaîne de valeur mondiale (CVM) comprend l’ensemble des activités interdépendantes réalisées à travers le monde par différentes entreprises pour mener un produit de sa conception à son utilisation finale (voire à sa fin de vie). Elles impliquent un très fort niveau de coordination entre les acteurs. À la tête des CVM se trouvent des multinationales, dont dépendent de fait les autres acteurs de la chaîne. En savoir plus dans l’Essentiel sur les CVM dans notre module Mondialisation et commerce international. ↩︎
- South Korea, Hong Kong, Taiwan, and Singapore. ↩︎
- The Philippines, Indonesia, Malaysia, Vietnam, Thailand. ↩︎
- Notable examples include the developing-country debt crisis of the 1980s, the “Tequila” crisis (1995), the Asian financial crisis and its spread to Latin America and Russia (at the turn of the 1990s and 2000s), and, of course, the global financial crisis of 2007–2008. For a list and analysis of financial crises, see UNCTAD’s Trade and Development Report 2015, Chapter 3: Financialization and Macroeconomic Turmoil. ↩︎
- UNCTAD Database – Population Series – Annual Total ↩︎
- Leather, textiles, apparel, paper and paperboard, glass, pottery, etc. See the complete list in the “Classification of Manufactured Articles by Degree of Processing” (CTCI Rev. 3) on the UNCTAD website. ↩︎
- Source: UNCTAD database— Goods and Services Series (MBP6): exports and imports of goods and services. ↩︎
- The State of Commodity Dependence 2025, UNCTAD. ↩︎
- MISSING NOTE: pays-moins-avances ↩︎
- MISSING NOTE: termes-de-lechange ↩︎
- See, for example, “Understanding the Chocolate Crisis,” Cité du Chocolat Valrhona (June 4, 2025). ↩︎
- Global Agrifood Implications of the 2026 Conflict in the Middle East, FAO, 2026. ↩︎
- Of particular note is Morocco, the leading industrial economy on the African continent. See: Larabi Jaidi, The Industrialization of the Moroccan Economy: Real Achievements and Ways of Challenging Them, a chapter in the book Morocco Today: Modernization Reflected in Tradition?, Institute for Research and Studies on the Arab and Muslim Worlds, CNRS Éditions, 1992, and the Africa Industrialization Index 2025 published by the African Development Bank Group, the African Union, and UNIDO (2026). ↩︎
- This is the case, for example, with European milk exports to West Africa. Learn more on the websites of citizen advocacy campaigns in Europe and West Africa: “Don’t Export Our Problems ” and “My Milk Is Local.” See also the position paper from the campaign: “For trade and fiscal policies that support the development of the local dairy sector in West Africa (2019). ↩︎
- Richard M. Auty, Sustaining Development in Mineral Economies: The Resource Curse Thesis, Routledge, 1993. ↩︎
- Gilles Carbonnier, “The Curse of Natural Resources and Its Antidotes,” Revue internationale et stratégique, 2013. ↩︎
- The Fragile States Index is compiled annually by aggregating 12 indicators grouped into four categories (political, economic, social cohesion, and social—plus one cross-cutting indicator). View the reports and annual rankings on the dedicated website. ↩︎
- Anton Brender, Capitalism and Social Progress, La Découverte, 2020. ↩︎
- Stan Shih, Me-Too Is Not My Style, Acer Foundation (1996). ↩︎
- Trade and Development Report 2018, UNCTAD. ↩︎
- This trend is reinforced by the fact that tax optimization practices make it possible to locate high-value-added activities—particularly in services or R&D—in countries with low tax rates. ↩︎
- Évasion, fraude et optimisation fiscales sont des pratiques visant à payer moins d’impôt que sa part “normale”. L’évasion fiscale consiste à échapper (au moins partiellement) à l’impôt, en délocalisant ses revenus ou son patrimoine. Elle peut être légale ou non. La fraude fiscale recouvre les moyens illégaux visant à payer moins d’impôt. Enfin, l’optimisation fiscale s’entend généralement comme les moyens légaux de diminuer son imposition. Voir notre fiche Évasion et paradis fiscaux. ↩︎
- Multinational corporations focus their activities on segments of the value chain where value added per worker is high, which allows them to increase their profit margins (very broadly speaking, VA = employment + margins. See the module on corporate accounting). However, this does not mean that total value added (as opposed to value added per worker) is higher in these segments: production may account for a significant share of the value added in a value chain but with a correspondingly high level of employment; in such cases, the profit margin will be limited. See Anne-Sophie Alsif, Clément Lesniak, Vincent Charlet, Where Is Value Created in France?, La fabrique de l’Industrie, 2019. ↩︎
- Les mesures miroirs sont des dispositions législatives européennes qui conditionnent l’accès au marché de l’UE au respect de normes de production (sanitaires ou environnementales par exemple) équivalentes à celles de l’UE. Elles visent à assurer la qualité des produits et à réduire les distorsions de concurrence entre les entreprises européennes et étrangères soumises à des normes plus laxistes. Si de telles mesures existent déjà dans certains domaines (ex : interdiction depuis 1996 d’importer du bœuf traité aux hormones), plusieurs acteurs portent leur extension. Voir par exemple Les mesures miroirs ou la nécessité d’aligner les exigences applicables aux importations avec les règles de production UE, Institut Veblen, 2025 ↩︎
- Strictly speaking, it refers to relations between more than two states. However, the term is most often used to describe relations involving the majority of the world’s states. For more information on the definition, see the 2020 Trade and Development Report, UNCTAD – Box “Multilateralism: A Concept That Is Difficult to Define,” page 128. ↩︎
- In a speech delivered in Marseille in early 2025, the Italian president denounced Europe’s “willing subservience” in the face of the Trump administration’s assertive imperialism. He praised the multilateral approach, to which he attributed, among other benefits: the San Francisco Charter establishing the UN, the Outer Space Treaty, the Helsinki Conference, the OSCE, the Intermediate-Range Nuclear Forces Treaty, and the Treaty on Conventional Armed Forces in Europe. See the translation of the speech on the Grand Continent website. ↩︎
- Multilateralism or Chaos: A Conversation with Pascal Lamy, Le Grand Continent (11/11/20). ↩︎
- See “Trump and the Trade War ”: L’Observatoire, Le Grand Continent. ↩︎
- See “How Are Customs Duties Set by the European Union?”, Toute l’Europe (July 28, 2025) and “EU Customs Duties: Explanations” on the European Council’s website. ↩︎
- Non-Tariff Measures: Evidence from Selected Developing Countries and a Future Research Agenda, UNCTAD, 2010 (p. 99). ↩︎
- According to the UNCTAD classification, technical barriers to trade are“measures relating to technical regulations and procedures for assessing conformity with technical regulations and standards, with the exception of measures covered by the chapter on sanitary and phytosanitary measures.” These are the most commonly used non-tariff measures (see UNCTAD’s “Key Statistics and Trends: Trade Policy” series). ↩︎
- “A WTO member may take safeguard measures (i.e., temporarily restrict imports of a product) to protect a specific domestic industry from an increase in imports of a product that is causing or threatening to cause serious injury to that industry.” Source: TRAINS Database glossary. ↩︎
- The WTO agreements essentially consist of the following texts: the framework agreement establishing the WTO, the predecessor agreements governing the three major areas of trade ( GATT for goods, GATS for services, and TRIPS for intellectual property), the dispute settlement mechanism, and the trade policy review mechanism. They also include plurilateral trade agreements that do not include all WTO members. ↩︎
- Adopted in 2001, the Doha Declaration on the TRIPS Agreement and Public Health emphasizes that the Agreement on Trade-Related Aspects of Intellectual Property Rights (TRIPS) must not conflict with public health objectives. In practical terms, it will make it possible to manufacture generic drugs not only for the domestic market but also for sale abroad. This declaration led to an amendment to the TRIPS Agreement adopted in 2017. Learn more on the TRIPS and Public Health page of the WTO website. ↩︎
- Le recours aux tribunaux d’arbitrage privé est souvent inclus dans les traités de commerce ou de protection des investissements. Ils ont pour objet de régler les différends entre États ou entre entreprises et États, sans avoir recours au droit d’un des États concernés ni au droit international. L’arbitrage privé est de plus en plus critiqué pour son manque de légitimité et de transparence d’autant plus quand il est utilisé pour attaquer des États ayant développé des politiques environnementales, sociales ou sanitaires que les entreprises considèrent comme nuisibles à leurs investissements. Pour en savoir plus sur certaines utilisations de l’arbitrage privé, voir notre fiche sur le Traité sur la Charte de l’Énergie. ↩︎
- In particular, the Inflation Reduction Act and the CHIPS and Science Act of 2022. ↩︎
- In 2010, China used critical minerals for the first time as a tool of geopolitical pressure in a dispute with Japan, following the Japanese Navy’s interception of a Chinese fishing vessel in an area claimed by Beijing (the Senkaku Islands). ↩︎
- This dominance extends across the entire value chain (to varying degrees depending on the mineral): mining, refining, and cutting-edge technologies that use these minerals (rare-earth magnets, batteries, electric vehicles). In 2024, China accounted for 60% of the mining and 90% of the refining of rare earths used to make magnets (which are essential, in particular, for wind turbines and electric car motors). See the Global Critical Minerals Outlook 2025 and the International Energy Agency’s Critical Minerals Data Explorer. ↩︎
- See Announcement No. 18 of 2025 issued by the Ministry of Commerce of the People’s Republic of China (April 4, 2025). This measure was extended to five additional minerals in October 2025. ↩︎
- In particular, they must provide detailed information on the end use and end users of products intended for export. ↩︎
- Le pouvoir de marché désigne la capacité d’un acteur économique à agir pour conserver sa position dominante. Cela peut être en jouant sur les prix ou en influençant les normes et les pouvoirs publics en sa faveur. En savoir plus dans l’Essentiel sur les multinationales dans notre module Mondialisation et commerce international. ↩︎
- ↩︎
- Tadeusz Rybczynski, Factor Endowments and Commodity Prices, Economica, 1955. ↩︎
- See, for example, this article by Benjamin Augé, “The Niger Delta: Oil Spills,” IFRI, 2025. ↩︎
- Wassily Leontief, Domestic Production and Foreign Trade; The American Capital Position Re-Examined, Proceedings of the American Philosophical Society, 1953. ↩︎
- In 1999, a review of the econometric literature conducted by Elhanan Helpman concluded that the Leontief paradox persists (The Structure of Foreign Trade, Journal of Economic Perspectives). ↩︎
- An Essay on Trade and Transformation, Almqvist & Wiksells Boktryckeri AB, 1961. ↩︎
- See “Scale Economies, Product Differentiation, and the Pattern of Trade”, The American Economic Review, and the book co-authored with Elhanan Helpman, Market Structure and Foreign Trade, MIT Press, 1987. ↩︎
- Une entreprise fait des économies d’échelle quand les coûts de production d’une unité supplémentaire baissent à mesure que les volumes produits augmentent. Cette situation se rencontre dans les secteurs où les coûts fixes (et notamment les investissements initiaux) sont très élevés : à mesure que la production augmente, les coûts fixes par unité diminuent. C’est le cas dans la plupart des secteurs industriels, et plus encore du numérique (ex : logiciels, jeux vidéos etc.). Ce type de modèle économique implique d’avoir accès à des marchés de taille importante pour écouler la production. Voir l’encadré sur les économies d’échelle dans notre module Mondialisation et commerce international. ↩︎
- Paul Krugman, Rethinking International Trade, MIT Press, 1990. ↩︎
- Paul Krugman has studied how government intervention can enable certain companies to gain an international advantage (for example, support for Boeing against Airbus). However, he is skeptical about the implementation of such policies, pointing out that in practice, governments risk favoring the wrong industries due to lobbying or misjudgments. And he remains cautious about the use of protectionism. ↩︎
- The Impact of Trade on Intra-Industry Reallocations and Aggregate Industry Productivity, Econometrica, 2003. ↩︎
- Elhanan Helpman, Oleg Itskhoki, and Stephen Redding, “Inequality and Unemployment in a Global Economy,” Econometrica, 2010. This model is based on the model by Melitz (cited above) and the model by Mortensen and Pissarides, “Job Creation and Job Destruction in Equilibrium,” Journal of Political Economy, 1994. ↩︎
- We have published an article on the proper use of mathematics in economics. ↩︎
- See James E. Anderson, Eric van Wincoop, Gravity with Gravitas: A Solution to the Border Puzzle, American Economic Review, 2003 . ↩︎
- See these two working papers from the Energy and Prosperity Chair on macroeconomic models: Alain Grandjean, “IAM Models and Their Limitations,” 2024, and Alain Grandjean and Gaël Giraud, “A Comparison of Weather, Climate, and Economic Models,” 2017. ↩︎
- Thomas W. Hertel and Roman Keeney, “What’s at Stake: The Relative Importance of Import Barriers, Export Subsidies, and Domestic Support, Chapter 2 of the volume edited by Kym Anderson and Will Martin, Agricultural Trade Reform and the Doha Development Agenda, Palgrave Macmillan, and the World Bank, 2006. ↩︎
- Kym Anderson, Will Martin, Dominique van der Mensbrugghe, Doha Merchandise Trade Reform: What’s at Stake for Developing Countries?, World Bank Economic Review, 2006. ↩︎
- Frank Ackerman, Kevin P. Gallagher, The Shrinking Gains from Global Trade Liberalization in Computable General Equilibrium Models: A Critical Assessment, International Journal of Political Economy, 2008. ↩︎
- See Scott L. Baier and Jeffrey H. Bergstrand, “Do Free Trade Agreements Actually Increase Members’ International Trade?,” Journal of International Economics, 2007. And Keith Head, Thierry Mayer, and Mathias Thoenig, “Welfare and Trade without Pareto,” American Economic Review, 2014. ↩︎
- Edmund Okraku Ofei, Trade Liberalization and Export Competitiveness: Evidence from the EU-ECOWAS Trade, University Library of Munich, 2016 . ↩︎
- ECOWAS is a community of 15 African countries established in 1975. ↩︎
- See the Foreign Trade page on the World Bank’s website (accessed January 31, 2026). ↩︎
- See, for example, Do Free Trade Agreements Actually Increase Members’ International Trade?”, by Scott L. Baier and Jeffrey H. Bergstrand, Journal of International Economics, 2007. ↩︎
- See John Cruzatti C, Free Trade and Subnational Development: Economic Activity and Human Welfare, The World Bank Economic Review, 2025. ↩︎
- The Evidence for Free Trade and Its Underlying Assumptions: How Well-Established Causal Generalizations Can Be Useless for Policy. Review of Political Economy, 2022. ↩︎