
This text has been translated by a machine and has not been reviewed by a human yet. Apologies for any errors or approximations – do not hesitate to send us a message if you spot some!
The expression “trickle down economics ” is supposed to illustrate the fact that money, like water, flows down the social pyramid, from the richest to the poorest. In reality, it’s not an economic theory, but a metaphor used to mock the arguments of those who promote public policies that favor the wealthiest players (individuals or large corporations) in the name of economic efficiency. By reinjecting the income they earn into the economy (via their consumption and, above all, their investments), these players are said to contribute to the development of economic activity and employment, ultimately improving living conditions for all, including the poorest. In this fact sheet, we present these arguments, still widely invoked in public debate, and explain why they are unfounded.
For the sake of simplicity, we’ll refer to those actors and economists who argue in favor of enriching the wealthiest in the name of overall economic efficiency as “trickle-down theory” advocates or promoters, even if very few of them explicitly lay claim to this “theory”.
The origins of the “trickle-down theory
A rhetorical and political debate
American columnist and humorist Will Rogers is credited with the first use of the trickle-down metaphor. He used it in an article in November 1932 to denounce President Hoover’s policies in the face of the Great Depression, and saw it as the cause of the Republicans’ defeat at the polls.
All the money was given to the rich in the hope that it would trickle down to the needy. Indeed, Mr. Hoover was an engineer, so he knew that water flowed from top to bottom. Place it high up and it will fall to the driest corner! What he didn’t know was that money flows from the bottom up. Give it down in the morning and the rich will have it by nightfall. At least, in the meantime, it will have passed into the hands of the poor. They saved the big banks, but the small ones went bankrupt.
The expression gained notoriety from the 1980s onwards to denounce the tax-cutting policies of Republicans in the USA (Reagan, Bush, Trump administrations), Margaret Thatcher in the UK. In October 2017, President Macron, in an interview on TF1 in which he sought to correct his image as “president of the rich” (due to tax cuts and in particular the ISF), used another metaphor assimilated in public debate to the “trickle-down theory” :
“There are men and women who succeed because they have talent, and I want them to be celebrated […] If we start throwing stones at the frontrunners, the whole rope will tumble down”.
The “trickle-down theory” debate is therefore primarily a political and non-academic one, in which, as we shall see, the term makes very little appearance. On the one hand, it is central to the rhetoric of the American Democrats, who use it to denounce the entire Republican economic program 1 . On the other hand, the Republicans (or, more broadly, the supporters of the trickle-down theory) do not use this expression, preferring instead to speak of “pro-business” policies, the defense of entrepreneurial freedom or the excessive weight of the State.
However, this rather political debate is underpinned by a number of economic questions that are worth exploring: Do too many taxes kill taxes? Does taxing the richest prevent economic development?
Contested arguments of the “trickle-down theory
The idea that the enrichment of the wealthiest ultimately benefits the entire economy, and the working classes in particular, finds little support among economists.
There are no models or theoretical works specifically supporting this idea. Nor does empirical work allow us to verify it, and even tends to show that it is harmful to the economy, as we shall see.
What’s more, very few economic or political players are specifically claiming to use the “trickle-down theory” in public debate (since, as we’ve seen, the expression is mainly used by its detractors). This does not prevent the underlying arguments from being mobilized with great effectiveness.
These arguments are of three kinds:
- If the rich become more affluent, they will consume more, which will ultimately increase overall demand and thus economic activity.
- We need to allow the wealthiest players to invest more by lowering their taxes, as these investments will ultimately benefit the economy as a whole.
- Taxes are so high that they discourage economic activity and therefore reduce government tax revenues. Reducing taxes on the wealthiest would therefore increase tax revenues.
These three classes of arguments are used to defend various tax cuts targeting the wealthiest players: income tax, capital tax, even corporate tax (see also our fact sheet on supply-side policy, of which the “trickle-down theory” is the most extreme and caricatured version).
In the remainder of this factsheet, we focus on income tax for the wealthiest households. Let’s emphasize one point: the debate is not about tax levels in general, but solely about the economic effects of tax cuts targeted at the wealthiest.
Reducing taxes on the wealthiest to increase state tax revenue
Understanding the Laffer curve: “too much tax kills tax”
One of the arguments often put forward by proponents of the trickle-down theory is that lowering taxes would enable the State to generate higher tax revenues. Indeed, they argue that higher taxes do not always lead to higher government revenues. On the contrary, states could drastically cut taxes without impacting their budgets.
In academic economic circles, this argument is known as the “Laffer curve”.
This curve owes its fame to an anecdote popularized by Jude Wanniski, editorial page editor of the Wall Street Journal and popularizer of supply-side policies. The journalist recounts 2 how University of Chicago economist Arthur Laffer drew a curve representing the trade-off between tax rates and tax revenues on a napkin at a 1974 dinner at Washington’s Two Continents restaurant, attended by Dick Cheney and Donald Rumsfeld. 3 .
Following this article, Laffer’s name will henceforth be associated with the adage “too much tax kills tax”, illustrated by the curve, even if the concept itself has been expressed by many other economists.
The famous napkin on which the “Laffer curve” was drawn, preserved at the National Museum of American History.
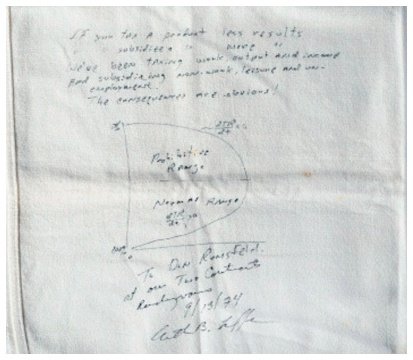
Source Note that there is controversy over the authenticity of the tablecloth preserved in the museum and the details of the dinner/cocktail party. See for example This Is Not Arthur Laffer’s Famous Napkin, NY Times, 2017
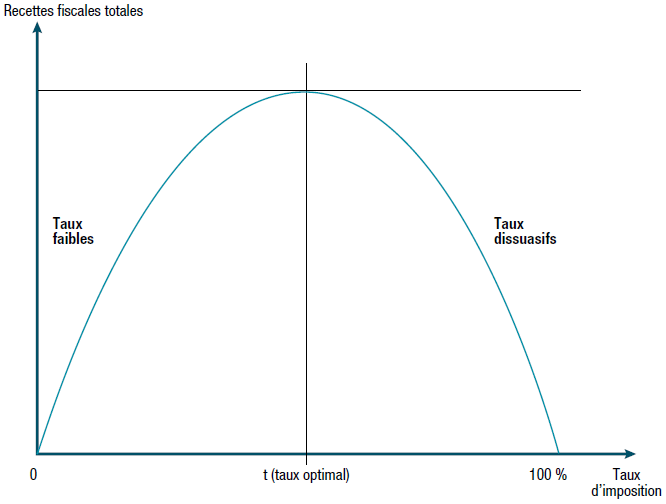
This curve reflects the idea that for most taxes, and in particular income and corporate taxes, there is an “optimal” rate which maximizes tax revenues, and beyond which any increase would diminish said revenues. This rate is necessarily greater than 0%, as there is no tax revenue without taxes, and less than or equal to 100% (since it is assumed that if the tax rate were greater than 100%, nobody would want to pay to work). Laffer translates this idea with his famous bell-shaped curve: when the tax rate is “to the left of the hump”, raising taxes increases tax revenues; conversely, “to the right of the hump”, lowering taxes has the surprising effect of increasing tax revenues! The underlying argument is that tax increases can act as a disincentive to work and the income generation that goes with it, ultimately reducing government revenues.
The Laffer curve applied to the incomes of the wealthiest
When we apply this curve to income taxes, which have several brackets, we can find situations where the first tax brackets are “to the left of the hump” and the highest brackets “to the right of the hump”.
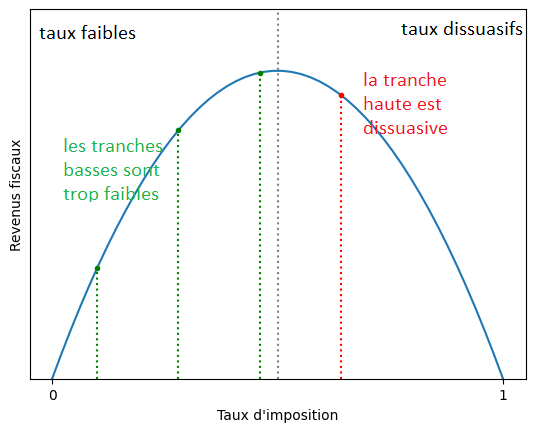
Applying the Laffer curve to a progressive tax with several brackets, such as income tax, we can quickly come to the conclusion that the State would benefit from lowering taxes for the better-off and increasing those for the poor.
Reducing income tax for the highest earners only could be beneficial for the state’s finances. In the 1980s, Arthur Laffer advised the Reagan administration to lower the top income tax bracket from 50% to 28%.
However, this reasoning has several flaws:
- First of all, while the existence of at least one optimal tax rate for tax revenues is almost tautological, it is quite possible that there is an optimal rate for each income bracket. We can well imagine a situation where the Laffer curve has a different shape according to income, and therefore according to the tax bracket considered. The Laffer curve can thus be applied to a progressive tax.
- The shape of this famous Laffer curve is unknown (only the 0% and 100% points are known). In other words, the optimal tax rate is unknown. So, whatever the current tax rate, we can’t say whether we’re to the right or left of the hump if we don’t know where this famous hump is.
The limits of the Laffer curve
Several studies have attempted to determine, either theoretically or empirically, the shape of the Laffer curve and the optimal tax rate. This work is necessarily complicated and imprecise, since many parameters come into play. The tax rate that maximizes government revenue varies according to economic context, country, era and many other factors.
Most of these studies, however, arrive at “optimal” rates for the top income tax bracket, which vary between 60% and 80%. 4 for OECD countries, i.e. rates well above those in force (see this study 5 and this one 6 ). Generally speaking, it would appear that the majority of countries are rather “to the left of the hump”, even if some are closer to the top than others. The Laffer curve argument would therefore tend to show that, from a public finance point of view, it would be better today to increase the tax rate on the richest.
So, except in the case of extremely high tax rates, lowering the top income tax brackets also reduces tax revenues. The direct effect of a tax cut leading to a reduction in government revenue is generally stronger than the indirect effect of increasing the tax base. In other words, there is no magic formula that will both significantly lower taxes and significantly increase their revenue.
Cutting taxes for the rich to revitalize the economy
The concept of the tax multiplier is used to support the “trickle-down theory”.
The concept of the tax multiplier refers to the positive effect of a tax cut on economic growth. The mechanism is as follows: by reducing taxes, the State increases the disposable income of the players concerned, who will be able to use it to consume more or invest. This additional consumption and investment will generate new income for those who benefit from it (for example, the employees of the companies that produced the goods consumed). The result would be an increase in economic activity greater than the drop in tax revenues. This mechanism is similar to the budget multiplier, but instead of mobilizing public spending, it relies on lower revenues.
Without entering into the debate on the effectiveness of the tax multiplier, let’s focus on the mobilization of this argument by proponents of the “trickle-down theory”.
In their view, the tax multiplier is more advantageous when we specifically reduce taxes on the wealthiest households. Indeed, the marginal propensity to save of the wealthiest is higher than that of the poorest. Conversely, their marginal propensity to consume is lower. For every additional euro of tax reduction, the top quintile of French households with the highest incomes will save at least 30 cents, while the poorest quintile will use the entire euro to consume. 7 . Lowering taxes for the richest therefore mechanically increases total savings. According to some, this would then lead to an increase in investment, which would then be transformed into growth and jobs for everyone. So there’s a chain reaction from tax cuts to economic prosperity, via increased savings, investment, growth and employment.
These effects have not been verified in practice, as several phenomena cancel out the benefits of tax cuts
However, this reasoning does not hold up in practice. Analyzing changes in income, capital and capital gains tax rates in 18 OECD countries from 1965 to 2015, David Hope and Julian Limberg
In reality, the chain reaction described by proponents of the trickle-down theory doesn’t work. Several steps in the reasoning don’t work:
- More savings does not necessarily mean more investment. In fact, the money lent by banks does not come from savings. Banks themselves create the loans they grant, without the need for the money to come from anywhere. More on this in the Money module.
- Additional savings do not necessarily benefit the real economy (see the module on finance). It may be invested in financial products that fuel speculative bubbles, or it may help to drive up property prices, with adverse consequences for households.
- Finally, economic recovery and investment are not necessarily synonymous with jobs (especially if these investments are used for robotization or automation).
It should be noted, moreover, that even if the link between additional savings by the most affluent and investment in the productive economy were proven, there is no guarantee that said investments would be directed towards the sectors most beneficial to society, starting with the ecological transition (see, for example, in the module on finance, the fact that the financial markets in which savings are invested are largely insufficient to finance the ecological transition).
False promises, real consequences of trickle-down theory
Impact on public budgets
The positive effects of the “trickle-down theory” are therefore not there, either in terms of employment or growth. However, the negative counterparts are there for all to see. As we have already seen, the implementation of measures in application of this “theory” necessarily entails a reduction in national budgets.
This can take the form of a reduction in the quality of essential public services such as education, healthcare and security. In the state of Kansas, where income tax cuts to the top brackets (as well as the estate tax) were passed in 2012, the regional budget has been drastically reduced, with consequences for public funding of education, infrastructure and other public services 10 .
Finally, it may also reduce the resources available for public investment, which is essential for the ecological transition, as we explained in the proposal Launching an ecological reconstruction plan.
Growing inequality
On the other hand, lowering taxes for the wealthiest leads to a significant increase in income inequality. 9 . For some, this is a necessary evil for economic prosperity. However, the opposition between income equality and economic development is far from clear-cut. On the contrary, several studies show that economic growth is often slowed down in countries where inequality is on the rise 12 . Beyond the question of growth alone, the work of Kate Pickett and Richard Wilkinson has shown the extent to which negative social impacts (life expectancy, drugs, crime, etc.) increase in unequal societies.
Conclusion
The proponents of the “trickle-down theory” are proposing a miracle solution for increasing public revenues, boosting the economy and lowering taxes all at the same time. However, none of the arguments put forward live up to their claims. Firstly, the State does not recoup the losses from tax cuts, as the Laffer curve would suggest. Secondly, the “adrenalin jolt” 13 for the rest of the economy has little or no effect. Finally, the application of this theory tends to increase income inequalities, while at the same time reducing the budget that the State can allocate to reducing inequalities, notably through education or health.
The “trickle-down theory” is easy to refute en bloc, but it often slips discreetly into much more serious debates on tax policy. In such cases, it plays a pernicious role, since it remains seductive and difficult to challenge when hidden among other arguments or language.
Find out more
- Le mythe du ruissellement économique, Gaël Giraud, La Croix, 2017
- The myth of “trickle-down theory”, Arnaud Parienty 2017
- Is there such a thing as trickle-down theory? Antoine Belgodere, 2018
- Causes and Consequences of Income Inequality: A Global Perspective, IMF, Staff Discussion Notes, 2015
- What is the Laffer effect and should we fear it, Blog Bon Pote, 2024
- The Laffer curve – Clever storytelling or scientific truth, Gestion & Finances Publiques, 2019
- See, for example, Barack Obama’s speech to the Associated Press in 2012. ↩︎
- See for example Jude Wanniski, Sketching the Laffer Curve, 2005. ↩︎
- André Barilari, The Laffer curve. Skillful storytelling or scientific truth?“, Public Management and Finance, 2019. ↩︎
- In an article on the Laffer curve, Don Fullerton states that studies show that the average tax rate is 70%(New Palgrave Dictionary of Economics, 2008). ↩︎
- Jacob Lundberg, The Laffer curve for high incomes, Working Paper n°711, Luxembourg Income Study, August 2017. ↩︎
- Mathias Trabandt, Harald Uhlig, The Laffer curve revisited, Journal of Monetary Economics, 2011. ↩︎
- Jérôme Accardo, Sylvain Billot , Plus d’épargne chez les plus aisés, plus de dépenses contraintes chez les plus modestes, INSEE, 2020. ↩︎
- David Hope, Julian Limberg, The economic consequences of major tax cuts for the rich, Socio-Economic Review, 2022. ↩︎
- Owen Zidar, Tax Cuts for Whom? Heterogeneous Effects of Income Tax Changes on Growth and Employment, Journal of Political Economy, 2019. ↩︎
- Russell Berman, The Death of Kansas’s Conservative Experiment, The Atlantic, 7/06/2017. ↩︎
- Owen Zidar, Tax Cuts for Whom? Heterogeneous Effects of Income Tax Changes on Growth and Employment, Journal of Political Economy, 2019. ↩︎
- Causes and Consequences of Income Inequality: A Global Perspective, IMF, Staff Discussion Notes, 2015. ↩︎
- That was the promise of Sam Brownback, governor of Kansas in 2012, who largely applied the trickle-down theory. ↩︎