
This text has been translated by a machine and has not been reviewed by a human yet. Apologies for any errors or approximations – do not hesitate to send us a message if you spot some!
The energy transition rests on two pillars: the reduction of energy consumption (through energy sobriety and efficiency) and the decarbonization of the energy mix, which requires massive investment in renewable energies (RE) combined with the electrification of certain uses. Since the beginning of the 21st century, the massive development of renewable energies thanks to public support systems has made the sector attractive to private investors. However, investment needs are still considerable, and the ability to attract cheap capital is crucial to the final cost of the energy produced.
As we’ll see in this fact sheet, in most sectors, renewable energies require very high initial investments, followed by low operating costs. As a result, the cost of initial financing has a decisive impact on a project’s overall profitability. Public schemes to reduce these costs can provide significant support in mobilizing private investment and enabling renewable energies to be scaled up.
Financing requirements for renewable energies
Renewable energies: colossal investment requirements
Renewable energies take many forms: solar photovoltaics, hydroelectricity and wind power for electricity; wood/biomass, geothermal or solar thermal for heat and cooling; and biogas to replace fossil gas, incorrectly called “natural gas”.
In 2023, renewable energies accounted for around 15% of France’s primary energy consumption. 1 (and 22% of final energy consumption 2 ): with biomass as the leading source, followed by hydroelectricity, heat pumps 3 and wind power.
Distribution by sector (in %) of the 388 TWh of primary energy
produced in France by renewable energies in 2023
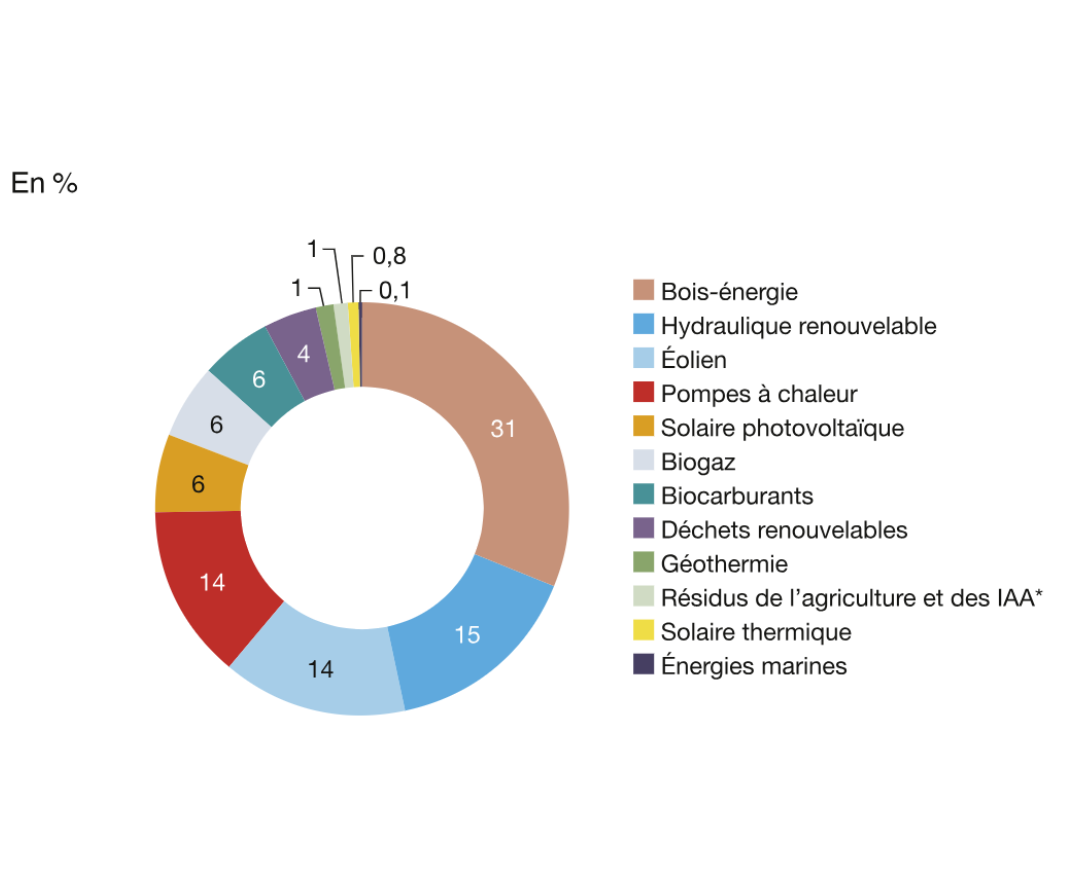
Source Les Chiffres clés des énergies renouvelables, Datalab, SDES Bilan de l’énergie, Edition 2024
While hydropower is set to remain relatively stable, growth estimates for other renewable energies are in the region of 5 to 10%/year, depending on the technology, according to the multi-year energy plan. 4 currently being drawn up by the French government.
Such growth requires considerable funding. For France, investment in renewable energies in 2021 was estimated at almost €15 billion/year. Given the expected growth in renewable energies, this figure should rise to €20 billion/year. 5 by 2030.
Public and private investment in renewable and recovery energies in France from 2006 to 2021
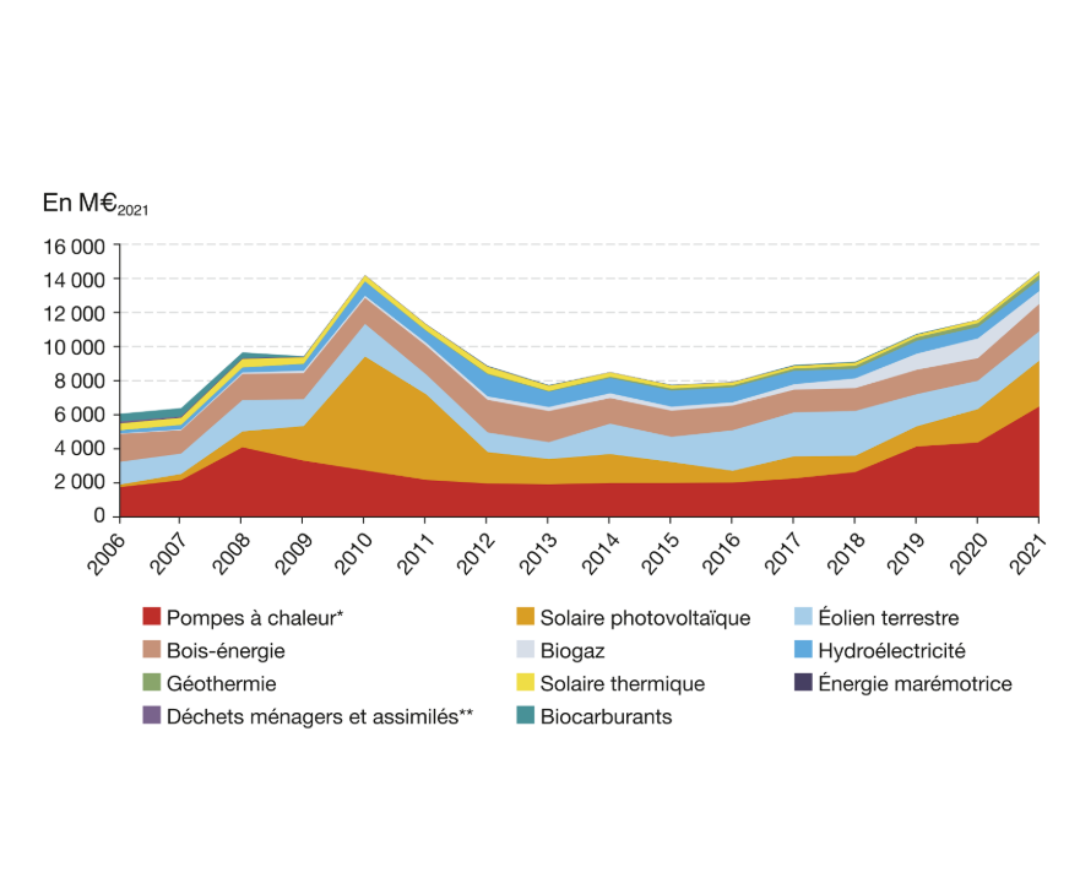
Source Les Chiffres clés des énergies renouvelables, Datalab, SDES Bilan de l’énergie, Edition 2024
Note: these figures do not include offshore wind and marine energies (excluding tidal power), which are estimated by I4CE and OEM at 1.2 and 2.6 billion euros respectively in 2021.
Almost all of these investments are made by private investors (individuals, companies with public or private capital). Solar and wind farms, as well as biomass boilers and some biogas plants, rely heavily on bank financing, so it’s essential that regulations and market conditions allow and encourage private investment in renewable energies.
Estimates for the development of renewable energies worldwide are also extremely high between now and 2050, particularly for solar and wind power, where growth rates are expected to be between +15 and +20%/year. The worldwide growth rate for batteries is expected to be around 30%/year over the next decade.
Installed capacity of the world’s main renewable energies by geographic region and technology type, and annual growth outlook to 2030.
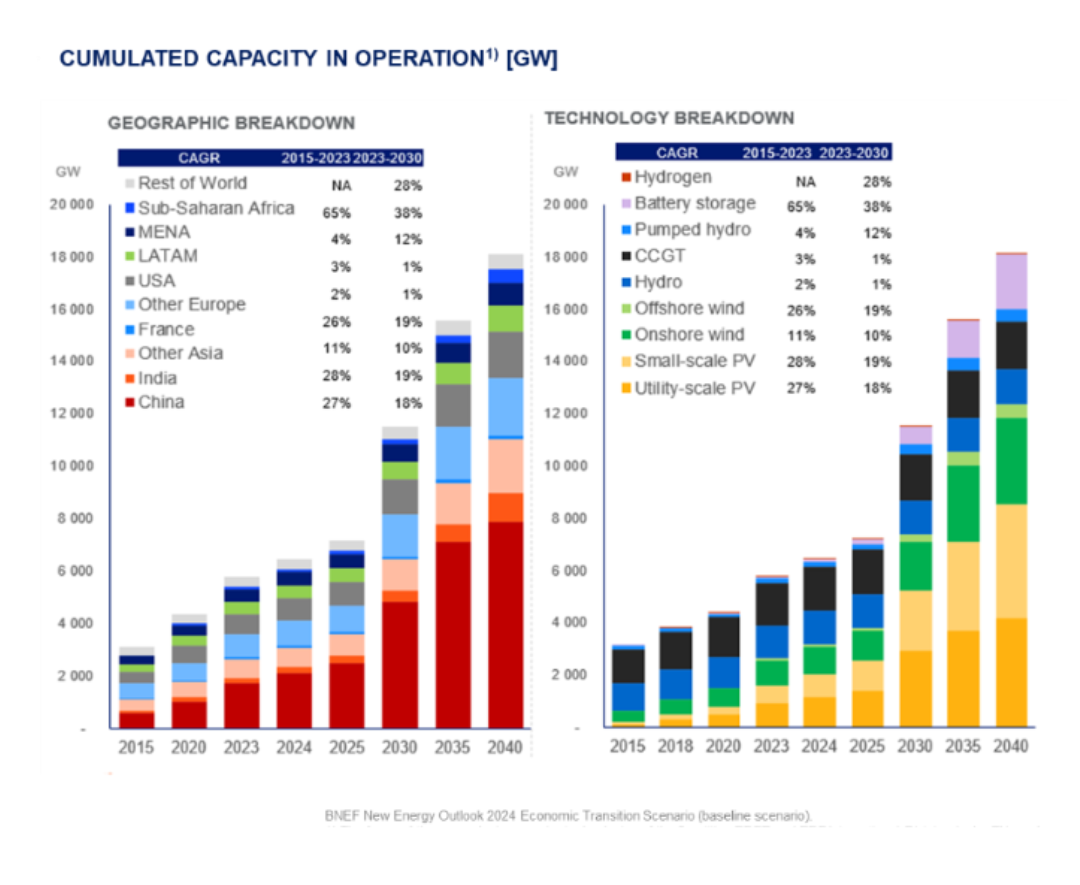
Source Bloomberg news energy finances (BNEF): New energy outlook 2024
By 2023, installed capacity of the main renewable electricity sources stood at around 4,000 GW. Hydropower will remain relatively stable until 2040, as will fossil gas power plants (CCGT), while solar and wind power are expected to grow by 15-20%/year and become the world’s main sources of electricity from 2030 onwards.
The financing structure for renewable energies
Renewable energies are “infrastructure” assets with the following characteristics:
- require a significant initial investment,
- operation over several decades,
- generate regular income over their lifetime.
In addition, most renewable energies have low operating costs, as they do not require any “pay-as-you-go” fuel.
These characteristics, once the technology is sufficiently mature (see box) and revenues are fairly regular and predictable, make renewable energies attractive for non-recourse project financing (see below).
Technological maturity and impact on financing
Financing conditions depend on the overall risks of a project, and in particular its technological risks, which can be defined as the risk that the installed machine will not perform as expected because it malfunctions or performs less well than estimated in the engineering studies.
A technology is said to be mature when it has already been tried and tested many times over, and everyone is confident about the performance of a newly installed unit. Solar photovoltaics and onshore wind power are mature technologies. Floating wind power is not yet fully mature (only a few units installed worldwide). Hydropower is not at all mature (only pre-industrial prototypes have been installed).
When a project is risky, some investors refuse to invest, while others accept but expect a higher return.
Banks are relatively averse to technological risk. When they judge a project to be technologically risky, they refuse to lend on a “non-recourse” basis, and require project developers to be ready to “rescue” the project in the event of a problem (by injecting capital). For mature technologies, i.e. with substantial positive feedback, banks will agree to lend money to the project on a “non-recourse” basis: if the project goes wrong, they won’t be able to ask the project developer to pay the extra costs to bail out the project.
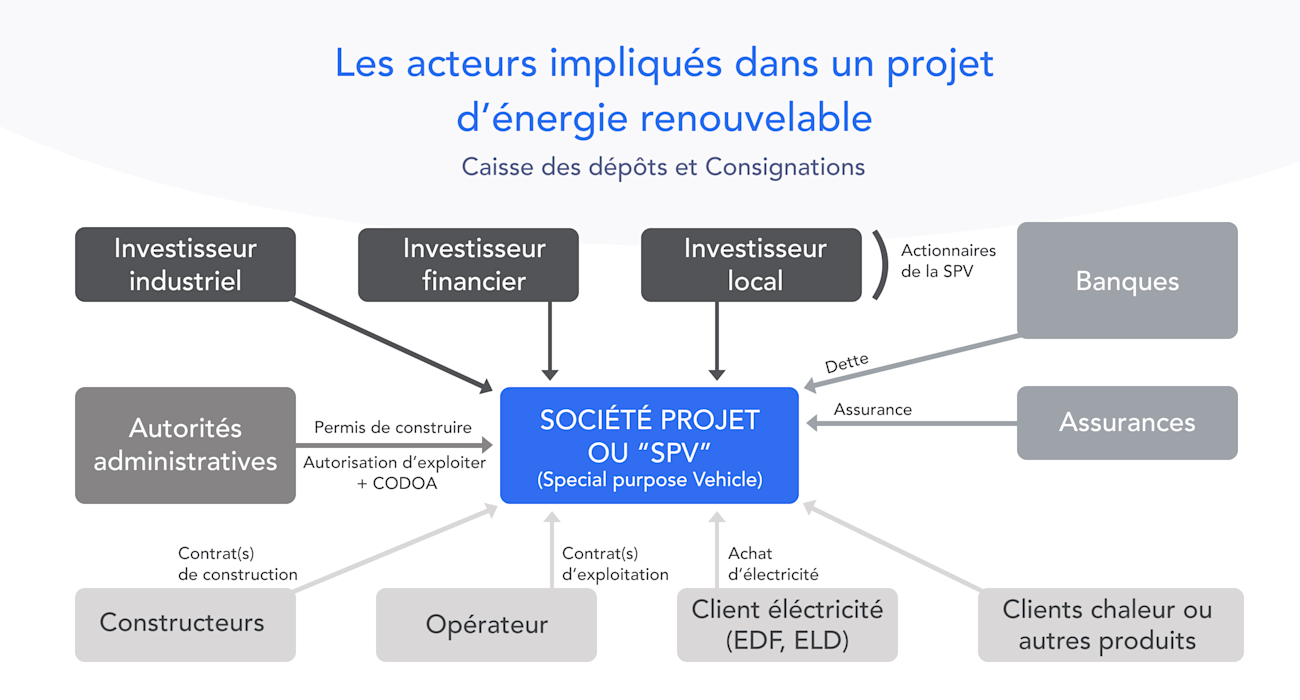
In a typical financing scheme, the renewable energy project is held by a special purpose vehicle(SPV).
The financing of the SPV is based on :
- of the capital injected by the SPV’s founders (e.g. utilities such as EDF, Engie or Total, or specialist players such as Neoen, Voltalia, Valorem, etc.);
- bank debt which is “non-recourse”, i.e. lenders (banks) cannot demand compensation/additional capital injections from SPV shareholders if the renewable project runs into difficulty (see box above).
This type of financing considerably reduces the capital required from shareholders. For mature technologies such as solar and wind power, the debt-to-equity ratio in an SPV is around 70% debt and 30% equity (70-30), or even 80-20. Put another way, for a project requiring 100 million euros of investment, the shareholders contribute 20 million euros of equity and the SPV borrows 80 million euros from banks at the same time.
The debt-to-equity ratio depends on macroeconomic conditions and the project’s risks: the more mature the technology, and the more certain its revenues are and will be early in the life of the project, the higher the proportion of debt to equity (known as gearing or bank leverage).
Since the interest paid on debt is lower than the interest required on equity, non-recourse financing lowers the total cost of the project.
In some countries, more complex financing arrangements mean that, by temporarily moving away from the non-recourse model, a wind farm can be financed entirely by debt during construction. This delays the injection of equity capital and therefore, given the interest rate differential between equity and debt, reduces the total cost of the project. In the remainder of this analysis, we shall remain with the case of conventional non-recourse project financing.
The economic performance of renewable energies depends heavily on the cost of financing
There are several metrics for comparing the economic performance of energy production projects.
The Levelized cost of energy (LCOE ) compares the cost of an energy production project with the energy it is expected to deliver over its lifetime. This indicator can be used to compare different energy projects.
The cost corresponds to the price at which the energy produced must be sold throughout the project’s lifetime to ensure the profitability of the investment (taking into account the remuneration requirements of investors).
As we shall see, whatever the metric used, the cost of financing is a determining factor.
Impact of financing costs on the Levelized Cost of Energy (LCOE)
The LCOE is calculated by dividing the total project costs by the total energy production of the project. This calculation involves a discount rate, as the costs and energy production are spread over many years of the asset’s lifetime.
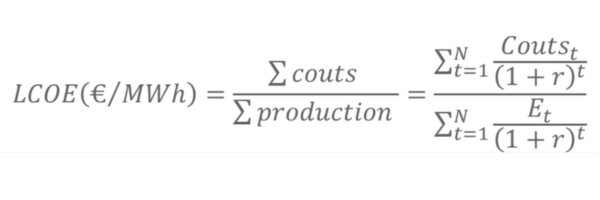
Costs include initial investment, fuel (where applicable), servicing and maintenance, dismantling and management of waste generated.
Energy production includes the project’s annual energy production (net of any energy consumed to operate the plant).
LCOE does not depend directly on the project’s financing structure: project costs are “physical” costs, and take no account of bank interest charges or return on equity.
The only potential “indirect” variability in LCOE relates to the nature of the project, through the discount rate: the riskier the project, the higher the discount rate should theoretically be.
The practical strength of LCOE is that it makes it easy to compare the economic performance of projects of very different natures: different energies, projects located in different countries, with different production profiles, etc.
If an energy project has high costs in relation to the energy production it generates, and therefore a high LCOE, it is a priori less attractive for the energy system than a project with a lower LCOE, and will therefore find it harder to be profitable.
This comparison is not free of bias. It does not take into account the “quality” of the energy produced for the energy system: is the production plant controllable (easy to start up or shut down according to demand)? Can it deliver high power at times? Can it react quickly or not when called upon by the grid operator? Nor does the LCOE reflect whether the energy produced is remunerated by virtue of favorable regulation or because it is sold directly to customers or on a wholesale market, etc.
The LCOE of renewable energies has fallen considerably over the past 10 years.
Today, it is competitive with fossil fuels. This decline is mainly due to lower manufacturing costs thanks to innovation and industrial massification (in China for photovoltaics).
This decline is likely to continue at a slower pace, given the high level of technological maturity and industrial massification already achieved.
It should be noted that the introduction of border tariffs, currently in force in the USA and India and under consideration in the European Union, has an upward impact on LCOE, since it increases the cost of equipment delivered on site. At the end of 2023, customs duties in the USA were 100% for Chinese panels, and LCOE was around €10/MWh higher than in Europe. This higher level does not, however, compromise the profitability of the installations.
Evolution of the full cost of electricity (LCOE) worldwide
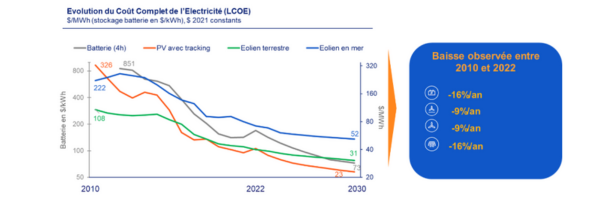
Source 2H 2023 LCOE Update: An Uneven Recovery (paid report), Bloomberg New Energy Finance (BNEF)
Using LCOE, we can estimate the indirect impact of the cost of financing.
When a company calculates the LCOE of a project, the discount rate used corresponds to the weighted average cost of the capital invested (weighted average of financial expenses on debt and dividends on equity) that it envisages.
What is the average cost of capital (or WACC)?
Most often referred to as WACC (for “Weighted Average Cost of Capital”), the average cost of capital is an indicator of the overall cost of financing a company (and not just its capital, which is a source of confusion).
It is calculated according to :
– the financing structure, i.e. the breakdown between equity (capital) and debt;
– the respective costs of equity and debt.
Here’s an example of how to calculate the WACC for a company financed 20% by equity and 80% by debt.
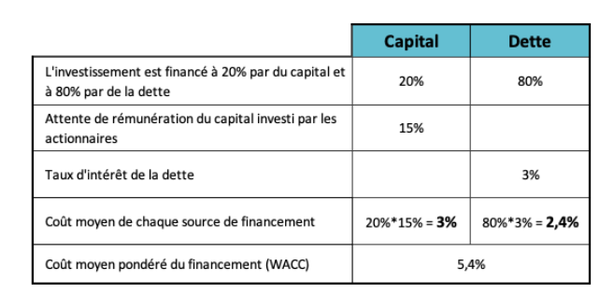
Source See our fact sheet to find out more about discount rates and WACC.
The simulation below compares the impact on LCOE between a financing structure with an 8% discount rate and an extreme case where the discount rate would be zero (no need to remunerate equity or pay interest on debt).
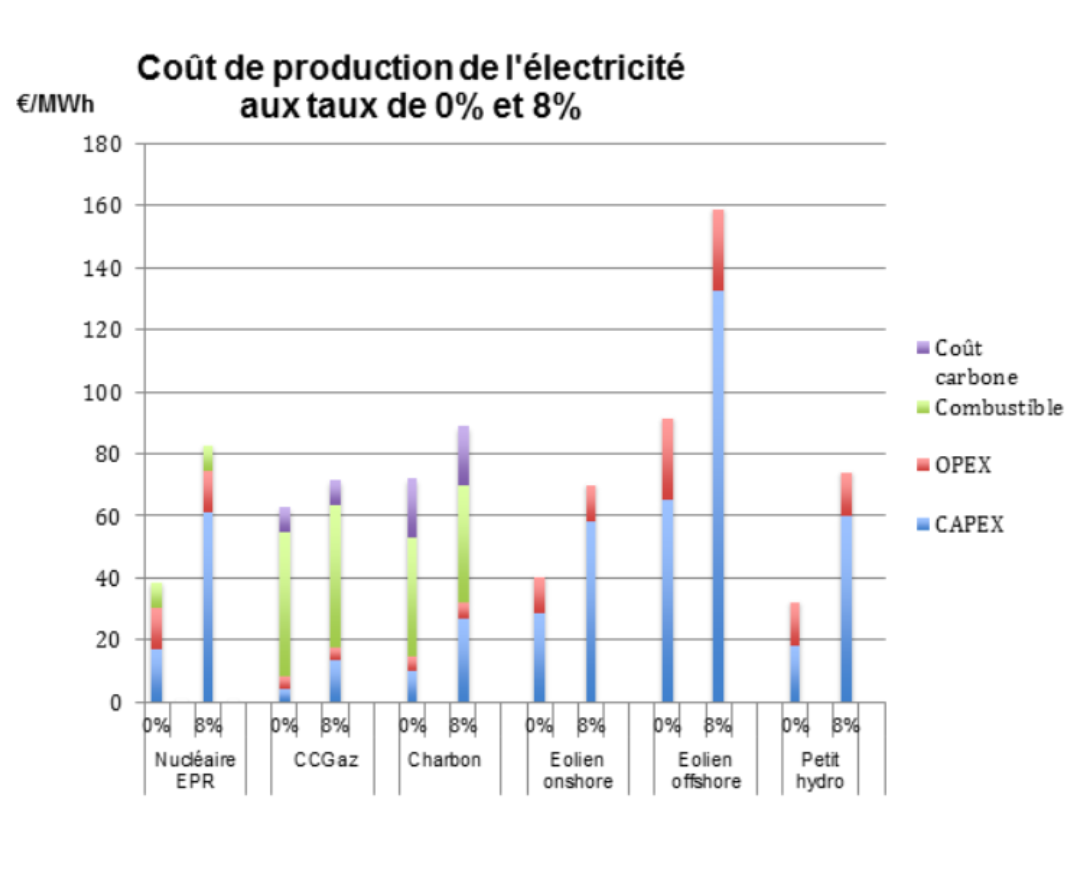
Source article Le capital contre la transition énergétique?, Alain Grandjean, Blog Les Chroniques de l’Anthropocène, 2012.
Comment: The purpose of the graph is solely to provide an educational illustration of the impact of the discount rate on full cost. It does not reflect current production costs. The CAPEX and OPEX data used in the calculations are out of date (dating from 2012).
This simulation shows that in the extreme case, with no need to remunerate equity and debt, the LCOE would be half as high for renewable energies. On the other hand, it would only fall by around 25% for fossil energies (due to the lower weight of initial capital compared with operating expenses). This is, of course, a theoretical limit case.
Impact of financing costs on cost price
Cost price is another metric for the economic performance of an energy project. It corresponds to the price at which the energy produced must be sold throughout the project’s lifetime to ensure “sufficient” profitability. 6 of the investment. This “cost price” therefore includes the developer’s margin. In France, it is close to 7 of the price submitted by candidates responding to public tenders for the development of solar and wind power plants.
Invitations to tender and public support for renewable energies
The French government regularly publishes invitations to tender for renewable energy projects, in line with the multi-annual energy program. These calls for tender concern all electrical renewable energies: wind power, offshore wind power, solar power, marine energies and biomass.
Project developers respond to these calls for tenders by proposing a tariff for the sale of electricity from their future production (e.g. €80/MWh). Successful bidders sign a remuneration supplement contract, generally for 20 years.
Once the project has been completed, production is sold, and the producer ultimately receives the tariff he proposed for each MWh produced.8
As with LCOE, the cost price depends on the weighted average cost of capital.
An investment of 100 million euros in a 100 MW solar farm will have a different cost price if the investment is made with 100% equity, remunerated at 10%/year, or if the investment is made with 80% debt and 20% equity, with a remuneration requirement of 4% and 10% respectively.
As the cost price depends on financing conditions, it is sensitive to macroeconomic conditions.
For example, a rise in the central bank’s key interest rates will have the following effects on new projects:
- increase in interest rates charged for renewable energy project debt: these are calculated according to a formula ENR debt rate = ECB risk-free rate + project-related risk premium ;
- Increasing return on equity requirements: since investors can earn more (than before the rise in key interest rates) by investing in risk-free debt, such as public debt, they will only agree to invest equity in a renewable energy project if the return on the equity invested increases;
- lower debt-to-equity ratio: the proportion of debt in a project’s financing structure depends on a number of parameters, including the project’s ability to repay debt in the event of a downturn (e.g., lower-than-expected production, or lower-than-expected production sales). The higher the profitability requirements for debt and equity, the greater the impact of downturns on debt repayment capacity, leading to a reduction in the proportion of debt in the project.
The sensitivity of the cost price of renewables to the cost of capital was highlighted by the aftermath of the invasion of Ukraine.
During the 2010 decade, the energy sector benefited from a highly favorable macroeconomic context (low key interest rates) and a steady decline in equipment costs.
These two factors led to a significant drop in LCOE and cost prices.
This period ended with the invasion of Ukraine, which was followed by a spike in inflation, particularly affecting ENR equipment. In response, the ECB sharply raised its key interest rates. From mid-2022 to the end of 2023, the feed-in tariffs requested in French calls for tenders jumped from around €60/MWh to around €85/MWh. 9 for ground-mounted solar and onshore wind power).
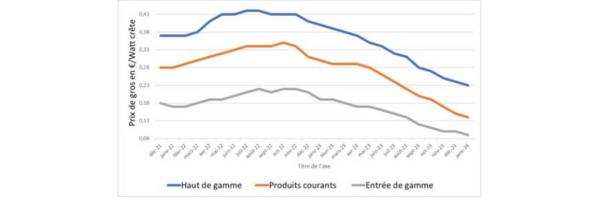
Price trend for solar panels delivered in France
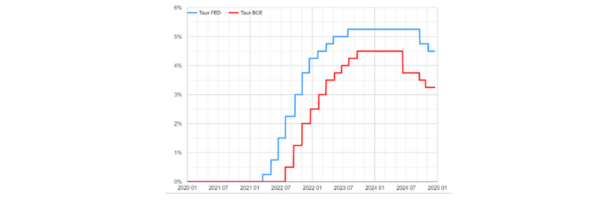
The fact that key rates have remained high in Europe makes it possible to study a real case where these rates – and therefore the cost of financing – are the only variable that changes. Comparing the tariffs requested in the 2023 tender with those requested in 2021, before the invasion of Ukraine, shows the impact of financing conditions on the cost price.
An analysis of the bids submitted to the French ground-mounted solar tenders shows that the electricity sales tariff (over 20 years) requested by the applicants has risen from €59/MWh in December 2021 to €68/MWh in May 2022, €73.5/MWh in July 2022, €82/MWh in December 2022 and €82.4/MWh in July 2023 and €79.3/MWh in August 2024.
Comparison of average project tariffs for ground-mounted solar tenders from December 2021 to August 2024 with the price of solar panels and ECB key rates.
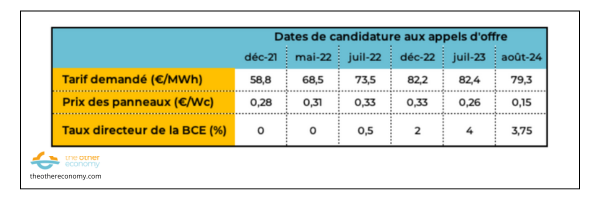
Source État des lieux et premiers enseignements tirés à fin 2023 des résultats des appelsd’offres PPE2 éoliens terrestres et photovoltaïques, CRE (2024); ECB for key rates, Tecsol for panel unit prices (see above).
A more precise analysis would naturally have to take into account the effects of anticipation. 10 as well as delay effects. 11 It would also need to take into account the evolution of cost items (civil engineering, salaries of installation companies, etc.).
Despite this limitation, we can see that while the price of panels is close to the end of 2021 and mid-2023, the feed-in tariff applied for by the winners has risen by around €20/MWh, i.e. an increase of 30%. This increase is therefore largely due to the change in financing conditions, from a zero interest rate environment to a key interest rate of 4%.
Extrapolating from this analysis, a 1% change in the required return on capital translates into an increase in the price of renewable electricity from projects of around 7%.
Conclusion: the importance of lowering the cost of financing to guarantee the development of renewable energies
Given the urgency of the climate change situation, and the significant impact of the cost of capital on the cost price of renewable energies as described above, it is useful to consider the possible levers for lowering the cost of capital.
At the microeconomic level, a project’s cost of capital is linked to its risks. The more risks are minimized, the lower the cost of capital. French public authorities are already playing a role in this respect:
- securing project revenues through guaranteed prices for the sale of the energy produced for 20 to 25 years;
- by indexing these revenues to inflation and changes in interest rates between the time of application and the time of purchase of the main components (indexation implemented at the time of the 2022 inflation peak);
- by protecting the project against the risk of overproduction for 20 to 25 years: the investor is remunerated even if the park is temporarily shut down due to overproduction;
- by taking on part of the technological risk of innovative projects via repayable advances (loans to the SPV which are repaid only if the project is successful).
Generally speaking, the establishment of a stable regulatory and fiscal framework without retroactivity is an essential condition for the development of renewable energies.
At the macroeconomic level, public authorities can also intervene:
- via green taxonomy: the European Union has defined asset categories to guide/incentivize investors and lenders to favor green or decarbonized assets;
- by differentiating key rates according to the green nature of assets the European Central Bank could strongly favor these assets.
- 388 TWh out of 2523 TWh primary energy consumption. Primary energy refers to the energy available in resources drawn from nature, before any transformation by man. Examples include oil before refining, wind energy and solar energy. To find out more, see the Natural resources and pollution module (box). ↩︎
- Source: Les énergies renouvelables en France en 2023 dans le cadre du suivi de la directive (UE) 2018/2001 – Données provisoires, published on the French Ministry of Ecology website on 07/05/2024. ↩︎
- Heat pumps are considered to make extensive use of renewable energies, as they “draw” part of the energy supplied to the home from the environment – air, water, soil. For every 1 kWh of electricity consumed to run a heat pump, several kWh of heat can be supplied to the home. ↩︎
- The Multiannual Energy Program (PPE), instituted by the 2015 Energy Transition Law for Green Growth, establishes the government’s energy action priorities over a 10-year period (divided into two 5-year phases). It is updated every five years. The current version covers the period 2019-2028. It is currently being revised for the period 2025-2035. ↩︎
- For example, the report Les incidences économiques de l’action pour le climat, by Jean Pisani-Ferry and Selma Mahfouz (22/05/2023) indicates an annual increase in investment in renewable energies of at least 3 billion euros per year by 2030. ↩︎
- For mature technologies, utilities such as Engie, TotalEnergies and EDF generally require a project return of 1-3% above the WACC. If the WACC is 8%, a return on capital employed of 9 to 11% is considered sufficient. ↩︎
- In French solar and wind power tenders, candidates propose a price for the sale of electricity for 20 or 25 years. As the lifespan of these installations is slightly longer (30 to 35 years), the cost price is slightly different from the price proposed in the call for tenders. For the period from 25 to 35 years, it incorporates income from simulated market prices. However, discounting means that revenues generated over this period count for little in the overall profitability of the park. ↩︎
- In detail, the remuneration supplement mechanism is as follows: once the project has been completed, the production is sold on the wholesale market. If market prices (actually a reference index calculated by RTE) are lower than the tariff proposed in the call for tenders, the producer receives a remuneration supplement corresponding to the difference between the two. If market prices are higher, the producer pays the difference. ↩︎
- State of play and initial lessons learnt at the end of 2023 from the results of calls for tender “PPE2 onshore wind and photovoltaicCRE (2024) ↩︎
- If, at the time of bidding, it is anticipated that the price of panels will fall, bids will partially take this prospect into account. ↩︎
- Companies are slow to pass on higher key interest rates in the form of higher profitability on new investments (and vice versa). Bank interest rates move more quickly. ↩︎