
This text has been translated by a machine and has not been reviewed by a human yet. Apologies for any errors or approximations – do not hesitate to send us a message if you spot some!
After three decades of relative price stability, inflation is back in the advanced economies following the economic upheavals caused by the COVID-19 pandemic and the war in Ukraine. This phenomenon is accompanied by a revival of the debate on the link between money and inflation, which has been regularly revived throughout the history of economic thought.
Among the various explanations for the origins of inflation, one analysis regularly crops up in public debate: the idea, derived from the quantitative theory of money, that inflation is always the result of excessive money creation. This interpretation is not neutral, as it has had a major impact on monetary policy, and therefore on economic life.
The aim of this fact sheet is to clarify the terms of the debate, to show how complex the relationship between money and inflation is, and to demonstrate through reasoning and historical examples that the rise in the general price level is the result of multiple, intertwined factors.
Some key concepts and definitions
Since the aim of this factsheet is to explain the links between money creation and inflation, and to expose the preconceived ideas that fuel the debate, we’ll briefly review some of the concepts that are essential to understanding what follows.
What is inflation?
L’ Insee defines inflation as follows
“Inflation is the loss of purchasing power of money, resulting in a general and lasting increase in prices. It must be distinguished from an increase in the cost of living. The loss of value of money is a phenomenon that affects the national economy as a whole (households, businesses, etc.).
The Consumer Price Index (CPI) is used to measure inflation. This is a partial measure, given that inflation covers a wider field than just household consumption.”
Inflation is therefore an economic phenomenon that results in a general rise in prices and a depreciation of money: with the same amount of money, an economic player can buy fewer things.
If any increase in prices can be considered as “inflation 1 inflation is the increase in consumer prices, i.e., the prices of goods and services consumed by households. It is measured by the Consumer Price Index (CPI).
Without going into the details of how the CPI is calculated, let’s just point out two major limitations of this indicator:
- As INSEE points out, the CPI does not measure the rise in all prices, but only those of goods and services consumed by households. It therefore takes no account of price rises in physical assets (real estate in particular, but also land, commercial leases, intellectual property rights) or financial assets (shares, bonds, derivatives, etc.). Soaring property and financial market prices are invisible in the indicator used to measure inflation.
- To calculate the CPI, INSEE (like other statistical bodies) tracks the prices of a basket of goods and services covering some 350 consumer items. 2 Each product is then weighted according to its weight in average household consumption expenditure, as measured in the national accounts. The CPI is thus calculated on the basis of the basket of an “average” consumer. The latter is, of course, an abstraction. Depending on the structure of their consumption, households will be more or less affected by price rises than the CPI alone would suggest. For example, energy and food account for a large proportion of the consumption of low-income households. A price rise in this type of product therefore has a greater impact on these households than on wealthier populations.
The CPI (and its derivatives) is used to inform and implement a wide range of public policies.
In France, as in many other countries, the CPI is the benchmark. 3 for determining changes in rents, pensions, alimony, life annuities and minimum wages.
Finally, the evolution of the CPI is a determining factor in the choice of monetary policies pursued by central banks. Indeed, from the 1970s-1980s, the mandate of central banks was marked by a focus on maintaining monetary stability. While they have had many other missions throughout history 4 the main role of central banks today is to maintain price stability around an inflation target (measured by the CPI) of around 2%.
If this target is exceeded, they must act. As we shall see later, the doctrine in this area is for central banks to pursue restrictive monetary policies to reduce or halt the growth of the money supply (in particular, by raising their key interest rate, which influences the cost of bank loans). 5
What is money and the monetary aggregates?
Strictly speaking, money is a tool used to make a payment or extinguish a debt.
Legal tender cannot be refused by a creditor. It is materialized by various instruments:
- Banknotes and coins are called paper money.
- Most money currently takes the form of entries in the current accounts of economic players: this is scriptural money.
Economic agents also have savings books or financial investments that cannot be used immediately to make a payment (they are said to be more or less liquid). 6 ). For example, sums placed in a savings account cannot be used directly to pay a bill: at the very least, you have to transfer them to your current account, or even ask your bank for authorization (and possibly pay an exit fee) before you can use them.
Today, these sums are also considered scriptural money.
Money supply refers to the total quantity of money in circulation in an economy.
But it’s not so easy to understand. Indeed, as we have just seen, money is made up of different types of more or less liquid instruments.
This is why central banks divide the money supply into aggregates that fit together like Russian dolls, moving from the most liquid instruments to the least liquid.
The European Central Bank distinguishes and monitors three interlocking monetary aggregates: M1, M2 and M3.
M1 is the narrowest aggregate: it refers to money in the strict sense of the term, i.e. money that is immediately available for settlement (i.e. coins and banknotes in circulation and sums available on current accounts).
M3 is the largest aggregate.
Understanding the various monetary aggregates in the euro zone
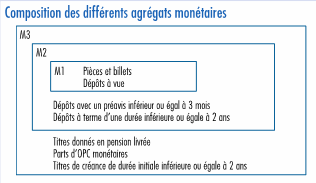
Source Bulletin de la Banque de France, 224/5, July-August 2019
Money circulating in the economy is created by commercial banks.
When they grant credit to economic players, banks create money ex-nihilo through a simple set of accounting entries. This money is then destroyed when the loan is repaid. For the money supply to increase, the volume of loans granted must exceed the volume of loans repaid. Today, money exists mainly through debt. This is why we speak of debt-money or credit-money.
Central banks have a number of tools at their disposal which enable them to influence money creation by banks. In particular, the key rate set by central banks influences all other rates in the economy (market rates, lending rates). Central banks also create the “central money” that commercial banks need to settle their accounts with each other. Most of this central money does not circulate in the economy, but only between banks and the central bank. 7
However, the tools available to central banks are limited. Ultimately, the main vector of money creation remains the demand for credit from economic players, and the greater or lesser ease with which banks grant such credit.
Over the last few decades, money supply (whatever the aggregate considered) has continued to increase, as shown in the graph below.
Money supply trends in the eurozone (1980-2022)
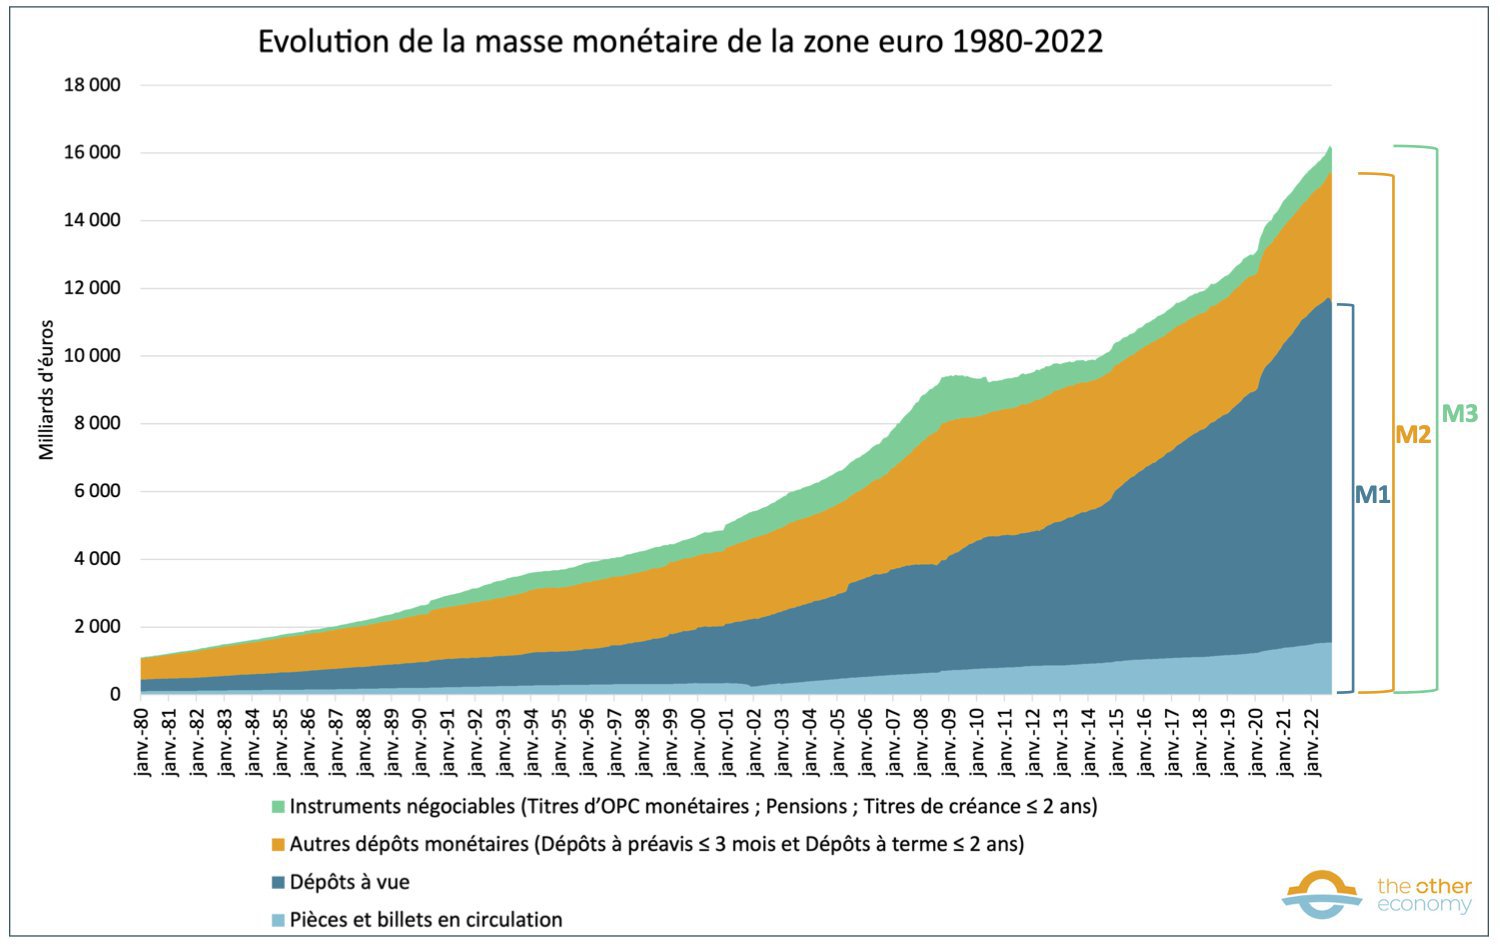
Source European Central Bank, “Monetary developments in the euro area”, November 2022. To access the long series, simply click on the figures in the PDF document.
Find out more
To understand everything about money, the monetary system and money creation, consult the dedicated module and in particular the following items:
The quantitative theory of money is wrong
According to the quantitative theory of money, any variation in the quantity of money in circulation in the economy would lead to a proportional variation in the general price level.
Clearly, more money would always mean inflation. Conversely, all inflation would necessarily have a monetary origin.
A theory that has spanned the entire history of economic thought
Frenchman Jean Bodin is credited with laying the foundations of this theory in a work published in 1568 8 in which he highlighted the role of the massive influx of gold and silver from the New World in driving up prices.
Classical economists took up this analysis. As Jean-Baptiste Say (1767-1832) put it, “money is a veil over exchanges”. It would be neutral and have no impact on economic activity other than influencing the general price level.
Neoclassical economists built their general equilibrium model of the economy along these lines, without incorporating either money or credit. 9
Contested in the 1930s, particularly in the work of British economist John Maynard Keynes (1883-1946), this theory was revived in the second half of the 20th century under the influence of monetarist economists, whose views gained notoriety following the inflationary shocks of the 1970s.
“Inflation is always and everywhere a monetary phenomenon, in the sense that it is and can only be generated by an increase in the quantity of money that is faster than that of production”.
Any increase in the money supply would lead to a proportional change in the general price level, and therefore have no impact on economic growth. State intervention in monetary policy would therefore be useless, if not harmful.
This current of economic thought has had a major influence on monetary policy. In particular, it was behind the wave of central bank independence in the 1980s and the restriction of the role of central banks to the sole control of price stability. In this respect, he largely inspired the Maastricht Treaty, which gave birth to the single European currency.
The quantitative theory of money is based on questionable assumptions
It was the American economist Irving Fisher who formalized this theory in 1911 in a famous equation known as the “quantitative equation of money”:
M x V = P x Y
- M represents the money supply in circulation,
- V is the velocity of money circulation (which refers to the average value of transactions carried out with a monetary unit over a given period: if V=3, this means that on average over the period in question, €1 financed €3 of exchanges).
- P the general price level
- Y production volume (goods and services subject to monetary transactions).
At first sight, this equation is indisputable: it’s a simple accounting identity.
The value of transactions in an economy (i.e. the volume of output Y multiplied by the general price level P) is necessarily equal to the quantity of money circulating in the economy multiplied by the speed of circulation of this money.
However, to deduce from this that an increase in the money supply M necessarily leads to a general rise in prices P, as Irving Fisher and the proponents of the quantitative theory of money do, is far from self-evident.
For this to happen, two conditions must be met:
1/ The velocity of money circulation must be constant, which is not the case in reality, as can be seen from the graph below.
For example, it’s quite possible that V will slow down. In a depressed economic context, economic agents may adopt cautious behavior and increase their savings rather than purchase goods and services. They may also decide to invest their money in order to earn a return. Finally, they may also be prevented from consuming, as was the case during the confinements prompted by the health crisis.
Velocity of money circulation in the United States from 1960 to 2022 (annual average)
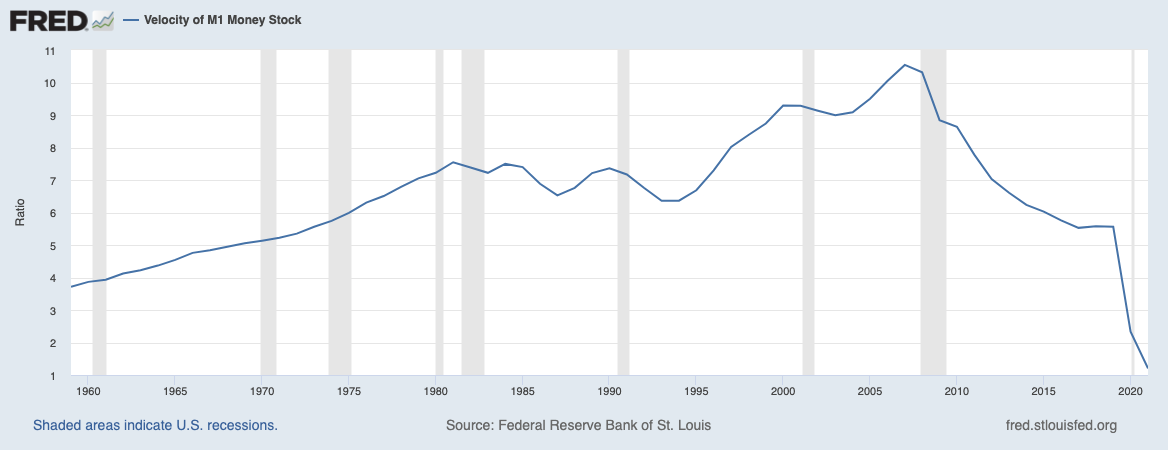
Source Fred Economic Data: Velocity of M1 Money Stock, Federal Reserve Bank of St. Louis (accessed January 2023)
2/ Production (Y) must be constant
For example, an increase in the money supply must not lead to an increase in production: the new money available must not be used to buy new products.
This implies that the economy is at full employment of the factors of production (i.e. companies cannot satisfy new orders). This is obviously far from always being the case, as the English economist John Maynard Keynes demonstrated in the 1930s.
In a recessionary economy, where households are “tightening their belts” and companies are unable to sell their products or are even closing factories, an increase in money in circulation (for example, in the form of public subsidies to households) can lead to an increase in consumption and therefore an increase in production (either because companies are selling off unsold goods or because they are bringing under-utilized means of production on stream).
Another example: an increase in the money supply resulting from additional credit to companies for productive investments (such as machinery) can lead to an increase in production (provided that this production can actually be sold). Money is therefore not neutral with regard to economic activity, as monetarist economists claim. 11 . The injection of new money can have an effect on the volume of goods and services traded.
The relationship between money and inflation is more complex than the quantitative theory of money suggests
Money creation is not necessarily inflationary
The influence of money on the general price level depends on a number of factors: economic activity, the quantity of money created, the economic players or sectors that benefit from it, and its speed of circulation. The link between changes in money supply and inflation (rise in CPI) is not proven, as shown by the graph below, which compares annual changes in M1 money supply with the inflation rate (measured by the HICP, the harmonized inflation indicator used in the European Union) in the euro zone.
Comparison between the annual inflation rate and the annual increase (in %) in the M1 money supply in the eurozone (1998-2021)
MISSING DATAVIZ: comparaison-entre-le-taux-dinflation-annuelle-et-le-laugmentation-annuelle-en-de-la-masse-monetaire-m1-dans-la-zone-euro-1998-2021A few examples illustrating the influence of money on prices
a) If money creation is used to finance investment in the productive economy (R&D, investment in renewable energies, infrastructure, education, etc.), it is not inflationary, since it helps to develop the productive apparatus and thus ultimately increase output.
b) If money creation is used to boost consumption or investment in a country where factors of production are under-utilized, it is theoretically not inflationary, since it increases aggregate demand.
c) If money creation feeds consumption but not investment, then it can be inflationary (all the more so if its speed of circulation in the real economy is very high) if the country’s production capacities are fully utilized. In fact, it can lead to an increase in aggregate demand when production cannot keep pace.
d) If money creation increases but does little or nothing to fuel the productive economy (as we have been observing for several years), it is not inflationary either (in the CPI sense!). It can, however, lead to a rise in financial asset prices or property prices…).
e) If money creation feeds the productive economy at a time when a production sector (or even the entire productive fabric) is slowing down for reasons external to economic activity (war, supply problems), then it can create an imbalance and feed inflation.
These examples illustrate the key role that money creation can play in the economy. Indeed, if the newly created money feeds sectors where supply can increase or demand is low (examples a and b above), then it is non-inflationary. If money creation made it possible to finance forward-looking projects (such as the ecological transition), it would be non-inflationary. On the contrary, it could even help moderate inflation if the investments in question led to a reduction in the costs borne by households and businesses, particularly energy bills. 12
Furthermore, upward pressure on the level of consumer prices due to money creation means that the new money has either not contributed to the creation of activity, or that its quantity has been too large in relation to the level of production.
In fact, when an external shock occurs (shortages, wars, floods…) and production slows down, money creation must adjust to the country’s overall production level, or be invested (as explained above) to help increase productive capacity. Otherwise, it can lead to inflation.
The causes of inflation cannot be reduced to a simplistic theory
Many phenomena can lead to an increase in the general price level
Without claiming to be exhaustive, here are a few examples of phenomena that can lead to inflation.
Imported inflation: commodity supply shocks and the influence of the exchange rate
Events of various origins (geopolitical, natural disasters, unilateral decisions by dominant economic players on a market, etc.) can lead to an increase in the price of raw materials on world markets. Depending on the extent to which these raw materials are used in the various economic sectors, and the duration of this rise, it can be passed on to the prices of other goods, thus triggering inflation. This is what happened, for example, with the oil shocks of 1973 and 1979-1980.
Since early 2022, the war in Ukraine has amplified the rise in prices of fossil fuels (Russia being a major producer of gas and oil) and food products (Ukraine being a major exporter of grain and fertilizers).
The destabilization of global supply chains following multiple containments (particularly in China) played an important role in driving up prices, leading to shortages of raw materials or processed goods (e.g. semi-conductors) in multiple sectors, and causing some industries to slow down or even halt production. All this against a backdrop of rising demand (as both consumers and producers increased their demand for products coming out of containment).
Changes in the exchange rate are another factor that exacerbates inflation, as they lead to an increase in the price of imported goods and services. Indeed, when an economic agent imports a product and pays for it in a foreign currency, if its domestic currency depreciates against the foreign currency, then the price of the imported product rises. Given that the majority of raw materials are quoted in dollars (over 80%), the rise of the dollar in 2021 has greatly increased the price of raw materials for countries outside the United States.
Money creation in a slow economy
If production slows down for structural and/or cyclical reasons (crises, wars, etc.) and the quantity of money injected into the real economy continues to grow faster than economic activity, then money creation also leads to a general rise in prices.
This was particularly true during the Great War. 13 when money creation fuelled “war inflation” or, more recently, during the coronavirus crisis of 2020-2021, with a historic rise in central bank balance sheets and in the volume of credit to households and businesses, at a time when the world was confined and the economy temporarily at a standstill.
The price-wage loop
Until the 1980s, in most Western countries, wages were indexed to inflation (measured by the CPI): each year, they were revalued upwards in proportion to inflation. Thus, during the 1970s, a decade marked by high inflation linked to the two oil shocks, wages were automatically indexed to the consumer price index.
This creates a wage-price loop: higher wages increase production costs, which are passed on to companies in the form of higher sales prices, triggering a further increase in inflation. These two phenomena reinforce each other, leading to an unstoppable inflationary spiral.
Although most wage indexation to inflation came to an end around the 1980s (in France in 1983, at the time of the “austerity turn”), a rise in prices can still lead to a wage-price loop today. Inflation, by causing a loss of household purchasing power, can lead to wage demands. However, a recent IMF study 14 shows that price-wage loops are not systematic, and that an increase in nominal wages during a period of inflation does not always imply the creation of a price-wage loop.
Corporate pricing policies
Some companies may take advantage of the inflationary context to increase their margins, thereby fuelling price rises. This is particularly true of companies with a high degree of market dominance (monopolies or oligopolies). This is particularly true in the United States, as shown in the graph below.
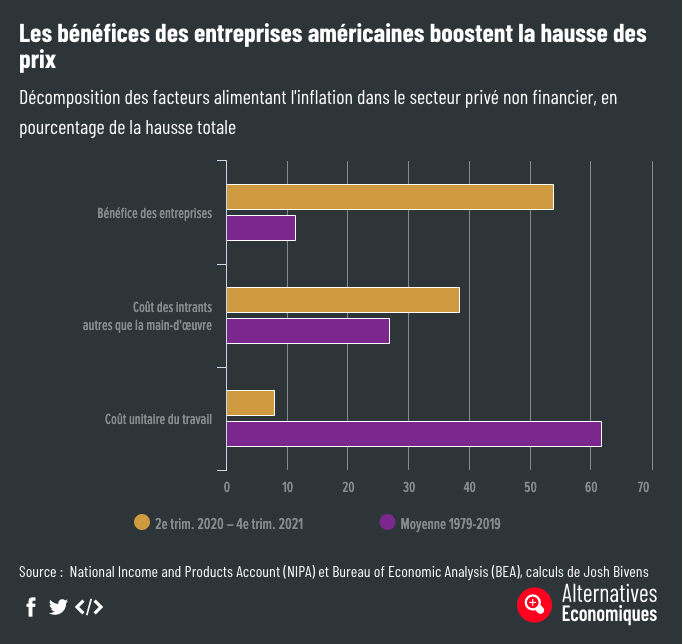
Source Les vraies raisons de l’inflation aux Etats-Unis et quatre autres infographies à ne pas rater, Alternatives Économiques, May 6, 2022
Some historical examples showing the importance of different sources of inflation
Numerous past events show that inflation is a complex phenomenon that cannot be traced back to a single phenomenon.
The hyperinflation of the Weimar Republic in Germany is certainly the most illustrious example.
Following the Treaty of Versailles on June 28, 1919, Germany, forced to pay off its war debts, turned to the financial markets for financing. During this period, the country suffered from a large trade deficit and increased speculation on its currency, leading to a steady depreciation of the mark against foreign currencies. This situation led to an increase in the price of imported goods and a consequent rise in wages (which were then indexed to prices). An inflationary spiral began, and the Germans gradually lost confidence in their currency. Between July 1919 and February 1920, inflation reached 400%!
Despite an economic upturn in 1921, speculation and mistrust of the mark increased due to the British government’s demand that Germany pay war reparations or face occupation by the Allies.
With inflation already very high and the public’s confidence in the mark virtually gone, Chancellor Friedrich Ebert resorted to continued printing of banknotes. The chaotic situation worsened, accentuating the hyperinflationary episode. Germany managed to emerge from the situation thanks to a change of currency (the mark became the rentenmark) led by financier Hjalmar Schacht in early 1924.
To find out more, see The Weimar hyperinflation: some lessons to be learned.
The inflation experienced by Western countries in the 1970s was mainly due to the rise in oil prices.
The episode of high inflation in the 1970s was also linked to phenomena other than an increase in the money supply. In October 1973, with inflation reaching 6-7% in the United States and Western Europe 15 ), the United States declared its support for Israel in the Yom Kippur War. Against this backdrop of geopolitical conflict, the OPEC countries 16 countries decided to raise the price of a barrel by 70% and reduce their production, which led to a de facto rise in the price of oil on world markets(a 3-fold increase between 1973 and 1974), and in the price of most goods and services.
Crude oil price trend 1861-2021
MISSING DATAVIZ: evolution-du-prix-du-baril-de-petrole-crude-oil-1861-2021Source BP, Statistical Review of World Energy, 2022
In 1974, inflation reached almost 11% in the United States, and 13% in Europe. 15 During this period, wages were indexed to inflation, rising by 20% in 1974 in the United States, outpacing the general price level. With the famous “price-wage loop” now in place, prices continued to rise. The second oil shock of 1979, linked to the Iranian revolution and the fall of the Shah of Iran, accentuated the overall rise in prices.
In 1981, Paul Volcker, Governor of the U.S. Federal Reserve, applied the quantitative theory of money and decided to sharply raise interest rates by 20%, in order to reduce the amount of money in circulation (by heavily penalizing the credit that had generated it). This decision plunged the U.S. and world economies into a deep recession, and contributed to slowing inflation.
Other phenomena also contributed to this slowdown, and then to the maintenance of limited inflation: the oil counter-shock from 1982 onwards (the price per barrel in dollar terms fell by a factor of 3 between the beginning and end of the 1980s), political decisions to end wage indexation, and then the beginning of the effects of globalization with competition from low-wage countries.
Zimbabwe’s hyperinflation at the turn of the 20th century
The case of Zimbabwe is another convincing example. In 1997, at a time when the country’s economy was essentially based on agriculture (the country was considered the “breadbasket” of southern Africa) and Zimbabwe was facing major economic difficulties, the government announced a land reform program. However, the anticipated results of this reform were not considered to be very productive.
Within a month of this announcement, the country was hit by massive capital flight and a widening current account deficit. A currency crisis ensued, and the Zimbabwean dollar depreciated by 75% against the US dollar.
As with German hyperinflation, an inflationary spiral began: the price of imported goods rose sharply, wages were indexed to inflation, and confidence in the currency waned. In 1999, inflation reached 60% and the budget deficit was 7.5%. In addition, Zimbabwe had a multilateral public debt of $4.5 billion, which it was unable to repay due to a lack of foreign currency. 18 Hyperinflation continues, reaching 208% in 2002, 1,281% in 2006 and 76,348% in 2007.
Source: Daouda Drabo, De la réforme agraire à l’hyperinflation : l’expérience zimbabwéenne (1997-2008), Revue de la Régulation, 2018.
A few points to remember
- The CPI index is a methodological tool that reflects the rise in consumer prices, but does not give a true measure of a household’s cost of living, and cannot be used to understand the influence of money on prices.
- To understand the relationship between money and inflation, we first need to distinguish between the evolution of the CPI index and that of financial and real estate assets.
- Money is not neutral with regard to economic activity, and the speed at which money circulates is not constant. In fact, the influence of money on prices depends on many factors, including the increase in economic activity it can generate and the state of the production system at time T.
- Contrary to popular belief, inflation can result from something other than an increase in the money supply, as shown by the various examples cited in Chapter 2.
- The quantitative theory of money is wrong: not every change in the quantity of money leads to a similar change in the general price level.
- Depending on the origins of inflation and the reaction of the economy and politicians to it, inflation can be contained, or it can grow continuously and lead to an episode of hyperinflation.
Find out more
- Alain Grandjean, “Neutrality of money”, Chroniques de l’Anthropocène
- On the controversies surrounding the inflation indicator: Florence Jany-Catrice, “L’indice des prix à la consommation”, éditions La Découverte, 2019.
- Momar Diop, “Étude critique de la théorie quantitative de la monnaie dans l’histoire des crises des prix”, University of Burgundy, 2014.
- Alain Grandjean, “La monnaie est créée, ex nihilo, d’un simple jeu d’écritures par les banques: un fait empirique”, Chroniques de l’Anthropocène, October 3, 2018
- “Inflation isn’t the same for everyone and 4 other infographics not to be missed”, Alternatives économiques, June 30, 2022.
- Blair Fix, “The Truth About Inflation: Why Milton Friedman Was Wrong, Again”, Evonomics, November 24, 2021.
- A return to inflation? The rout of economic thought – Olivier Passet (2022)
- In the etymological sense of the word: inflatio in Latin means “swelling”. ↩︎
- This is the Coicop (Classification of individual consumption by purpose), an international nomenclature drawn up by the United Nations Statistics Division, which classifies household consumption expenditure according to purpose: food, alcohol and tobacco, clothing, housing, furniture, household goods and routine household maintenance, health, transport, communication, leisure and culture, education, restaurants and hotels, etc. The Coicop nomenclature is used to classify household consumption expenditure according to purpose. ↩︎
- In reality, indices derived from the CPI are often used. For example, the minimum wage is revalued not according to changes in the CPI, but according to the index of “households in the first quintile of the distribution of living standards” (a variation of the CPI in which the consumption structure of the 20% of French households with the lowest standard of living is taken into account, rather than the average consumption structure of a French household). ↩︎
- For example, ensuring financial stability or supporting the financing needs of governments. Find out more in the Money module. ↩︎
- To find out more, see the section on Monetary policy and its limits in the Money module. ↩︎
- See our fact sheet explaining what liquidity means ↩︎
- To be precise, the monetary base comprises banknotes circulating between economic agents and scriptural money circulating only between banks. ↩︎
- Réponse aux paradoxes de M. de Malestroict touchant l’enrichissement de toutes choses et le moyen d’y remédier, 1568. Nicolas Copernicus, with his Monetae Cudendae Ratio (1526), is also a precursor of this theory. ↩︎
- Even today, most macroeconomic models used by major public institutions do not represent money or credit (see the section on macroeconomic models in the module on GDP). ↩︎
- Milton Friedman, “Counter-Revolution in Monetary Theory. Wincott Memorial Lecture, Institute of Economic Affairs”, Institute of Economic Affairs, Occasional paper 33, 1970. ↩︎
- Monetarists recognize that an increase in the quantity of money in circulation can stimulate economic activity in the short term. However, this effect is neutralized in the medium term: economic agents anticipate a rise in inflation when the money supply increases, and adapt their behavior accordingly (by not consuming or investing more). ↩︎
- See Rupert Way, Penny Mealy, J. Doyne Farmer, Matthew Ives, “Empirically grounded technology forecasts and the energy transition“, INET Oxford Working Paper, n°2021-01, 2021. ↩︎
- Pierre Bezbakh, “Comment les belligérants ont financé 1914-1918”, Le Monde, April 11, 2014. ↩︎
- Jorge Alvarez et alii, Wage-Price Spirals: What is the Historical Evidence? IMF Working Papers, 2022. ↩︎
- Source: Inflation, consumer prices (annual %) – United States, European Union, World Bank. ↩︎
- Organization of the Petroleum Exporting Countries (OPEC) ↩︎
- Source: Inflation, consumer prices (annual %) – United States, European Union, World Bank. ↩︎
- To find out more about the problems involved in taking on debt in a foreign currency, see the section ” Not all countries are equal when it comes to public debt ” in the Public debt and deficit module. ↩︎