
This text has been translated by a machine and has not been reviewed by a human yet. Apologies for any errors or approximations – do not hesitate to send us a message if you spot some!
In 1962, one of the aims of the Common Agricultural Policy (CAP) was to bring farmers’ incomes, which at the time were well below those of other professions, into line with those of manual and clerical workers. Even if farmers’ incomes remain modest, they are close to those of the categories mentioned or to those of the self-employed in commerce. However, it is difficult to compare incomes between professions that operate differently. How can we integrate ancillary income, working hours or capitalization of the means of production?
In France, agriculture has become a heavy industry, requiring a lot of means of production (land, machinery, buildings). Farmers are at the head of businesses with often imposing assets, and they often choose to reinvest rather than earn a higher income. Debt levels are high, but under control. In this section, we look at how farmers’ incomes have evolved over time, and conclude with a comparison of these incomes with those of other professions.
Farmers’ income is hard to apprehend
Producers of agricultural statistics use different perimeters
The French Ministry of Agriculture, Mutualité Sociale Agricole (MSA) and INSEE produce data on agriculture and farmers. As we shall see, the different perimeters make the figures difficult to compare. As far as income is concerned, monitoring indicators are not always the same.
It should be added that the figures are published with considerable lead times: those used to update this data sheet (January 2024) generally concern the year 2020 (at best 2021). This is obviously problematic for income analyses, and all the more so in the inflationary context we’ve been experiencing since 2022.
This diversity is reflected, for example, in the figures for the number of farms, the number of farmers and, more generally, agricultural employment.
The Ministry of Agriculture’s Service Statistique et Prospective (SSP) has published the results of the 2022 results of the decennial agricultural census of 2020.
The perimeter is that of farms, i.e. agricultural production units with their own day-to-day management and exceeding a minimum surface area (1 ha or 20 ares for specialized crops) or production threshold (estimated in livestock, volume). See the exact definition on the Agreste website.
With this perimeter, in 2020 there were 390,000 farms and 496,500 farm managers and co-managers in mainland France, plus 26,657 farms and 27,136 farm managers and co-managers in the French overseas departments.
Between decennial censuses, the SPP publishes an annual agricultural employment report. The latest edition, however, covers 2019.
The MSA (agricultural social security) regularly publishes an overview of the population of farmers and farm managers. 1 .
The scope is different from the previous one: it includes activities not covered by the SSP (the wood industry, forestry, timber operations, fixed sawmills; certain sea-related professions, shellfish farming, coastal and freshwater fishing, aquaculture, salt marshes; agricultural, gardening, landscaping and reforestation companies; certain equestrian professions), and excludes farmers or farm managers who don’t meet certain criteria (basically, players who are too small).
With this perimeter, in 2020 the MSA will count 311,000 farms and 3,4500 farm businesses, as well as 435,790 farm or farm business managers (including 399,000 farm managers and 37,000 farm business managers).
Since 2019, INSEE has been publishing a publication devoted to the incomes of non-salaried workers, and collaborating with MSA for data relating to the world of agriculture.
The perimeter is therefore fairly close to that of the MSA, but INSEE does not include certain sectors (seafaring, equestrian professions, etc.).
With this perimeter, the number of non-salaried agricultural workers will reach 427,000 in 2020 for the whole of France excluding Mayotte (including the French overseas departments), and 422,000 in 2021. We’ll use this data in section 4 on income.
Some key data from the 2020 agricultural census
There were 390,000 farms in France, 100,000 fewer than in 2010, and four times fewer than in 1970 (26,000 farms in the French overseas departments).
Utilized agricultural area (UAA) in mainland France stands at 26.7 million hectares (134 thousand in the French overseas departments). This represents a decline of less than 1% on 2010. UAA occupies 49% of the territory (compared to 54.4% in 1970).
The average UAA of French farms has increased steadily over the past 50 years: 19ha in 1970, 55 in 2010, rising to 69 ha in 2020 (5ha in the French overseas departments). Farms larger than 100ha account for a quarter of all farms today, compared with 2% 50 years ago. 5,000 farms have zero UAA: only the buildings are used for agricultural production (mainly pig and poultry farming).
In France, 758,000 people work on farms on a “permanent” basis (i.e. for more than 8 months), down 21% since 2010. In terms of work volume, this represents 583,000 FTEs (full-time equivalent). 2 ), to which must be added 75600 FTEs for seasonal workers, for a total of 659,000 FTEs (down 10% on 2010).
There are 496,500 farm managers (-17.8% since 2010), representing 391,000 FTEs. Nearly 45% of them are over 55.
Source The main results of the 2020 decennial agricultural census can be found on the statistics website of the French Ministry of Agriculture. They are also available in dataviz.
The economic results of farms provide information on farmers’ incomes
In a publication devoted to the evolution of farm income in France over the past 20 years, the Conseil général de l’alimentation, de l’agriculture et des espaces ruraux (CGAER) also notes the multiplicity of data sources on farm income.
Summary table of differences in scope and data on farm income by source
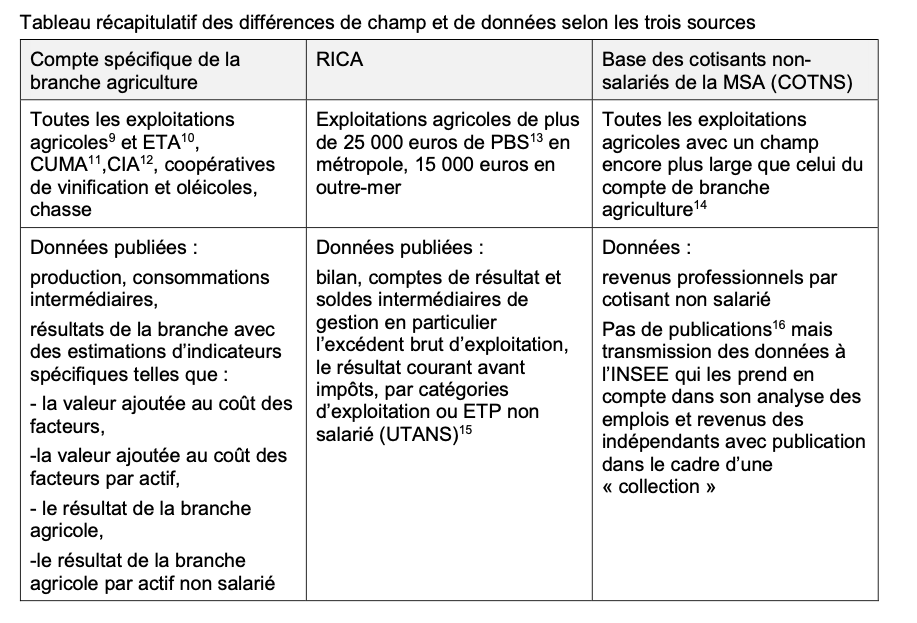
Source Trends in farm income in France over the past 30 years, factors for change between now and 2030 and lessons to be learned for policies implemented by the Ministry of Agriculture and Food – CGAAER Report (2022)
To express “farm income”, statistical organizations generally base their calculations on farm results, i.e. the balance of expenses and income.
For example, the Annual Accounts for Agriculture 3 identifygross operating surplus (EBE) and operating income (or current income before tax – RCAI), while MSA highlights professional income. Disposable income is also sometimes used.
None of these data correspond entirely to farmers’ incomes: they are at best approximations. It is therefore difficult to compare them with income from salaried professions. For example, a farmer can use his operating income to remunerate himself, but also to invest in his farm.
It is useful to look at the private levies when available. It’s this line that comes closest to the “salary”, and gives an appreciation of what farmers have available for day-to-day living. It should be noted, however, that the private levy can be higher than the operating income (in which case this is the result of an increase in the farm’s debt).
The operating income (RCAI), for their part, give an appreciation of what the farmer earns in the broadest sense, including what he capitalizes through his farm, and which he may be able to resell at the end of his career.
EBITDA is the sum of operating income and financial income, minus the sum of operating expenses and financial expenses. EBITDA is an indicator for measuring a company’s profitability. It is calculated before income tax.
Not all farmers are included in farm economic analyses
Most economic data on farms comes from the annual Rica survey (Réseau d’information comptable agricole). Harmonized throughout the European Union, this survey collects detailed accounting and technical-economic data from a sample of farms.
Within this framework, farms (within the scope of the agricultural census) are classified according to their economic size, based on their standard gross production (SGP).
Micro-operations (PBS < €25k) are excluded from the analysis.
Definition of standard gross production (SGP)
Through a set of coefficients assigned to crops and livestock, the PBS gives a value to the production potential of farms. It can be used to classify farms into different economic sizes.
Micro farms: SGP less than €25,000 in mainland France and €15,000 in the French overseas departments.
Small farms: SGP between €25,000 and €100,000 (€15,000 and €100,000 in the French overseas departments).
Medium-sized farms: between 100,000 and 250,000 euros
Large farms: Gross operating income over 250,000 euros.
Source See the complete definition of the PBS, its history and conversion factors on the Agreste website.
According to the 2020 agricultural census, micro-farms are still a reality in the farming world.
Although their economic weight is low (less than 2% of total gross farm income), they still account for 31% of farms, 12% of agricultural employment (in FTEs) and the remainder (in FTEs). 2 ) and 5% of French UAA (excluding Mayotte). 4 .
If we take an economic view (that of farming organizations or statistical organizations), these micro-operations count for little in the description of the sector, and do not reflect what a farm is today.
On the other hand, if we take a social view, we have to admit that a significant proportion of men and women working in agriculture earn an extremely low income from it. The failure to take this into account in statistics, and hence in publications describing French agriculture (see box), which feed into political discourse, contributes to a distorted perception of this reality, as well as to a feeling of exclusion among these populations.
FADN data are used in the main publications on the economic situation of agriculture in France.
The report presented to the French National Commission for Agricultural Accounts in December of each year (including first estimates of farm results for the previous year). Last edition in December 2023.
Les Résultats économiques des exploitations agricoles – France, published annually (the latest edition covers 2021)
the Graph’agri collection, which presents summary sheets on various themes, including economic data on agriculture. The latest edition, published in early 2023, covers the year 2020.
What information can be drawn from an analysis of the economic situation of farms?
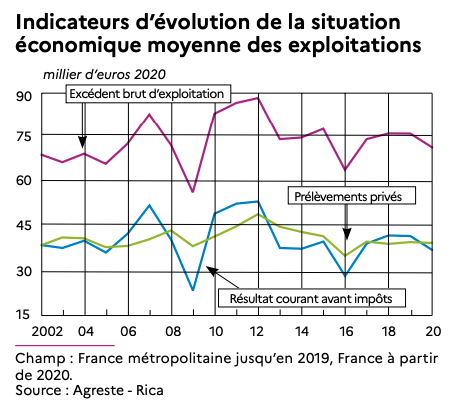
Three indicators of changes in the economic situation of farms (excluding micro-farms) from 2002 to 2020.
While the three indicators evolve in a relatively correlated way, we see greater fluctuations in EBITDA and EBIT than in private withdrawals. In times of crisis, when the farming situation is difficult (in 2008-2009, then in 2013-2017 and in 2020), farmers maintain a certain level of withdrawals necessary to live adequately, to the detriment of cash flow that may be bolstered by short-term loans. Conversely, in favorable periods, such as 2012, private withdrawals increase only slightly (no doubt in order to repay short-term loans to rebuild their operating cash flow).
Source Ministry of Agriculture, Graph’Agri 2022 – Farm results
The publication of subsequent economic data (not yet available in graph form) shows that these three indicators have improved in 2021 and 2022: EBITDA (91k€ then 115.7 k€), EBITDA (55.8k€ then 77k€), Private withdrawals (40k€ then 48.3k€).
According to the graph above, in 2020, EBITDA is around €37k and private withdrawals average around €39k for all the farms studied in the Ministry of Agriculture’s annual report.
However, the situation varies greatly from one farm to another.
Some key indicators by farm size
As can be seen in the following table, while the average private levy per farm is around €39k, it is only €17.6k for small farms and €77.7 for large farms, i.e. around 4.5 times higher.
To assess farmers’ incomes, it is more interesting to look at the data per non-salaried worker on the farm (i.e. the farmer, his or her spouse and any family helpers). In this case, the difference is smaller but still high (x3).
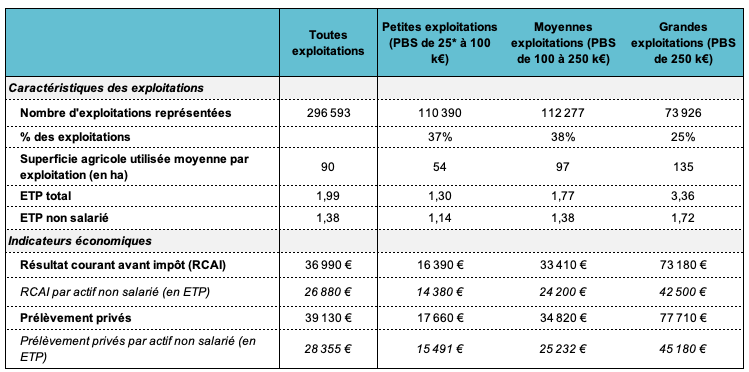
Source Results économiques des exploitations agricoles (RICA) – France Key figures 2020
There are also significant differences according to type of production orientation.
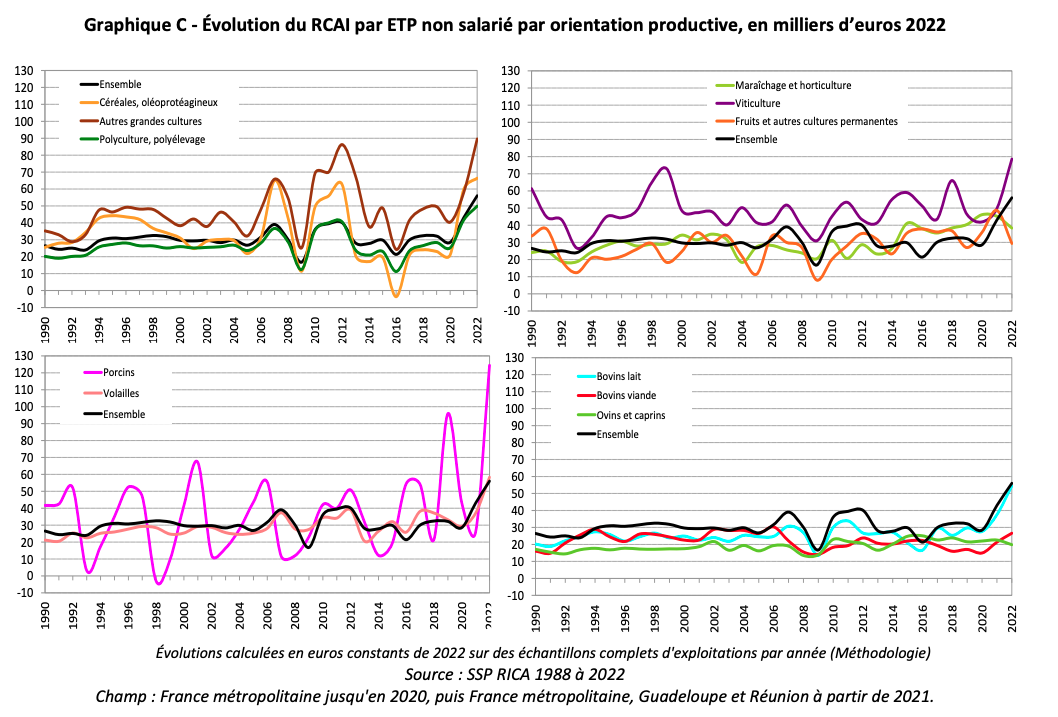
Change in income from ordinary activities with tax (in k€) per non-salaried worker, by type of production 1990-2022 (excluding micro-farms)
There are major differences between the different types of farming: cattle and goat farming generally generate lower EBIT than other types of farming, while viticulture and arable farming do not. In addition, we note the very high volatility of the RACI for pig farming.
Source Report presented to the Commission des comptes de l’agriculture de la Nation – December 2023
Finally, within the same production orientation, the dispersion of operating results can be greater or lesser.
Dispersion of EBITDA (in K€) per non-salaried FTE in 2022 by type of production
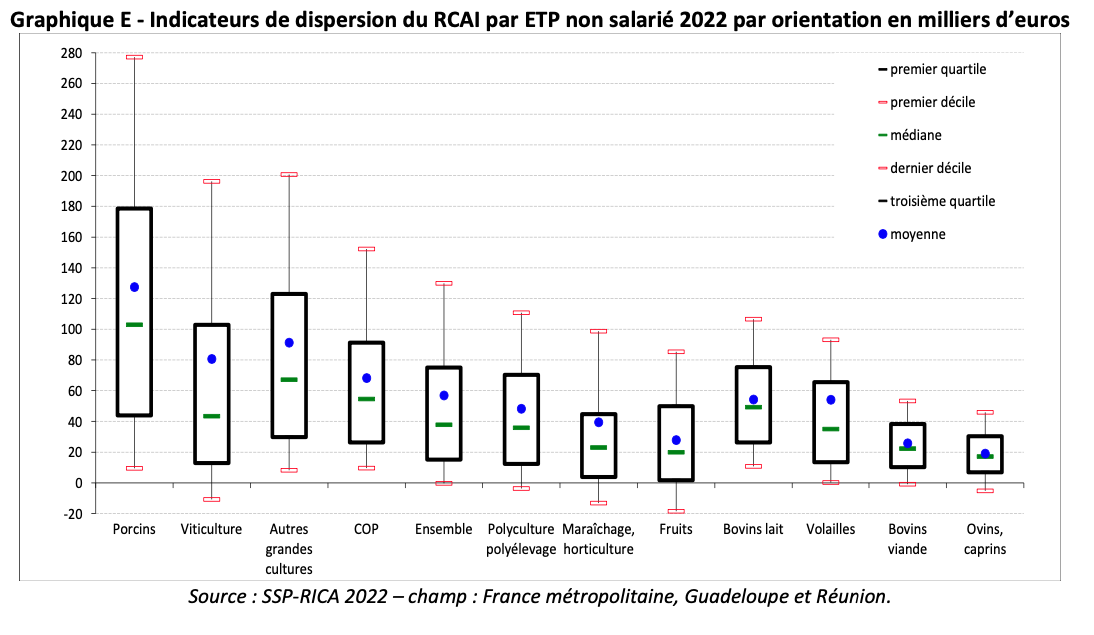
Source Report presented to the Commission des comptes de l’agriculture de la Nation – December 2023 (p. 34 for graph and p. 35 for detailed figures)
Reading: for all farms, the EBITDA per non-salaried asset of the first decile is negative; for the last decile, it is over €130k; the median is around €37.7k and the average €56.8k.
Subsidies and debt are at the heart of farm income
Income highly dependent on European aid
For over 20 years, current farm subsidies in France have hovered around 9.5 billion euros.
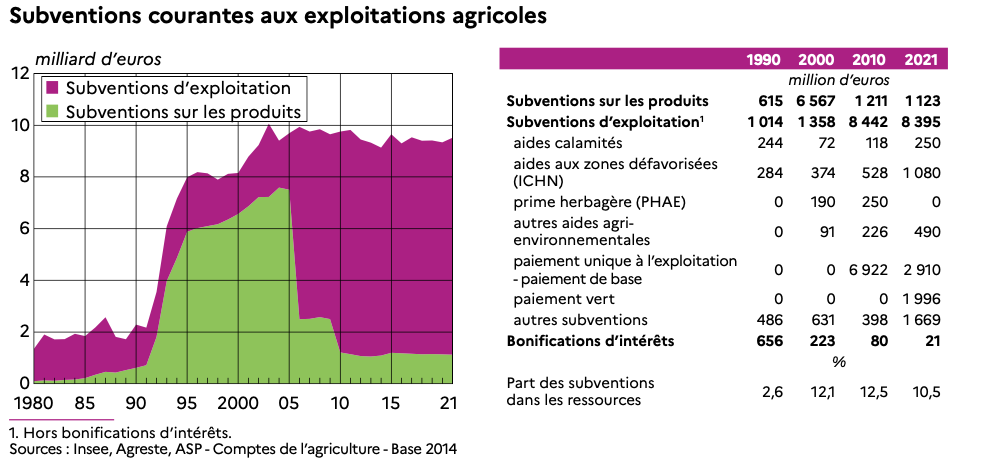
Of this total, the largest share comes from Common Agricultural Policy ( CAP) subsidies. Since 2015, as part of the CAP, the Basic Payments Scheme (BPS) allows farmers to be paid directly according to the areas they own. Independently, therefore, of their production. For France, direct aid paid to farmers under this scheme amounts to around 7 billion euros. This includes all first-pillar aids: basic payments (decoupled aids), green aids, additional payments for young people, etc.
Aid from the first pillar of the Common Agricultural Policy in France (2015-2021)
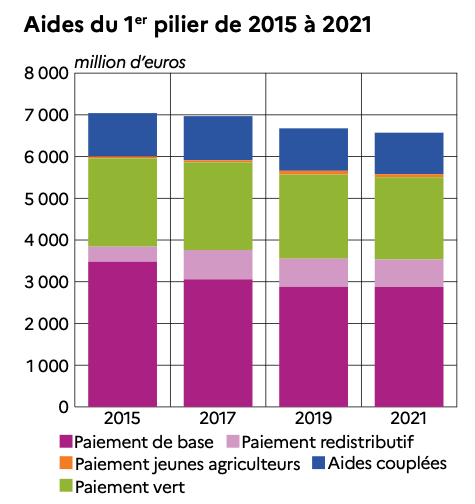
Source Ministry of Agriculture, Graph’Agri 2022 – Agricultural subsidies
According to the Graph’agri 2022 publication, “Operating subsidies paid in 2020 represent on average, for beneficiaries, 16.7% of current income and 46.5% of EBITDA”.
In that year, French farms received an average of €33,498 in subsidies. Without subsidies, 28% of farms would have had negative EBITDA, compared with 4.7% after taking subsidies into account.
Impact of operating subsidies in 2020 by agricultural orientation (excluding micro-farms)
Once again, the situation varies greatly according to the type of farming, whether in terms of the average level of subsidies received (horticulture and viticulture being well below the others) or the importance of subsidies for the viability of farms (beef and sheep production being extremely dependent).
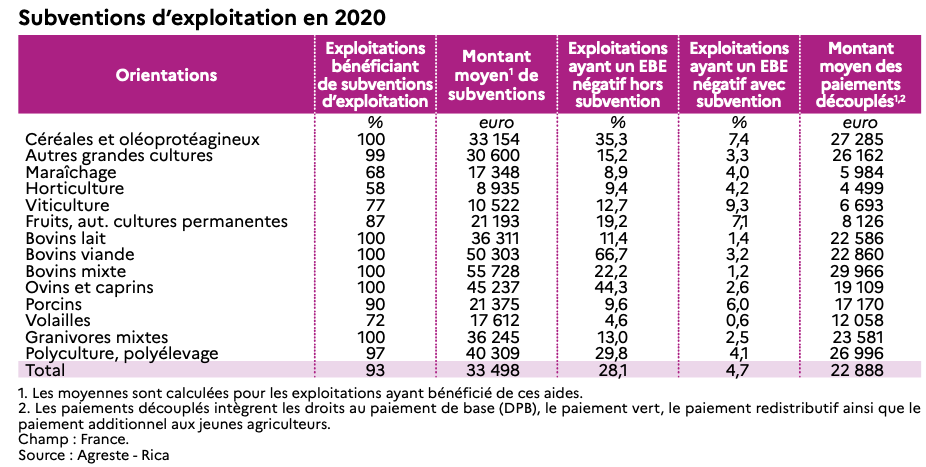
Source Ministry of Agriculture, Graph’Agri 2022 – Farm results.
Subsidies are very unevenly distributed according to farm size
The question of the distribution of agricultural subsidies is not new. The level of aid increases with the size of the farm.
As shown in the table above, in 2020, 93% of farms in mainland France (excluding micro-farms) received an operating subsidy. However, the situation varies according to the type of production, with a much lower proportion in market gardening, horticulture and viticulture.
The amounts received also vary considerably according to farm size.
Concentration of operating subsidies on French farms in 2020 (excluding micro-farms)
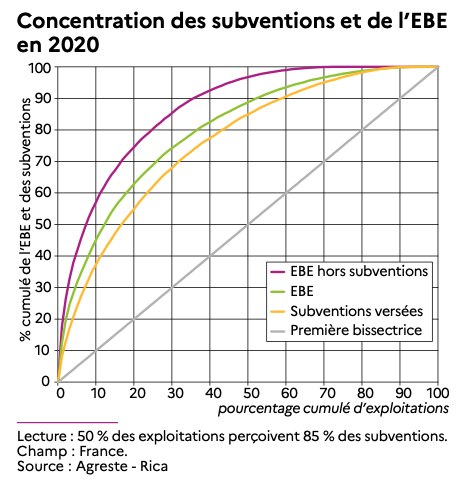
Source Ministry of Agriculture, Graph’Agri 2022 – Farm results
Reading: 17% of French farms received 50% of the subsidies paid out in 2020 (yellow curve).
As explained in Graph’agri 2022, “Overall, the level of subsidies increases with the economic size of the farm. The largest arable farms receive just over three times the amount of subsidies as the smallest structures (€56,500 versus €18,100)”. This trend has deepened in recent years: in 2017, the figures were €36,700 and €15,400 respectively(Graph’agri 2019).
This desire to help farms grow larger in order to reduce costs per unit of output is the result of the choice made when the CAP was launched. This choice has led to social inequality and increased environmental degradation.
In 2019, the French Court of Auditors denounced the highly unequal distribution of aid. “In 2015, 10% of beneficiaries (33,000 farmers) received less than €128 per hectare in decoupled direct aid (basic payment entitlements), while at the other end of the distribution 10% of beneficiaries received more than €315/ha.” 5 The way in which direct aid is distributed thus favors large farms and those with the most profitable activities.
Weakened by debt?
The average debt level of French farms is high. The debt-to-assets ratio has risen by more than 5 points since the 1990s, and has hovered around 42% since the early 2010s.
It differs, of course, according to the size of the farm: for example, the average debt ratio in 2020 will be 50% for large farms, compared with 29% for small ones (source: FADN – 2020).
The debt ratio also fluctuates according to economic orientation: pork and poultry farms have debt ratios of over 60, while winegrowers and beef cattle farmers have debt ratios of close to 30%.
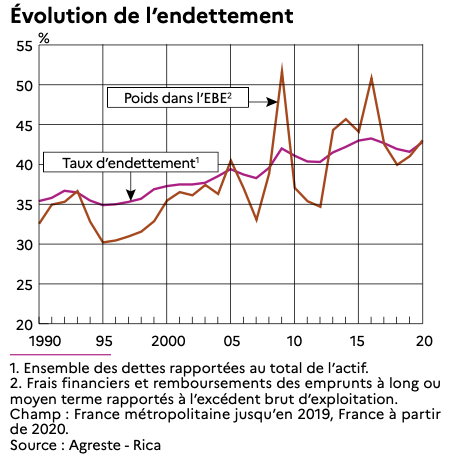
Source Ministry of Agriculture, Graph’Agri 2022 – Farm results. (The perimeter is that of the FADN: micro-farms (PBS < 25k€) are therefore not taken into account).
Indebtedness includes financial debts (owed mainly to banks) and debts to third parties (owed to social organizations, suppliers or the State). Financial debts represent 75% of indebtedness, non-financial debts 25% (FADN – 2020).
With regard to financial debts, low interest rates in recent years have helped to limit the burden of interest payments, and hence the financial charges weighing on farms. However, the situation is likely to worsen with the rise in interest rates from 2022 onwards.
According to a study by the Fondation pour la Nature et l’Homme 6 outstanding farm loans totaled 56 billion euros in 2018. That same year, 11.2 billion euros in new loans were taken out.
- Short-term loans (1/3) are linked to the production cycle: purchase of fertilizers, seeds, pesticides, livestock feed, small equipment, etc. They are provided by banks, cooperatives or private agri-supply companies.
- Medium- and long-term loans account for 2/3 of private financing for farmers (and 90% of bank financing). They finance capital expenditure on farm equipment, vehicles, buildings and their renovation…
Among capital expenditure, purchases of equipment and tools predominate.
Over the last few decades, they have always accounted for at least 2/3 of new investments made by farmers. The second item is the construction or renovation of buildings (especially for livestock).
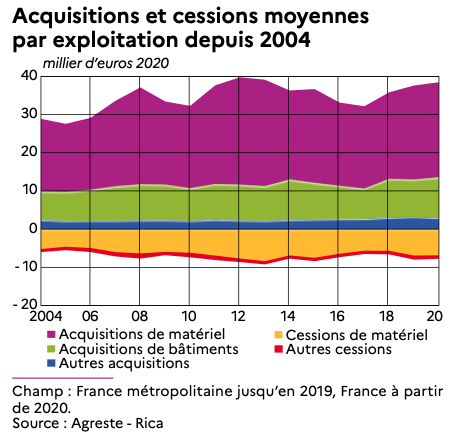
Source Ministry of Agriculture, Graph’Agri 2022 – Farm results. (The perimeter is that of the FADN: micro-farms (PBS < 25k€) are therefore not taken into account).
The reasons for the weight of the equipment item are both rational (purchase of expensive machinery necessary for the business, particularly in viticulture or dairy farming), and tax-related (investment deductions, etc.). 7 ) or the personal appeal of certain types of equipment (over-equipped tractors, drones, etc.).
Some farms are over-equipped, particularly in arable farming, but also in livestock farming: tractors that are too powerful, individual rather than collective combine harvesters, etc. The current trend towards precision farming with drones, GPS systems for fertilizer distribution, etc., will increase the weight of the equipment item.
Comparison with other social categories
The data below is taken from INSEE’s work on self-employed income since 2019. They come from information collected by the MSA (the “social security”). As indicated in part 1, the perimeter of farmers concerned is different from that used for farm economic statistics (which is that of the agricultural census, excluding micro-farms).
Comparison with other self-employed workers
In 2021, 3.9 million people in France will be self-employed, either as their main occupation or as a complement to paid employment. 8 .
While these workers share common characteristics that differentiate them from others (absence of an employment contract and legal subordination to a principal), their profiles are extremely varied.
These self-employed workers include :
- 422,000 self-employed farmers, 78% of whom are subject to the actual profit tax system and 22% to the micro-farming system.
- 1.636 million micro-entrepreneurs
- 1.941 million “classic” non-salaried workers (sole proprietors not covered by the micro-enterprise scheme, and managers of limited liability companies). These include shopkeepers, craftsmen, the liberal professions (law, health, architecture, accountancy, transport, etc.).
Comparison of different income indicators for self-employed workers in 2021
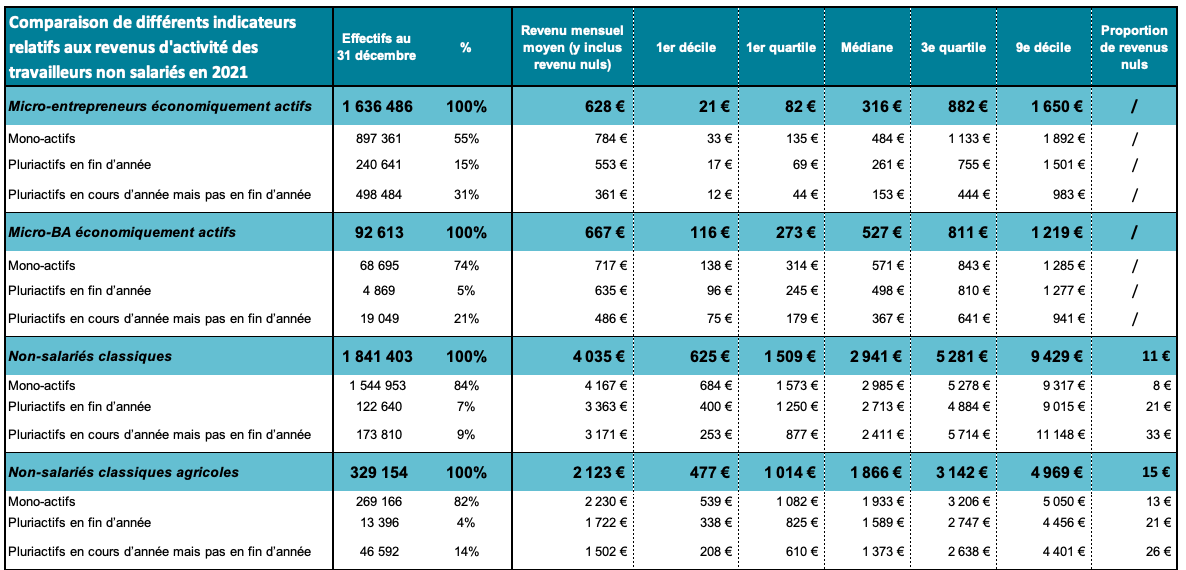
Source Tableaux – Non-salaried workers in 2021 – France -INSEE (2023)
Micro-BA economically active = farmers subject to the micro-bénéfice agricole tax system.
The above table highlights several points.
Pluriactivity is important for all categories of self-employed workers.
This means that a large proportion of them spend at least part of the year in paid employment alongside their self-employed activity. This is particularly true for micro-entrepreneurs. Only 55% of them derive their entire income from their micro-business.
This obviously has an impact on incomes, as those of single-earners are higher. However, it is difficult to compare the figures for multiple earners, as we would need information from other sources.
For example, according to INSEE, the 30% of micro-entrepreneurs who are pluriactive during the year but not at the end of the year will earn a total income (including their salary) of “2,290 euros per month in 2021, of which only 360 euros will come from their self-employed activity”. 8 .
On average, therefore, they are in a more favorable economic situation than single-earners, whose income from employment averages €784.
It would be interesting to have the same information for farmers.
Farmers’ incomes are lower than those of other non-salaried workers.
This is true in all categories and for all indicators: average, median, lowest or highest income.
On the other hand, income inequalities among farmers are less pronounced than among other non-salaried workers. The interdecile ratio D9/D1 9 is 7 for single-earners among farmers (all categories combined) and 12 among others. It should be noted, however, that the “non-agricultural non-salaried workers” category covers a wide range of occupations, and that there are therefore differences in income (and income inequality) between and within each of these occupations.
Comparison with employees
On the employee side, INSEE 10 indicates that in 2019 the average annual wage income for all employees is €21,760. The average monthly salary is therefore €1,813.
Income disparity is also high among salaried workers. The ratio between the 9th and the 1st decile of wage income ( D9/D1 interdecile ratio 9 ) is 14 in 2019. The gap is higher for white-collar workers (14.6) than for managers (6). One of the reasons for this is that this calculation takes into account not only income, but also differences in the volume of work (and therefore voluntary or involuntary part-time work).
On average, farmers are in the lower income bracket, but they have not fallen behind other professions, particularly the self-employed in commerce. The high income dispersion among farmers is also found in other professions.
What really distinguishes farmers from other professions is the dependence of their income on public subsidies and conditions external to their activity (international markets and climatic conditions). Income insecurity is much higher than in other professions.
Find out more
- Main results of the 2020 decennial agricultural census.
- Graph’Agri, 2022 – Statistical service of the French Ministry of Agriculture (used for this data sheet)
- Graph’Agri, 2023 – Service statistique du ministère de l’agriculture (published just after this data sheet was updated)
- Economic results of farms in 2021 – FADN
- Reports presented to the Commission des comptes de l’agriculture de la Nation – Session of December 20, 2023
- Trends in farm income in France over the past 30 years, factors for change between now and 2030 and lessons to be learned for policies implemented by the Ministry of Agriculture and Food (2022)
- Number of non-salaried workers and their income in 2021 – Insee (2023)
- 1988 -2018 statistics from the Farm Accountancy Data Network (FADN)
- The population of farm managers in 2021 – Tableau de bord – MSA (2022) ↩︎
- A full-time equivalent (FTE) corresponds to one person working full-time for a full year (one FTE = at least 1,600 hours worked over the year). ↩︎
- See, for example, Comptes de l’agriculture en 2022, INSEE ↩︎
- Number of farms, UAA, FTE and GVA, by economic size and orientation – 2020 Agricultural Census table ↩︎
- Direct aid from the European Agricultural Guarantee Fund (EAGGF), Cour des Comptes, 2019 ↩︎
- Fondation Nicolas Hulot, Étude des financements publics et privés liés à l’utilisation agricole de pesticides en France, research report, February 2021. ↩︎
- Various tax deduction systems have been introduced over the years to encourage the purchase of equipment. The investment tax deduction (DPI) included the purchase of equipment until 2012; the 2015 Macron law allows farmers to deduct from taxable income 40% of the purchase value of certain investments (notably tractors and generally equipment used for working the land) made between April 2015 and April 2017. ↩︎
- En 2021, les revenus d’activité des non-salariés rebondissent, INSEE Première (2023) ↩︎
- Ratio between the last income decile (the threshold above which the top 10% of earners are located) and the first decile (below which the bottom 10% of earners are located). To find out more about monetary inequality indicators, see our How to measure monetary inequality fact sheet. ↩︎
- Employment, unemployment, labour income, Insee, 2023 ↩︎