
This text has been translated by a machine and has not been reviewed by a human yet. Apologies for any errors or approximations – do not hesitate to send us a message if you spot some!
According to the World Bank, the number of people living in extreme poverty has been steadily declining over the past three decades. The COVID-19 crisis put an end to this trend, with 70 million more people in extreme poverty in 2020 than in 2019. But what does it actually mean to be poor? How do we define poverty in concrete terms? Louis Maurin, Director of the Observatoire des Inégalités, emphasizes the non-trivial nature of this task: “To be poor is to have very little. Defining poverty comes down to defining what that ‘little’ represents”.
This fact sheet provides some answers as to how to characterize poverty in concrete terms. The first possible approach is to analyze poverty from a monetary point of view. To this end, the European Union and the United States have developed their own indicators, while the World Bank has introduced an indicator to define extreme poverty on a global scale. However, poverty cannot be limited to financial considerations. Poverty has a multidimensional character that cannot be overlooked. To this end, indicators to measure “multidimensional poverty” have been developed, highlighting the different facets that poverty can take on. Finally, beyond objective or statistical indicators, the lived experience of poverty has a subjective dimension. Which people consider themselves to be poor? This “felt poverty” does not always correspond to what is measured by some of the commonly used indicators, but it cannot be ignored.
Poverty isn’t just about money
Measuring relative poverty within a country: the European and US cases
Within the European Union, income poverty is defined within each country according to the country’s income distribution. To do this, national and European institutions use the median standard of living in the country, i.e. the standard of living 1 above which half the population lives, and below which the other half lives. Different poverty lines can then be defined: the most common is to consider as poor any person whose standard of living is less than 60% of the country’s median standard of living – this is known as the “at-risk-of-poverty line” (or income poverty line). The at-risk-of-poverty rate (or income poverty rate) is then calculated by dividing the number of people below the at-risk-of-poverty threshold by the total number of people.
Nevertheless, other indicators are sometimes used, considering as poor any person whose standard of living is less than 40%, 50%, 60%… of the country’s median standard of living. In France, for example, until 2008, the commonly used at-risk-of-poverty threshold was 50% of the median standard of living. However, the increase from 50% to 60% of the median standard of living is not without consequences: mechanically, we have observed an increase in the number of people considered poor in France (from 5 to 8.9 million for 2015 data). Basically, by raising the at-risk-of-poverty threshold, the notion of poverty is broadened and no longer has the same meaning.
A comparison of at-risk-of-poverty rates within the EU reveals wide disparities between countries. In 2021, Latvia will have the highest at-risk-of-poverty rate (23.9%.) Other countries, such as Romania and Bulgaria, also stand out with at-risk-of-poverty rates of over 20% – more than one in five people in these countries are therefore at risk of poverty. France occupies an intermediate position, with an at-risk-of-poverty rate of 14.4%, while the Czech Republic has the lowest rate in the EU (8.6%).
At-risk-of-poverty rate (income poverty) in European Union countries, 2021 (in %).
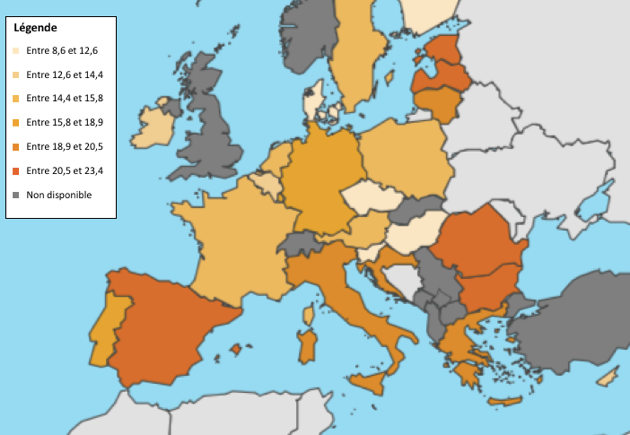
Source Eurostat, EU-SILC data: at-risk-of-poverty rate.
Reading: in France, in 2021, the at-risk-of-poverty rate is 14.4%.
The choice of such an indicator to characterize income poverty has two major consequences. Firstly, when the median standard of living falls within a country, so does the at-risk-of-poverty threshold: this was the case in France, for example, between 2009 and 2013. Secondly, the poverty line differs – sometimes significantly – from one country to another: for example, “poor” people in Greece have a much lower standard of living than “poor” people in France.
In order to study these disparities, it should first be noted that it is not possible to directly compare at-risk-of-poverty thresholds, even in euros, between countries. Indeed, even in the case of countries with the same currency – as in the euro zone – the same amount of money (€1, for example) does not buy the same quantity of goods and services. Comparing the poverty line in France and Greece in euros is therefore likely to be misleading. To compare poverty lines between countries, we prefer to use the notion of purchasing power parity (PPP) (see box), which takes into account the fact that the cost of living is not the same in all countries. For example, in 2021, the at-risk-of-poverty threshold in France was 13,608 PPP, compared with 5,950 PPP in Greece, illustrating the fact that the at-risk-of-poverty threshold in France corresponds to a standard of living more than twice as high as the Greek threshold.
Definition: purchasing power parity (PPP)
To take account of the fact that the same amount of money does not have the same purchasing power in different countries, we introduce the notion of “purchasing power parity” (PPP). This is a “fictitious” conversion rate that makes it possible to compare purchasing power between countries, by expressing it in a common unit, even when the currencies between countries are different. It reflects the quantity of monetary units needed to purchase the same basket of goods in different countries. For example, if a basket of goods costs 100 euros in France and 120 dollars in the United States, this fictitious conversion rate will be 1€ = $1.20, even if on the foreign exchange market we can have, at the same time, 1€ = $1.40.
The notion of PPP also applies to countries with the same currency. For example, consider a basket of goods worth €100 in country A. Since the cost of living is higher in country A than in country B, the same basket of goods may be worth €50 in country B. To reflect these differences, we’ll use the notion of purchasing power parity to compare poverty lines between countries A and B. In this example, the purchasing power of a person living on €1,000 in country A is half that of a person living on €1,000 in country B.
In the United States, the Census Bureau determines various poverty thresholds at the household level. The two main indicators used are theOfficial Poverty Measure (OPM) and the Supplementary Poverty Measure (SPM). These two indicators differ in several respects.
The OPM is based on household income, without taking into account redistribution effects. Depending on the size and profile of the household – particularly in the presence of people over 65 or under 18 – a poverty line is determined (the higher the line, the larger the household). The corresponding poverty lines were introduced in the 1960s, based on food prices at the time. Since then, they have been re-evaluated each year to take account of overall inflation. 2.
Unlike the OPM, whose thresholds are based solely on food prices, the SPM thresholds are re-evaluated annually to take account of current prices in four areas: food, clothing, housing and utilities (water, electricity, etc.). In addition, the SPM thresholds take into account the percentage share of household income represented by these four sources of expenditure: consequently, if this share increases, the SPM thresholds are also raised.
Finally, unlike the OPM, the SPM is a recently developed indicator. It takes into account more household characteristics, based on data that were not available when the OPM was introduced. Its main features are :
- taking social transfers into account when assessing a household’s disposable income,
- adjusting the poverty line according to the cost of housing by geographical area (urban, rural, etc.) and household status (homeowner – with or without a loan to repay – or tenant).
In concrete terms, there are thousands of different poverty lines defined by the SPM – depending on household composition, but also on where the household lives, etc. – which are different from the OPM poverty lines. – which are different from the OPM poverty lines. Historically, the SPM poverty rate has been higher than the OPM poverty rate. However, for the first time, in 2020, the OPM was higher. The reason? The scale of US government aid at the time of the pandemic. Indeed, the US government issued particularly large stimulus checks, and many US citizens benefited from unemployment insurance, which is taken into account by the SPM and not by the OPM.
Evolution of OPM and SPM in the United States between 2017 and 2021.
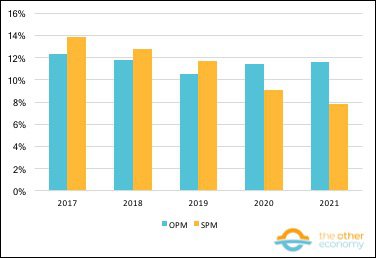
Source U.S. Census Bureau, Current Population Survey, 2017 to 2021 Annual Social and Economic Supplements (CPS ASEC).
Reading: in the USA, in 2021, the official poverty rate (OPM) is 11.6% and the supplementary poverty rate (SPM) is 7.8%.
Determining a global poverty line
On a global scale, the World Bank has defined an international poverty line. Anyone below this threshold is considered to be living in “extreme poverty”. Since autumn 2022, this threshold has been set at $2.15 per day expressed in 2017 PPP (see box above for the notion of PPP). This threshold is in fact the median of the national poverty lines of 28 of the world’s poorest countries. Previously, the threshold was $1.90 per day expressed at 2011 prices: this was the average of the national poverty lines of 15 of the poorest countries in the 1990s.
Raising this threshold in the fall of 2022 primarily reflects the general rise in prices. The real value of $2.15 at 2017 prices is the same as that of $1.90 at 2011 prices – in other words, you can buy the same goods with $2.15 at 2017 prices or $1.90 at 2011 prices.
It is therefore interesting to look at the distribution of extreme poverty around the world (see map below). This is mainly concentrated in sub-Saharan Africa and in regions of conflict (which affect local economies). In 2019, sub-Saharan Africa alone accounted for 60% of people living below the poverty line worldwide. At the same time, between 2017 and 2019, the extreme poverty rate in this region fell from 37% to 35%. This drop in the rate of extreme poverty in Sub-Saharan Africa is, more generally, a trend that has been confirmed over the last twenty years or so – in 1999, the rate was 56% in this region. Nevertheless, the number of people below the international poverty line continues to rise: 365 million in 1999, 385 million in 2017 and 389 million in 2019. This result, which may seem paradoxical at first glance, is understandable given the strong demographic growth in Sub-Saharan Africa.
Percentage of the world’s population living below the international poverty line in 2022.
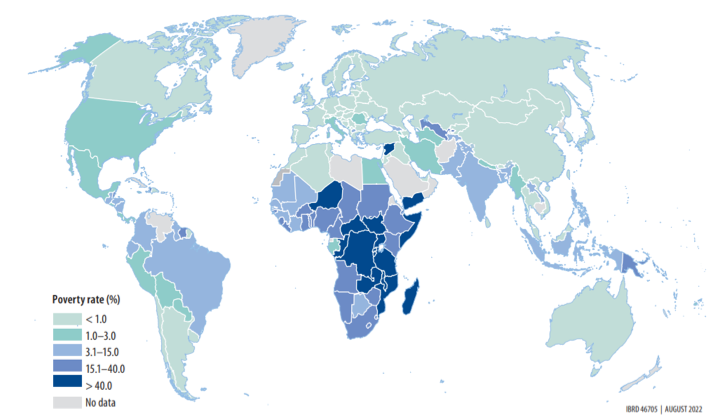
Source World Bank, Poverty and Shared Prosperity report, 2022, p. 37.
Reading: in the United States, the proportion of the population living below the international poverty line is less than 10%.
The limits of income poverty
There is a broad consensus that monetary evaluation is insufficient to grasp the complexity of the notion of poverty. Examples include housing poverty, fuel poverty and the fact that some people have specific needs (illnesses, disabilities, etc.) to which specific expenses may be associated, all of which render an analysis of poverty based on a single monetary threshold incomplete.
To better address the “multidimensional” nature of poverty, other indicators have been introduced by the institutions responsible for measuring poverty. The following section presents the two main “multidimensional poverty” indicators used to date.
It should be noted, first of all, that while the multidimensional nature of poverty is widely accepted, not all its dimensions are necessarily recognized or studied. This is what a recent study by ATD Fourth World helps us to understand.
The hidden dimensions of poverty
This ATD Fourth World report, published in 2019, illustrates the main findings of work carried out in six countries: Bangladesh, Bolivia, France, Tanzania, the United Kingdom and the United States. Hundreds of people living in poverty took part in this research to better understand the multidimensional nature of poverty. Following the methodology of “cross-fertilization of knowledge and practice with people experiencing poverty”, the experiences and knowledge of these people were cross-referenced with those of academics and professionals in a process of multiple discussions. The results of this work are summarized in the chart below. These various exchanges highlighted nine dimensions of poverty, grouped into three types.
At the heart of the diagram (in red) are the sufferings resulting from the dispossession of the power to act, which are the results of deprivation and mistreatment, to which people react with struggle and resistance.
The relational dimensions of poverty (in blue) receive very little attention from policy-makers and researchers, even though they play a key role in shaping poverty.
Finally, deprivation (in green) is the most studied dimension of poverty.
Five factors (called modifiers in the study) can alter the degree and form that each of the nine dimensions of poverty can take: identity (ethnicity, gender, sexual orientation, etc.), time and duration, place (urban, rural), environment and environmental policy, and cultural beliefs.
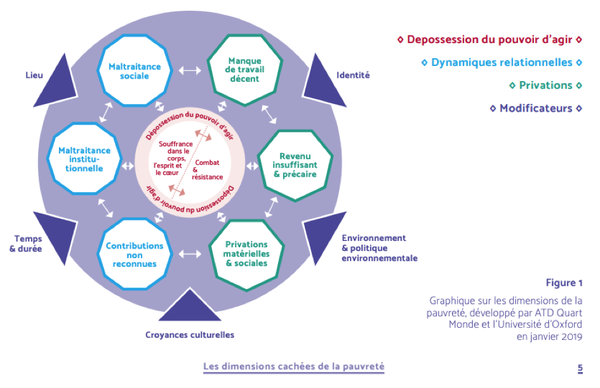
Source The hidden dimensions of poverty – ATD Fourth World, 2019.
The material and social deprivation indicator developed in the European Union
To operationalize the European foundation of social rights proclaimed in 2017, the European Union has drawn up an action plan that includes an objective to combat poverty. This involves reducing the number of people ” at risk of poverty or social exclusion ” by 15 million by 2030 (including 5 million children) compared to 2019.
People “at risk of poverty or social exclusion” are those who are either “at risk of poverty” (measured with the indicator defined in point 1), or in a situation of ” severe material and social deprivation “, or ” living in a household with very low work intensity “. 3.
Definition of the severe material and social deprivation indicator
Thematerial and social deprivation indicator is a European indicator that aims to go beyond the monetary dimension of poverty. It measures “absolute” poverty, i.e. it quantifies the exclusion of people from basic practices and consumption, taking into account European consumption standards. 13 deprivations have been defined, taking into account elements of everyday life:
- at household level: 1/ not being able to cope with an unforeseen expense of around 1,000 euros, 2/ not being able to afford a week’s vacation a year away from home, 3/ not being able to change out-of-date furniture for lack of financial means, 4/ having monthly loan repayments, rent or electricity, water or gas bills in arrears, 5/ not being able to keep the home at the right temperature for lack of financial means, 6/ not being able to afford a private car,
- on a personal scale: 7/ not being able to afford a meal containing meat, chicken or fish (or the vegetarian equivalent) at least every other day, 8/ not being able to spend a small amount of money on oneself without having to consult anyone else, 9/ not being able to have a regular leisure activity for lack of financial means, 10/ not being able to get together with friends or family at least once a month for a drink or a meal for lack of money, 11/ not being able to afford new clothes, 12/ not owning at least two pairs of good shoes for lack of money, and 13/ not having access to the Internet for lack of money.
Those living in ordinary housing (i.e. excluding collective housing and mobile homes) who answer “yes” to at least 5 of these 13 statements are then considered to be in a “situation of material and social deprivation”. To describe a higher degree of poverty, the notion of “severe material and social deprivation” has been introduced: it concerns households suffering from at least 7 of these 13 deprivations.
Results and comparison with income poverty
For a better understanding of the relationship between material and social deprivation and the risk of poverty (income poverty), we show the two in relation to each other for the various countries of the European Union.
Rate of severe material and social deprivation and at-risk-of-poverty rate (income poverty) in 2021 in the European Union.
Reading: in Finland, in 2021, 1.1% of the population will be in a situation of severe material and social deprivation, and the at-risk-of-poverty rate will be 10%.
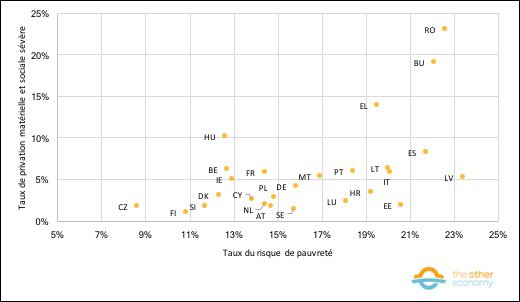
Source Eurostat, EU-SILC data: severe material and social poverty rates and at-risk-of-poverty rates. Note: each country is represented on the graph by two letters (a bigram). See Eurostat for the correspondence of all bigrams with the countries they define. Severe material and social deprivation rate for Slovenia not available.
Romania (RO on the graph), which had one of the highest at-risk-of-poverty rates in Europe, has the highest rate of severe material and social deprivation, – both indicators being of the same order of magnitude (just under 25%). More generally, however, rates of severe material and social deprivation are lower than those of poverty risk. Romania stands out as the only country whose rate of severe material and social deprivation is higher than its at-risk-of-poverty rate.
In terms of order of magnitude, material and social deprivation rates are on average lower than at-risk-of-poverty rates. Only 4 countries have a severe material and social deprivation rate above 10%, while all countries – with the exception of the Czech Republic – have an at-risk-of-poverty rate above 10%.
These initial results beg the question: are individuals who find themselves in a situation of material and social deprivation also in a situation of monetary poverty? Although it is more difficult to find figures to answer this question, a 2019Insee study estimates the proportions of people suffering from one of the two types of poverty, as well as the proportion of people who accumulate these two types of poverty.
Proportion of people at risk of (income) poverty and material and social deprivation by country in 2016 in the European Union.
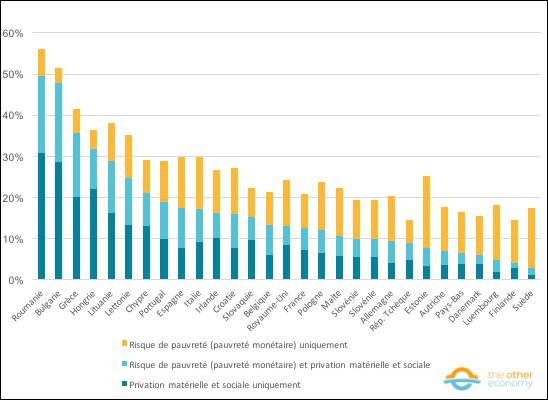
Source Source : Who is poor in Europe? Two different approaches to poverty: monetary or material and social deprivation. – Insee 2019.
Reading: in 2016, 20.8% of French people were affected by either one of the two types of poverty (7.2% by material and social deprivation alone, 8.1% by the risk of poverty alone) or by both types of poverty combined (5.5%).
Among those affected by at least one of the two types of poverty, the proportion of people in both situations varies from around one in ten in Finland or Sweden to more than one in three in Bulgaria. In countries with low levels of material and social deprivation (such as Sweden or Finland), over 70% of poor people are only at risk of poverty, i.e. in monetary poverty.
Finally, in France in 2016, 43% of people experiencing material and social deprivation were also at risk of poverty. In other words, 57% of people in situations of material and social deprivation are nevertheless not considered “poor” according to the most commonly used definition of poverty, and therefore according to the measure of poverty risk, i.e. the threshold of 60% of the national median standard of living.
Despite some disparities between countries, it is clear that people at risk of poverty are not, in general, those experiencing material and social deprivation. This result is due to the fact that monetary poverty (the risk of poverty) is defined by a threshold relative to each country, whereas material and social deprivation define absolute poverty – i.e. the criteria are the same for all, whatever the country of origin. In the most affluent countries – such as the Nordic countries – people have access to basic goods and services, but may find themselves below the monetary poverty line. On the other hand, in countries where the overall standard of living is lower – such as Romania or Bulgaria – people below the monetary poverty line are also unable to satisfy certain basic needs. We can even conclude from the graph that a certain number of people in these countries – around 20% of the population in Bulgaria and Romania – are above the at-risk-of-poverty threshold but are in a situation of material and social deprivation.
Criticism and geographical relevance of the material and social deprivation indicator
Applied on a European scale, the material and social deprivation indicator describes a new face of poverty, one that is not solely monetary. The choice of the 13 deprivations described above to capture material and social deprivation can legitimately be questioned: why these deprivations and not others? Is the relevance of this indicator limited to EU countries?
To put the choice of deprivations for this indicator into perspective, we can cite a study by Insee, published in 2009, on how Europeans perceive poverty and the deprivations it entails. This report reveals a lack of consensus on the nature of the deprivations that define non-monetary poverty. The only deprivations that unanimously characterize non-monetary poverty concern vital needs (food, housing, etc.). Despite this lack of consensus, this study highlights a “national effect”: in other words, people from the same country are more likely to share the same vision of the deprivations that best characterize poverty.
These factors highlight the difficulties of using a single deprivation indicator for geographies with very different economic and cultural characteristics. 4. In this respect, we note that the European social and material deprivation indicator does not include any reference to education, which one might imagine to be a kind of prerequisite given the European scale, whereas it is a major issue for other regions of the world.
Despite these difficulties, studies have been carried out to develop indicators for measuring non-monetary, multidimensional poverty, so that they can be applied on a global scale.
Global indicators to characterize multidimensional poverty
The MPI: a multidimensional poverty indicator with no explicit reference to income poverty
The first global indicator developed to characterize multidimensional poverty is the MPI(Multidimensional Poverty Index). It was developed by the UNDP (United Nations Development Program) and Oxford University. Like the European Material and Social Deprivation Indicator, this indicator draws up a list of deprivations, focusing here on three dimensions of poverty: health, education and living conditions. For each dimension, different deprivations are assessed. Finally, each deprivation is assigned a weighting 5 which can vary between 1/6 and 1/18 (see table below).
This indicator is applied at household level. A household is said to be “multidimensionally poor” if the weighted sum of its deprivations is greater than or equal to 1/3. For example, if a household has neither electricity nor access to drinking water (but has no other deprivation), its “score” is 1/18 + 1/18 = 2/18, which is less than 1/3 – so this household is not multidimensionally poor.
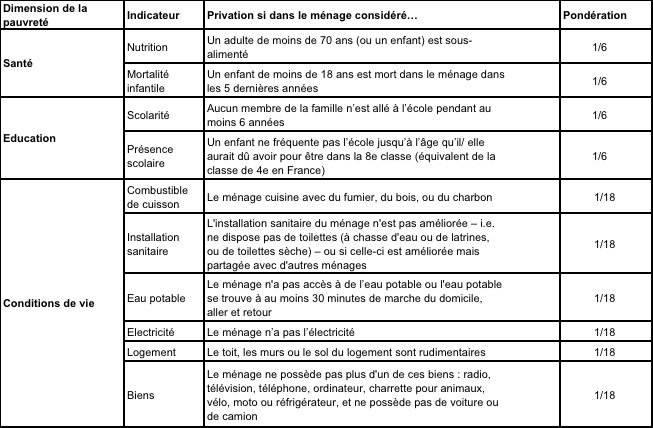
Source: United Nations Development Programme.
Next, a national poverty index is calculated: the MPI. The MPI is equal to the share of multidimensionally poor households (as a percentage) multiplied by the average deprivation score of multidimensionally poor households. For example, consider that 30% of households in a country are multidimensionally poor. If, moreover, within these households the average deprivation score is 0.5, then this country’s MPI is equal to 30% * 0.5 = 15%.
Empirical results
Within Sub-Saharan Africa, the disparities between countries are obvious: MPI ranges from less than 10% for Sao Tome and Principe and Lesotho to over 50% for Chad. It should also be noted that not all Sub-Saharan African countries are listed in the graph below. This reflects the difficulties encountered in conducting surveys and collecting data on an annual basis. We have therefore chosen to show only data from 2018 to 2021, to ensure comparability. In most countries in this region, the MPI is not estimated annually: for example, the last MPI calculation for Burkina Faso dates back to 2010.
Multidimensional poverty index in Sub-Saharan Africa.
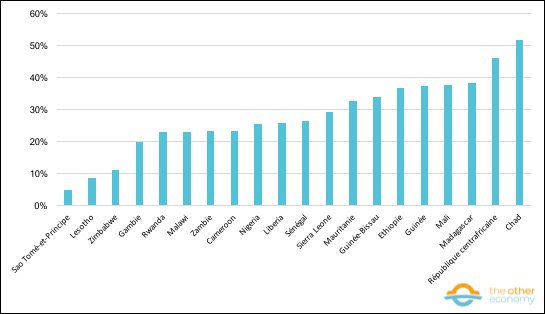
Source OPHI Data Bank. Note: data from 2018 to 2021 depending on country.
Reading: in Rwanda, the multidimensional poverty index is 23.1%.
The MPI is therefore the first multidimensional poverty indicator developed by international institutions. Moreover, the monetary dimension is not explicit in this indicator – there is no mention of a monetary poverty line. For its part, the World Bank has developed another indicator inspired by the MPI philosophy, taking into account the international poverty line.
MPM: a multidimensional poverty indicator with explicit reference to income poverty
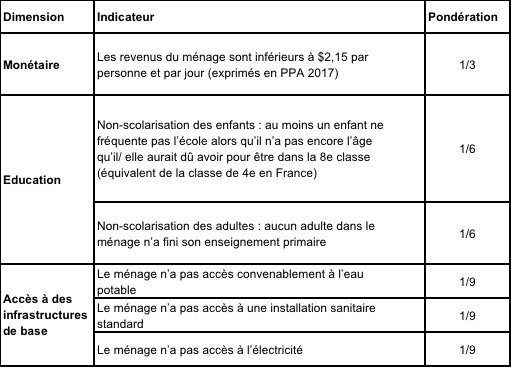
The Multidimensional Poverty Measure (MPM) is a multidimensional poverty indicator similar to the MPI. It differs from the MPI in that it assesses three dimensions of poverty: income poverty, education and access to basic infrastructure.
As with the MPI, different deprivations are assessed, and each deprivation is assigned a weighting (see table below). Any household is considered “multidimensionally poor” according to the MPM if the sum of the deprivations from which the household suffers is greater than 1/3. There are thus differences between the deprivations studied by the MPI and the MPM – which echoes the non-consensual nature of the choice of deprivations to characterize poverty. The other main distinction between the MPI and MPM lies in the explicit consideration of income poverty in the case of the MPM, while there is no mention of income poverty in the MPI.
More concretely, due to the weighting detailed above, any household below the international poverty line ($2.15 per day per person expressed in 2017 PPP) is automatically poor in the sense of the MPM – whereas a household can, theoretically, live below the international poverty line and not be poor in the sense of the MPI. Consequently, the MPM is higher (in value) than the income poverty rate in each country. However, it is also possible for a household not to live below the international poverty line, but to be multidimensionally poor in the sense of the MPM. 6.
Source: World Bank.
Main results
The latest World Bank report assesses the income poverty rate, MPM, as well as each individual deprivation across different regions (see below). Sub-Saharan Africa as a whole is three times more affected than the global average by these different forms of poverty.
By contrast, the Europe and Central Asia region is characterized by lower poverty indicators than the global average. However, there are major differences between indicators. Europe and Central Asia are 30 times less affected than the world average by monetary poverty, but this ratio rises to 7 when it comes to the multidimensional poverty described by the MPM, and even to 2 if we focus solely on access to drinking water.
Poverty and deprivation rates for different regions (in % of population, 2018).
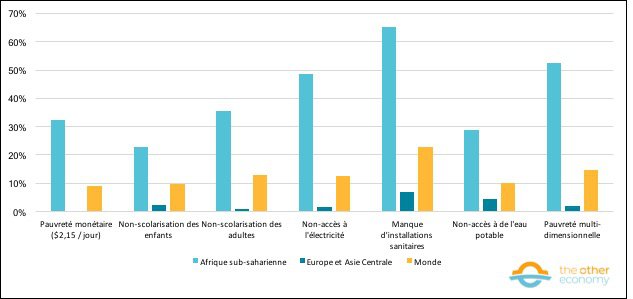
Source World Bank, Poverty and Shared Prosperity 2022: Correcting Course, p.96. Note: “Non-schooling of children” refers to the fact that at least one child is not attending school, even though he/she is under the age at which he/she should have been in the 8th class (equivalent to the 4th class in France). “Adult non-enrolment” refers to the fact that no adult in the household has completed primary education.
Reading: the multidimensional poverty rate is 52.6% in Sub-Saharan Africa, 2.1% in Europe and Central Asia and 14.7% worldwide in 2018.
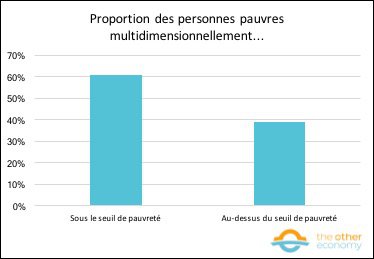
Among the “multidimensionally” poor, it is essential to note that around 40% are not monetarily poor. This underlines, once again, the idea that a complete definition of poverty cannot be limited to its monetary dimension.
Source World Bank, Poverty and Shared Prosperity 2022: Correcting Course, p.96.
A few words on subjective poverty
Finally, beyond statistics, there is the question of the feeling of poverty: which people feel poor? This other approach invites us to take an interest in what we call “subjective poverty” or “felt poverty”, and to compare the feeling of poverty with, in particular, the at-risk-of-poverty indicator – which characterizes monetary poverty.
In France, opinion barometers have been set up to determine subjective poverty statistics. 7. DREES and Secours Populaire have developed two different approaches to measuring subjective poverty.
The DRESS approach consists of surveying people by asking them directly about their personal situation: do they consider themselves to be poor? The results of this opinion barometer are presented below, and reveal that in 2021, 19% of French people consider themselves to be poor. Comparing this figure with the at-risk-of-poverty rate in France – 14.4% in 2021 – indicates that there are more people who consider themselves to be poor than are considered as such according to the indicator most commonly used by national institutions.
Proportion of people who consider themselves poor in France (2017-2021).
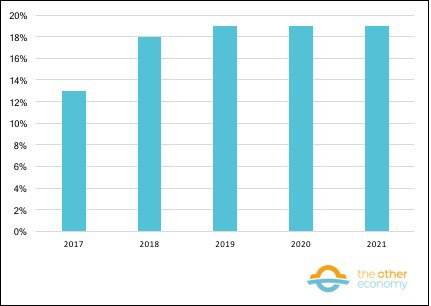
Source DREES, Baromètre d’opinion, 2017-2021. Note: Question asked: “And you, personally, do you think there is a risk that you will become poor in the next five years? Yes, rather/No, rather not/I already consider myself poor.” These results are calculated excluding “Don’t know”, an answer that represents 8% of responses in both 2021 and 2020, 6% of responses in both 2019 and 2018, and 1% of responses in 2017.
Reading: in 2017, 13% of people in France considered themselves to be poor.
Secours populaire has opted for a different approach, focusing more on the monetary dimension of poverty. Specifically, respondents are asked what they think the monetary poverty line is in France. In the latest report – dating from September 2022 – the subjective poverty threshold is €1,263 for a single person, whereas the Insee monetary poverty threshold in 2022 is €1,102.
In other words, whether using the DRESS or the Secours Populaire approach, the feeling of poverty is more diffuse and affects more people than indicated by the at-risk-of-poverty rate and threshold.
Finally, despite this ” diffuse ” feeling of poverty, people of modest means tend to overestimate their position on the French income scale. According to a 2022 DREES survey, the poorest 10%, on average, believe they are around the third decile. 8 – i.e. richer than they actually are compared to the rest of the French population. Studies have shown that this bias results from the fact that people evaluate their own income in relation to that of their neighbors, or by comparing themselves with people with the same level of education or who work in the same company. 9. As a result, people tend to feel more in the “middle” of the income distribution – close to the average French standard of living – which is not, however, incompatible with a feeling of poverty.
In short, these few points underline the protean nature of poverty. The notion is not easy to define and is often, wrongly, examined solely from a financial point of view. Several institutions have developed indicators illustrating the multiple dimensions that poverty can take on. Despite this, it is not easy to define “objective” criteria that characterize poverty in a comprehensive way. A complementary approach is to look at “perceived poverty” – the subjective sense of poverty.
Find out more
Some reports on poverty
- The latest World Bank report on poverty: Poverty and Shared Prosperity 2022
- Who is poor in Europe? Two different views of poverty: monetary or material and social deprivation – Insee, 2019
- What does it mean to be poor in Europe today? An analysis of the consensus on deprivation – Insee, 2009
- A report on measuring poverty in the United States – 2022
- Report on poverty in France – Edition 2022 -2023
- The latest United Nations Development Programme report on MPI
- The World Bank’s MPM website
- Standard of living is equal to household disposable income divided by the number of consumption units. In Eurostat statistics, the standard of living is calledEquivalised disposable income. To find out more, see “How to measure monetary inequality”. ↩︎
- INSEE defines inflation as “the loss of purchasing power of money resulting in a general and sustained increase in prices”. It is measured by changes in the prices of consumer goods and services, but does not include changes in asset prices (such as shares or real estate). To find out more, see the fact sheet: ” Inflation and money “. ↩︎
- A very low-intensity household is defined as one in which the working-age population worked 20% or less of their total potential working time in the previous year. People of working age are those aged 18 to 64, non-retired and non-students. ↩︎
- This difficulty has even been highlighted when comparing countries within the EU. In France, for example,INSEE has developed another indicator of deprivation to characterize “poverty in living conditions”, based on a list of 27 deprivations. However, the same survey explicitly states that it is difficult to use this indicator for cross-country comparisons, even on a European scale. ↩︎
- Weighting an index or statistic means giving the values that make it up a different weight, according to the various criteria that reflect the relative importance of each element. ↩︎
- Take the case of a household suffering from all the deprivations in the table in the areas of education and access to basic infrastructure. The sum of such a household’s deprivations would, in fact, be 2/3 – which qualifies the household as “multidimensionally poor”. ↩︎
- There is also a body of research looking at the measurement of subjective poverty. See, for example: Duvoux, Nicolas, and Adrien Papuchon. ” Subjective poverty as a measure of social insecurity. A comparison of different poverty indicators “, Savoir/Agir, vol. 49, no. 3, 2019, pp. 87-93. ↩︎
- See ” How to measure monetary inequality ” for the definition of a decile. ↩︎
- See Cruces, et al, “Biased perceptions of income distribution and preferences for redistribution: Evidence from a survey experiment“, Journal of Public Economics, vol. 98, 2013, p 100-112 and Hvidberg, et al, “Social Positions and Fairness Views on Inequality“, National Bureau of Economic Research Working Paper Series, vol. 28099, 2020 for more details on these findings. ↩︎