
This text has been translated by a machine and has not been reviewed by a human yet. Apologies for any errors or approximations – do not hesitate to send us a message if you spot some!
Introduction
The issue of inequality is a complex one: studying inequality means looking at how goods or wealth are distributed on different scales (local, national or international). The notion of inequality is often associated with that of poverty, which refers to financial or material inadequacy.
The emergence of inequalities – where do they come from, how long have they existed? – is still an open debate. While some consider them to be inherent to human nature, others have studied them from the angle of social and political construction. 1 While the debate remains unresolved, one hypothesis put forward is that the economic stratification of society was concomitant with the onset of sedentarization, over 10,000 years ago.
According to economist Thomas Piketty, the evolution of monetary inequalities since the end of the 18th century is characterized by a “historic movement towards equality”. 2 However, this global perspective conceals significant disparities and certain new trends since the 1980s.
Furthermore, limiting inequalities to monetary inequalities is insufficient: inequalities are multidimensional(see Feature 1). A remarkable example, and one increasingly present in public debate, is that of environmental inequalities. Climate change, and ecological crises more generally, have highlighted a number of environmental inequalities 3 :
- inequalities in exposure to ecological crises, in access to the environment, and in the ability to adapt to crises(see Essentiel 11),
- impact inequalities (for example, inequalities in terms of contribution to pollution – see Essential 4 and Misconception 5),
- inequalities induced by environmental policies(see Feature 9),
- inequalities in terms of influence on the implementation of environmental policies by a country or region(see Feature 9).
The essentials
Inequality is not just a question of money
The question of inequality is, for the most part, addressed in public debate from the angle of income and wealth. Although the monetary aspect is indeed an important dimension of inequality, there are others, sometimes less visible (or less watched).
Legal inequalities
For proof of this, we need look no further than the statutory inequalities that are, or have been, enshrined in the law of certain countries. It was only in December 1948 that the General Assembly of the United Nations – then made up of 58 countries – adopted the Universal Declaration of Human Rights, the first article of which stipulates that “all human beings are born free and equal in dignity and rights”.
Let’s take three unavoidable cases: Indian castes, women’s rights and discrimination before the law based on skin color.
India’s caste society is an example of a social body long marked by status and structural inequalities. 4 It was not until the Indian Constitution of 1950 that all forms of caste-based discrimination were officially abolished. Almost 80 years later, India remains one of the most unequal countries in the world. 5 Despite quota policies, people from disadvantaged castes are still largely under-represented in certain fields – intellectuals, for example. 6
On the other side of the globe, women’s right to vote only arrived in the 20th century in most Western countries (1920 in the USA, 1944 in France, 1971 in Switzerland…). In France, it wasn’t until 1965 that married women could work or open a bank account without their husband’s authorization. 7
Inequality before the law according to skin color is another major example in many countries, with black people long denied the same rights as light-skinned people. In concrete terms, this translated into slavery in colonized countries for several centuries (from the late Middle Ages to the 19th century). 8
After the abolition of slavery, some states enacted other laws perpetuating statutory inequalities between black and white people. This was notably the case in the United States with the Jim Crow laws enshrining, among other things, racial segregation in public places (the principle of these laws being summed up by the doctrine of “separate but equal”). 9 Following the civil rights movements of the 1950s-1960s, the passage of the Civil Rights Act of 1964 and the Voting Rights Act of 1965 put an end (officially – see Idea 8) to segregation and guaranteed equal civil rights regardless of skin color, origin, religion or gender.
De facto inequalities
It should be noted here that these de jure inequalities result in monetary inequalities, and that the abolition of discrimination in law does not instantly translate into its effective disappearance. In particular, despite significant progress in recent decades, de facto inequalities between women and men still persist throughout the world.
Economist Amartya Sen points out that some inequalities lead to others. In particular, he argues that the principle of equality should not be based solely on interpersonal comparisons of resources (wealth, income), but on the ability of individuals to transform these resources into freedoms.
In 1979, he introduced the notion of “capabilities”. 10 These refer to an individual’s ability to convert his or her “resources” (economic, but also cognitive, in terms of education, networks, etc.) into opportunities andsubstantive freedoms, enabling him or her to lead the life he or she wants to lead. 11 His work has been the driving force behind a new approach to questions of poverty and inequality, which is not based solely on questions of income, but focuses more on capabilities and the deprivation of capabilities. 12 This approach emphasizes the fact that sources of inequality can add up. 13
Cultural, social and economic capital – not all heritages are financial
According to sociologist Pierre Bourdieu, different forms of “capital” interact and contribute to shaping the social trajectories of individuals (we’ll use the term “capital” in the Bourdieusian sense in the remainder of this box only). This dynamic tends to perpetuate social and monetary inequalities from one generation to the next – which cannot be explained solely by the transmission of economic wealth (inheritance, for example).
Pierre Bourdieu distinguishes four forms of capital: economic, cultural, symbolic and social.
For example, social capital, made up of social networks and community ties, is generally passed on through family and professional relationships, providing access to economic and social opportunities. In concrete terms, a young entrepreneur from an entrepreneurial and international background will tend to have a large network (social capital), offering him or her economic development opportunities.
Another well-known example is that of cultural capital: in their book Les Héritiers (1964), Pierre Bourdieu and Jean-Claude Passeron emphasize the key role played by the cultural capital passed on by families in their children’s ability to pursue rewarding studies, guiding them towards remunerative and stimulating careers. In practice, this can mean that parents from upper-class backgrounds “know the system better”, know how to deploy strategies to get their children into the most prestigious universities, or introduce their children to “classical culture” from an early age.
Another cardinal dimension of inequality is the link with ecology; the question of ecological transition cannot be addressed without considering the social question (see Essentiels 4, 9 and 10 in particular). To illustrate this, let’s quote sociologist Sophie Dubuisson-Quellier:
“The intersection of social and ecological issues actually generates three types of inequalities: inequalities in exposure to environmental problems, […]; inequalities in greenhouse gas emissions, because the lifestyles of the richest people emit more; and finally inequalities in effort, because part of the population – often the least advantaged – will incur greater economic costs as a result of implementing measures linked to the ecological transition.”
Finally, there are other sources of inequality, such as access to public services, which are strongly felt by those who suffer from them. 14 The source of these inequalities can be geographical: this can occur on a global scale – depending on the country of birth, access to healthcare or education can be more or less socialized – and on a national scale – with, for example, in France, the case of “medical deserts” mainly located in rural areas (which constitute inequalities in access to healthcare). To illustrate this, let’s conclude with a quote from Olivier Passet:
“First of all, we need to be aware that our monetary indicators give only a very partial picture of inequality. Among the blind spots is the fact that, for the same level of monetary income, households in some countries have access to a wide range of collective services, the cost of which is socialized, particularly in the fields of health, education, training and employment services, while in others they do not. Depending on the country, these services may be of good quality, uniformly accessible or, on the contrary, deteriorating. This is precisely where equal opportunities are built. And it’s clear that this is one of the decisive dimensions in building social cohesion.”
Find out more
- Development as Freedom, Amartya Sen, Oxford University Press, 1999
- Eric Monnet, La théorie des “capabilités” d’Amartya Sen face au problème du relativisme, Tracés. Revue de Sciences humaines, 2007
- Social Inequalities, Nicolas Duvoux, PUF, 2017
- Valérie Erlich, “Les Héritiers”: what Bourdieu and Passeron taught us about inequality of opportunity, The Conversation, 2022
- Philippe Testard-Vaillant, Comment l’orientation scolaire renforce les inégalités, CNRS Le Journal, 2018.
- Nearly 2.4 billion women in the world do not have the same economic rights as men, World Bank, 2022
- Inégalités : 12 graphiques de la vie d’une femme (France), Alternatives économiques (10/07/2024)
- Deepa Narayan, Poverty Is Powerlessness and Voicelessness, IMF, 2000
- The Civil Rights Act of 1964: A Long Struggle for Freedom, Library of Congress
- The African American Odyssey: A Quest for Full Citizenship, Library of Congress
The average living standard worldwide have never been higher
Since the beginning of the 18th century, per capita income has risen considerably worldwide, largely thanks to the Industrial Revolution.15
This dynamic is well illustrated by Angus Maddison’s work on economic growth over the very long term, which also shows disparities between regions of the world: whereas in the 15th century, per capita incomes in the various regions of the world were comparable, the industrial take-off of Europe and the United States in the 19th century widened the gap between the West and the rest of the world.16
Evolution of GDP per capita in different regions of the world between 1820 and 1998
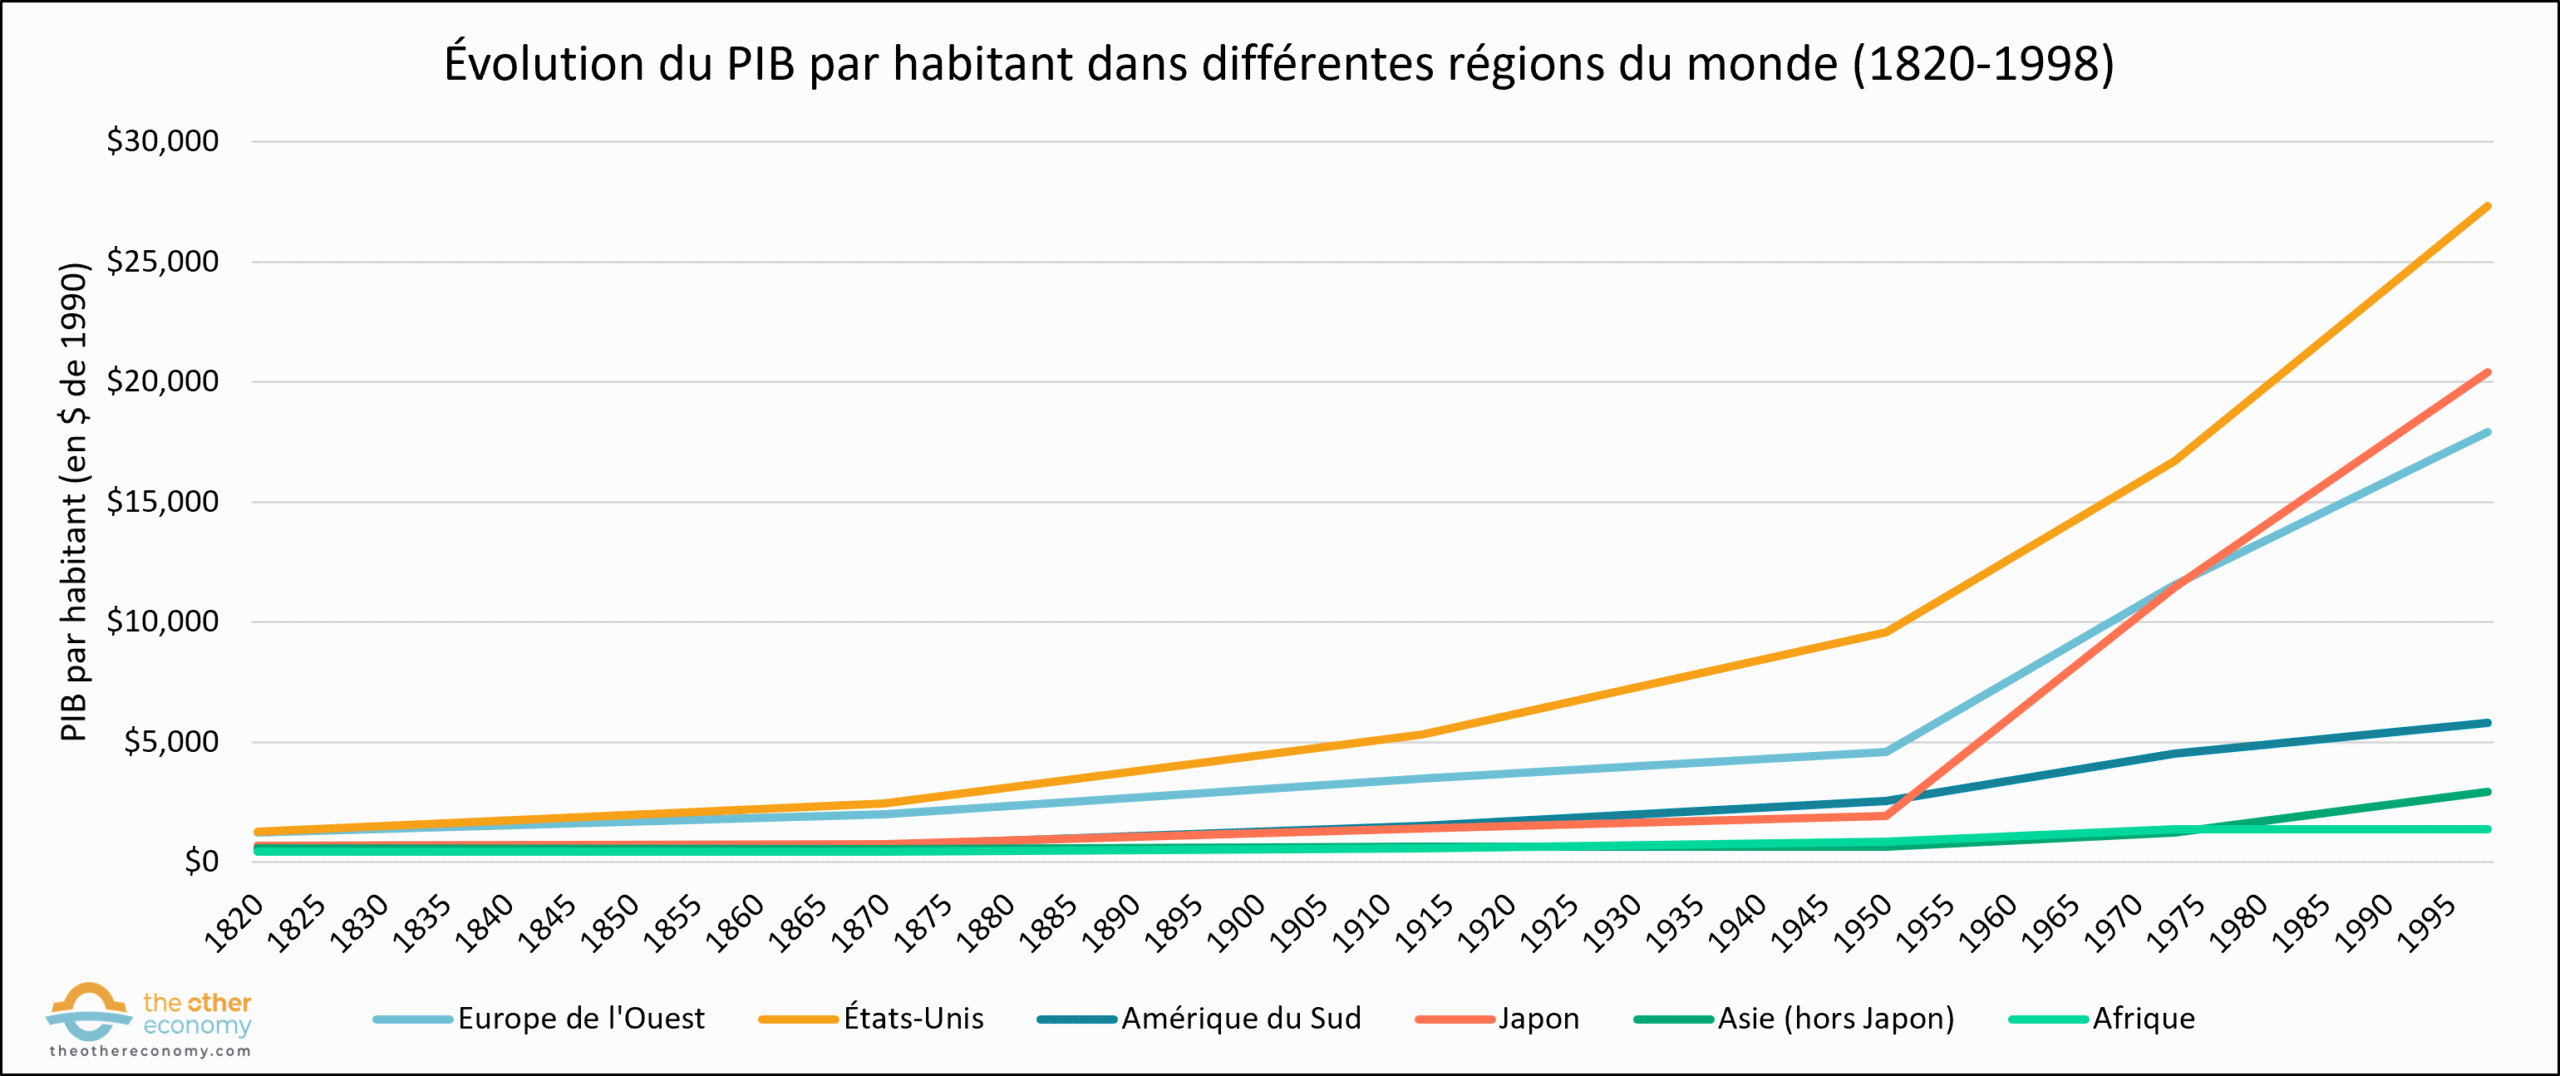
Source Angus Maddison, The World Economy, A Millennial Perspective, OECD, 2001.
This growth has come at the cost of overexploitation of natural resources, massive pollution of soil, surface water and oceans, and the destabilization of major natural balances, including the climate (see our Economy, natural resources and pollution module).
In 1820, GDP per capita in Western Europe and the United States was twice the Asian average. This gap widened even further between the 1950s and 1970s (excluding Japan) – in the context of post-war reconstruction, the Marshall Plan, the Cold War and the decolonization process.
It was only in the 1970s that the first Asian countries – South Korea, Taiwan, Hong Kong and Singapore – finally caught up. Since then, per capita GDP has risen sharply in China and, more generally, in Asia. This significant rise in living standards in Asia has led to a sharp reduction in the rate of extreme poverty. 17 from 38% in 1990 to less than 15% in 2019. 18
Today, sub-Saharan Africa alone accounts for 60% of the world’s population living in extreme poverty. In the words of the United Nations 2023 Sustainable Development Goals Report:
If current trends persist, an estimated 7% of the world’s population – around 575 million people – will still be living in extreme poverty by 2030, most of them in sub-Saharan Africa. This projection would represent a small reduction in poverty of less than 30% since 2015.
Income inequality has risen sharply in recent decades in developed countries
As detailed in the fact sheet on monetary inequality, there are a number of indicators that can be used to quantify income and wealth inequality within a country. However, whatever the indicator used, the same conclusion can be drawn: in developed countries, the level of inequality has been rising since the early 1980s. On the other hand, as we shall see inMisconception 1, inequalities between countries have tended to decrease over the same period.
Growing inequalities over the past 40 years
To underline this, we can look at the Gini coefficient 19 – on the rise 20 in the United States, Germany and the United Kingdom since the 1980s. The same is true of the share of the top 1% of income earners 21 of national income. Whether in the USA, France, the UK or Germany, this share increased between 1980 and 2020 – with, it should be noted, stagnation in some countries since the early 2000s, or even a slight reabsorption of inequality following the financial crisis of 2007-2008. 22
Overall, the share of high-income earners increased between the 1980s and 2020s
Reading : In 1980, in France, the top 1% of households accounted for 8.3% of national income.
Source: World Inequality Database
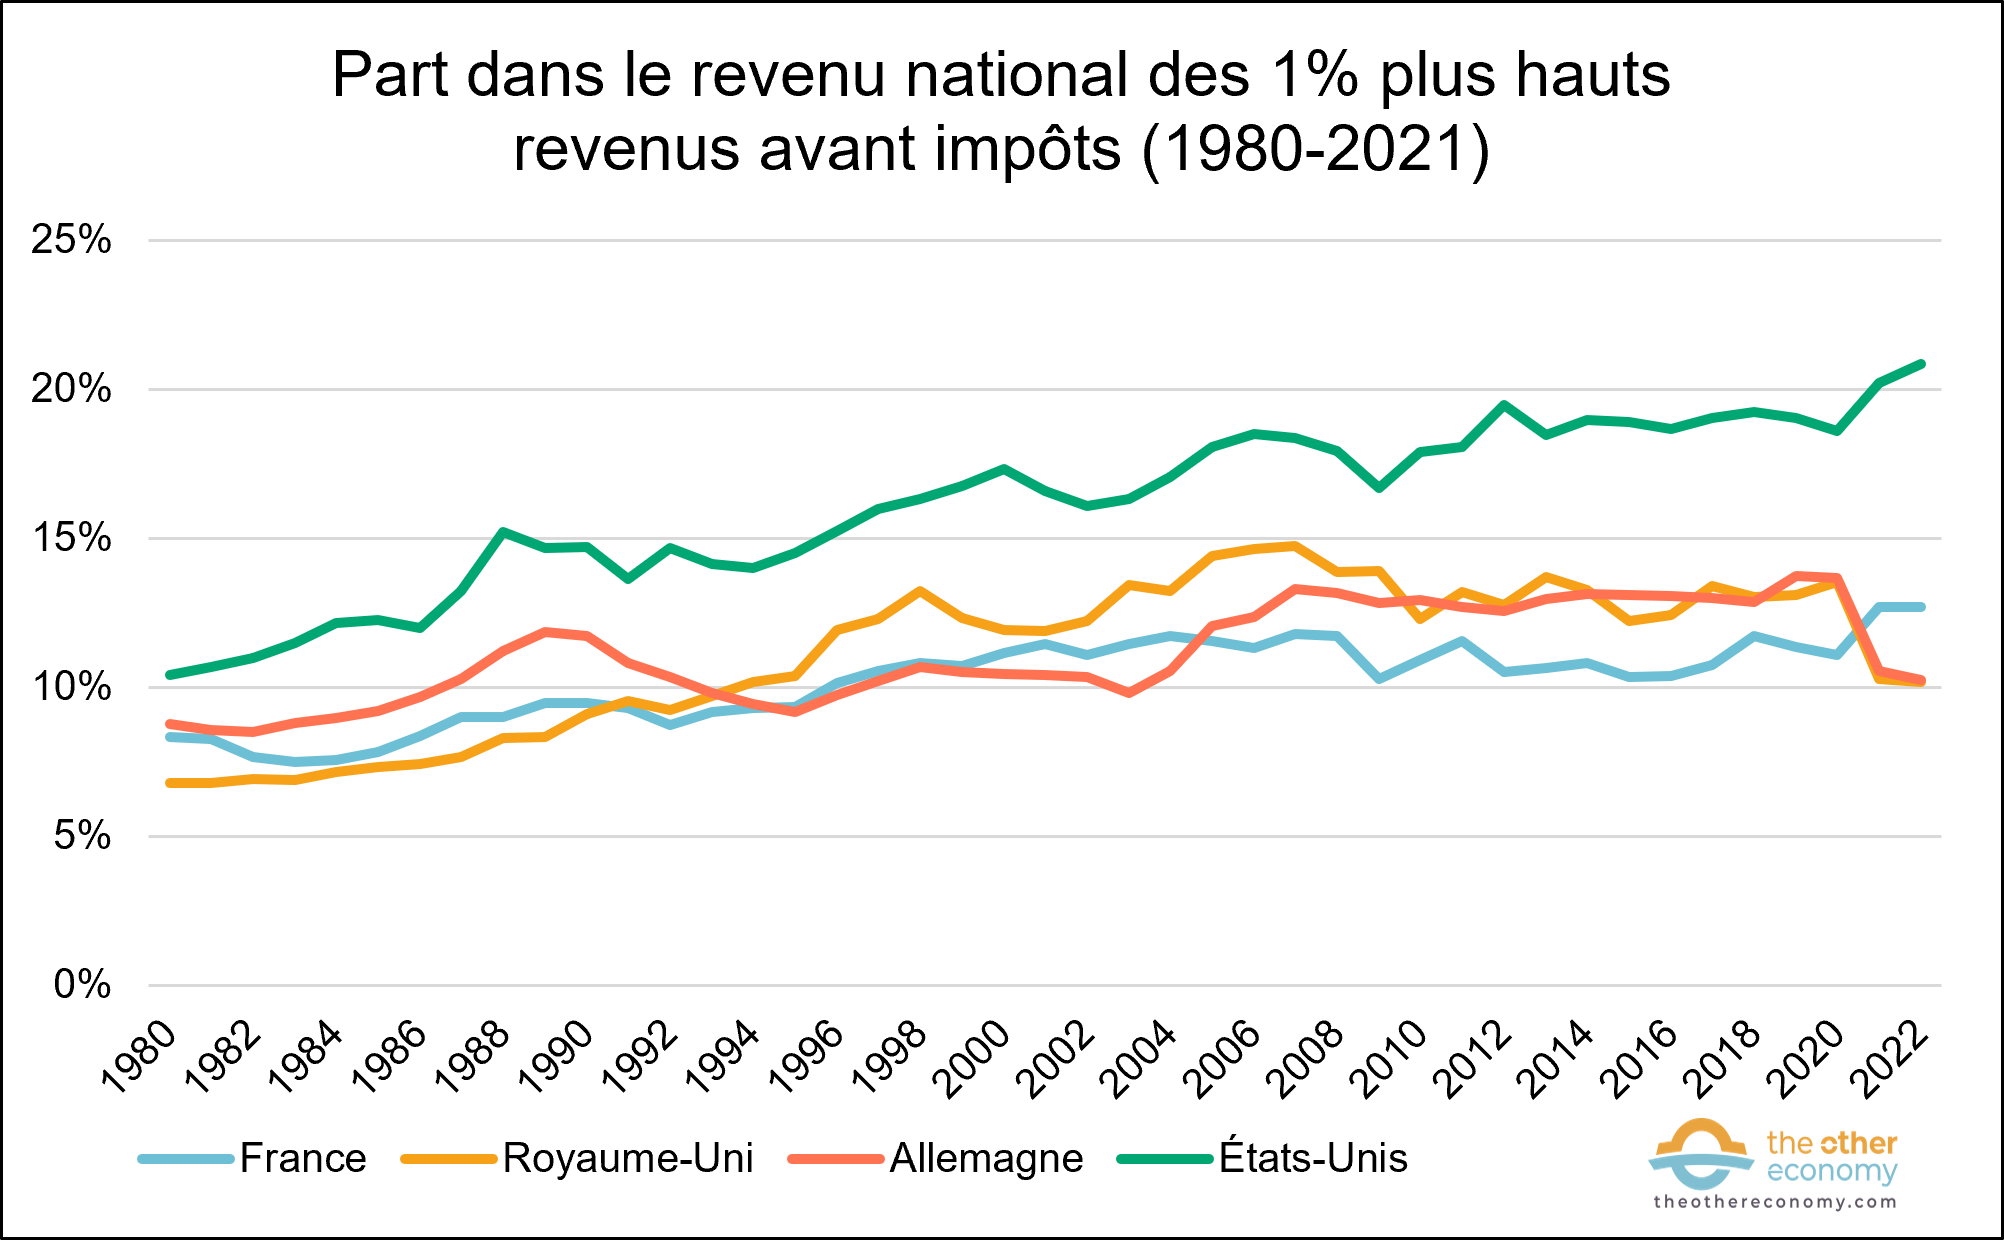
This widening inequality has been much more rapid and marked in some countries, such as the United States and the United Kingdom, than in others, such as France or Germany.
These differences are mainly due to the fact that social transfers and progressive income and inheritance tax policies are more important in France, for example, than in the United States(see Essentiel 6 on redistribution).
The elephant’s curve
To better observe recent trends in monetary inequality within developed countries, we can also refer to the graph by Lakner and Milanovic, better known as the “elephant curve.”
This curve shows the annual growth in household incomes worldwide between 1988 and 2008, according to income level.
The elephant curve by Lakner and Milanovic (1988 – 2008)
Reading: the top 1% of global income earners saw their incomes grow by around 4.8% a year between 1988 and 2008.
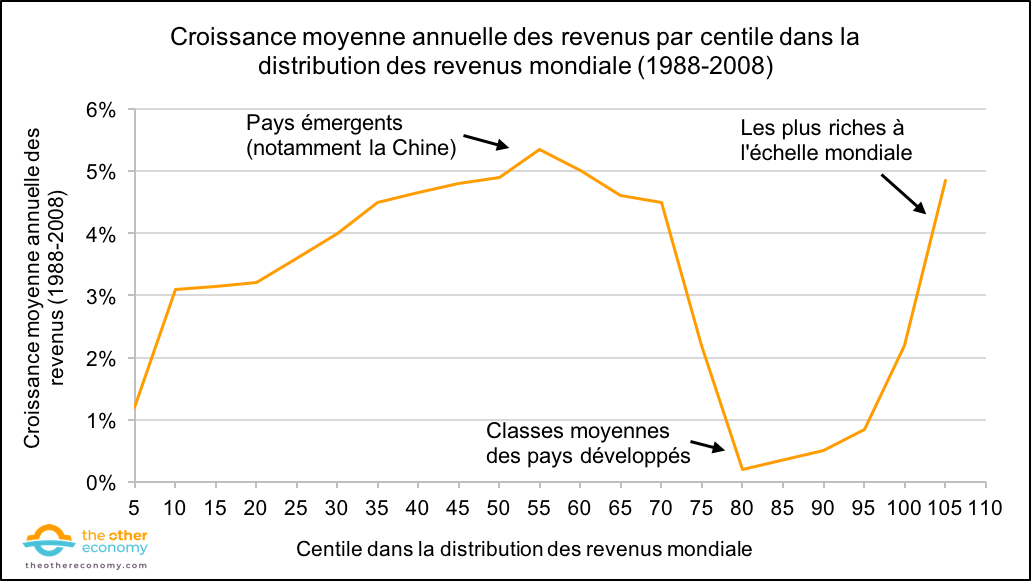
Source Christoph Lakner, Branko Milanovic, Global Income Distribution: From the Fall of the Berlin Wall to the Great Recession, The World Bank Economic Review, 2015.
The elephant curve highlights various elements in the evolution of inequality over this period:
- a sharp rise in incomes in the middle of the global distribution (what Milanovic calls the “China effect”). For a long time, and particularly between 1988 and 2008, the reduction in global inequalities was based on the rapid growth of China, whose population represented a significant proportion of the world’s poorest 20%,
- the increase in inequality in developed countries over this period. Indeed, there was very modest or near-zero growth around the 80th percentile of the distribution – corresponding to the lower middle classes in the most developed countries – as well as a sharp increase among the world’s richest 1%.
The impact of the 2008 financial crisis
As Branko Milanovic points out in an article published in 2024 23 the situation described by the elephant curve is no longer valid at the time of the 2008 financial crisis, which, in his words, is “probably the most important development since the industrial revolution”.
Between 2008 and 2018, there was a significant reduction in income growth for the richest 1%, who were hit hard by the 2008 financial crisis. On the contrary, during this same decade, the strongest growth concerned the world’s poorest.
However, this evolution does not imply a de facto reduction in global inequality. Insofar as China is now a middle-income country (and its population is no longer heavily represented in the poorest 20%), its continued growth no longer reduces global inequality. On the contrary, it risks contributing to widening global inequalities, as the income gap between China and the poorest African countries widens.
The 2008 crisis changed the shape of the elephant curve
Reading: the top 1% of global income earners saw their incomes grow by around 1.2% a year between 2008 and 2018.
Note: Despite the shape of the curve, which attests to faster growth in the lowest incomes between 2008 and 2018, orders of magnitude must be taken into account: while in 2008 the 10% lowest incomes had an annual income of around $400 PPP, the 1% highest incomes had an annual income of over $50,000 PPP. Despite stronger growth in low incomes over this period, wealth disparities remain very significant on a global scale.
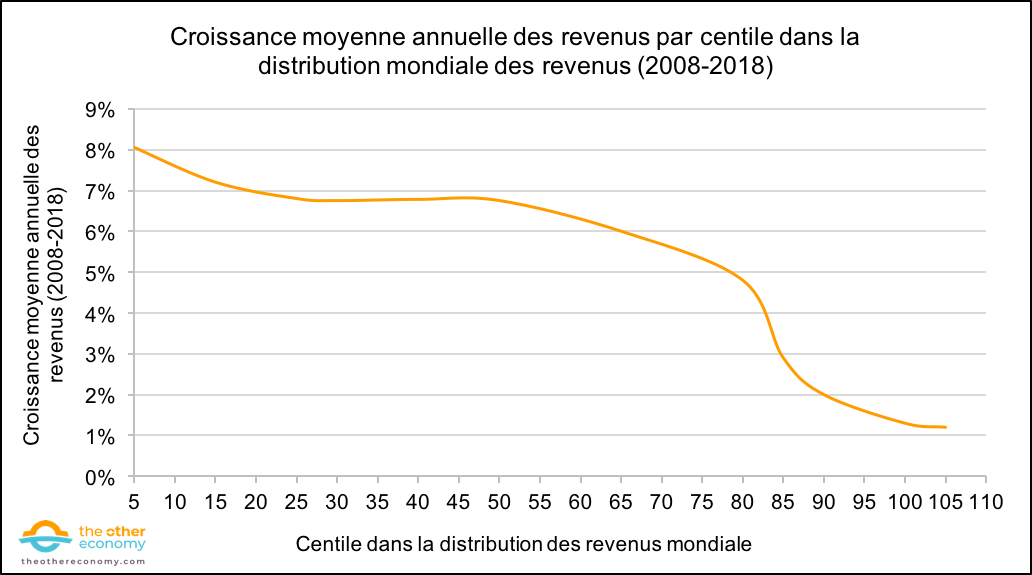
Source Branko Milanovic, The Three Eras of Global Inequality, 1820-2020, with the Focus on the Past Thirty Years, World Development, 2024.(download the preprint here)
Finally, as we pointed out in our How to measure poverty? monetary considerations are not sufficient to fully characterize poverty.
That’s why we’ve introduced the notion of “multidimensional poverty”, which characterizes poverty by taking into account access to education, health, food and so on.
For example, in 2022, 2.4 billion people in the world were food insecure (i.e., people without access to healthy, nutritious food in sufficient quantity throughout the year): of these, 750 million suffered from hunger.24
Not everyone benefited from free trade and free movement of capital
The recent rise in inequality can also be explained by the promotion of free trade since the 1980s. 25 The last forty years have been marked by a determination to eliminate customs duties and trade barriers between countries, which, according to neoclassical economists, should ultimately stimulate economic growth and benefit everyone.
Nevertheless, it has to be said that free trade has contributed to widening income inequalities within wealthy countries, and to enriching the wealthiest. In 2007, Paul Krugman, winner of the Nobel Prize in Economics, conceded as much 26 and promoter of free trade in the 1980-90s.
“It’s no longer safe to say that the effects of trade on income distribution in rich countries are fairly minor. There is now good reason to say that they are important, and becoming increasingly so.”
In particular, competition from imported products from countries with low labor costs (and low environmental standards) has pushed down low wages in developed countries.
The automotive industry in the United States provides a concrete illustration of this phenomenon, all the more relevant given its significant weight in the economy. Since the 1980s, low-cost imports of vehicles from Asia have had a major impact on jobs in this sector, particularly in the blue-collar sector. This has resulted in a fall in real hourly wages (i.e. taking inflation into account) of over 20% between 1980 and 2018. 27
What’s more, faced with a cheap and flexible workforce 28 mainly in Asia, and rising unemployment in the West, policies to make work more flexible have been put in place in Europe and the United States in particular – with part-time work, the development of temporary employment agencies, and so on. 29 As pointed out in a 1996 report commissioned by the French Prime Minister, such measures – which were supposed to reduce unemployment and boost economic activity – have actually contributed to worsening income inequalities, failing to encourage training, and creating mostly precarious, temporary, low-paying jobs. 30 This dynamic has been amplified since the 2010s with the uberization of certain professions (delivery drivers, among others). These workers are often in a precarious situation – on an EU scale, 55% of them earned less than the minimum hourly wage in force in their country in 2021. 31
Finally, the liberalization of capital flows and, more generally, the financialization of the economy have also contributed to the growth of internal inequalities within developed countries.
This liberalization has, in fact, mainly benefited wealthy individuals, offering them greater access to sources of financing and new investment opportunities abroad. Predictably, it is mainly the wealthy who can take advantage of these opportunities – the middle and lower classes having little or no access to international markets. What’s more, people working in the financial industry (banks, investment funds) in particular have seen their salaries soar in recent decades – not least via the annual bonus system – contributing to a widening gap with the rest of the population. 32
In recent years, capital owners have been able to diversify, secure and increase the income from their asset portfolios, thanks in particular to the liberalization of capital flows. 33 As Olivier Passet, Director of Economic Synthesis at Xerfi, points out, this has accentuated the growth in wealth inequalities, through a surge in financial asset prices:
Capital gains […] have been the number 1 source of concentrated wealth effects for the past three decades. […] Above all, we need to question the metabolism of finance, whose profitability is increasingly built on these capital gains. With asset management players increasingly concentrated and influential, “too big to fail”, and central banks whose primary mission is to keep asset prices weightless, at the risk of causing the finance world to tumble.
Find out more
- Pierre-Noël Giraud, The Inequality of the World. Économie du monde contemporain, Gallimard, 2019
- Branko Milanovic, Global Inequality: A New Approach for the Age of Globalization, Harvard University Press, 2018
- Michael Förster, Odile Rouhban, Céline Thévenot, Inequality in OECD countries: the gap between rich and poor is widening, Après-demain, 2016
- Fifty shades of flexible working in the UK, Le Monde (24/03/2019)
- Martin Anota, At the roots of Trumpism, Reaganomics, blog post, (09/11/2018)
Inequalities in income and pollution are linked
Not all types of pollution are correlated with income
On a global scale, while rich countries emit more greenhouse gases per capita than poor countries, this is not necessarily the case for all types of pollution.
CO2 emissions
As the following graph shows, GDP per capita is strongly correlated with CO2 emissions (excluding deforestation).
CO2 emissions per capita (from fossil fuel combustion) as a function of GDP per capita
Reading: In the USA, in 2022, GDP per capita is around $60,000 and each inhabitant emits an average of 15 tonnes of CO2 per year.
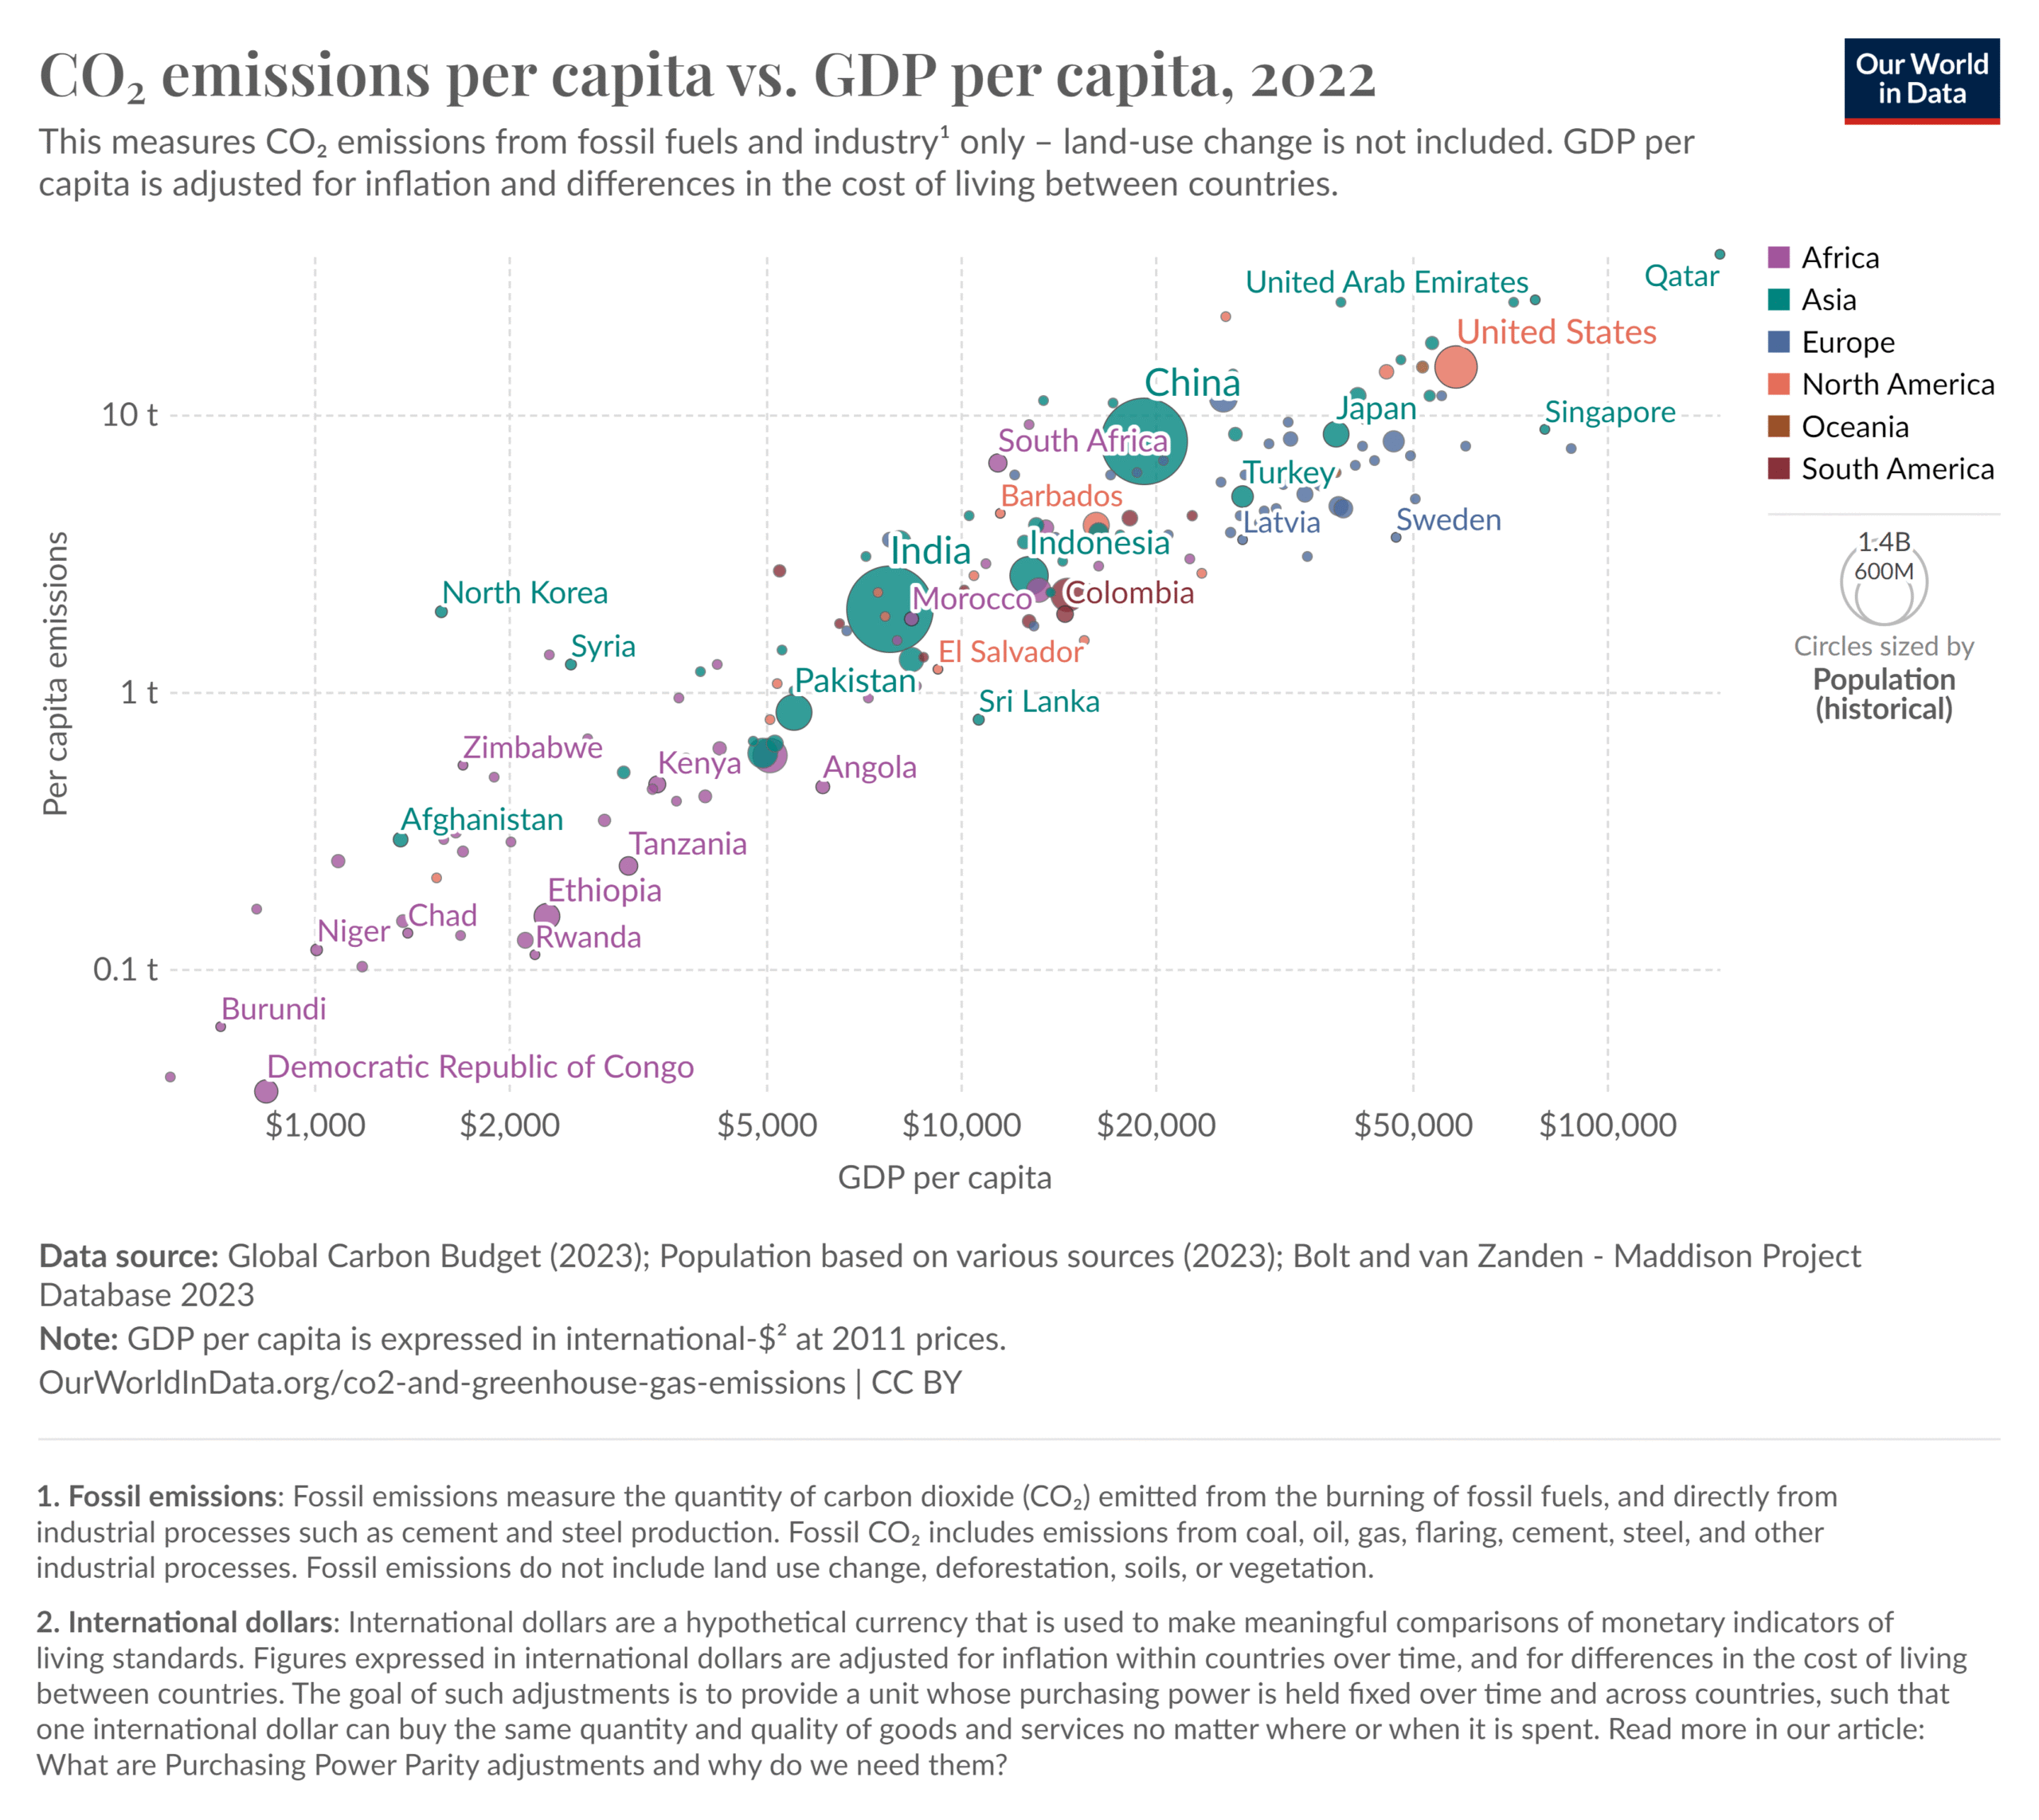
Source Source : CO₂ emissions per capita vs. GDP per capita, Our World in Data, 2024.
This correlation is even more marked if we look not at territorial CO2 emissions, as in the case above, but at the carbon footprint, which measures emissions induced by consumption.34
Material extraction
Created in 2007 by UNEP, the International Resource Panel studies the characteristics and impact of the way societies and economies extract, use and dispose of natural resources: biomass (crops, crop residues, grazed biomass, wood and fisheries), fossil fuels, metals and non-metallic minerals (sand, gravel, clay).
As explained in the Global Resources Outlook 2024 report, the extraction, use and end-of-life of natural resources are accompanied by multiple forms of environmental pollution and degradation. Indicators in this field are therefore good approximations of the overall pressure exerted by human activities on the environment.
The domestic extraction indicator measures the materials harvested (agriculture, forestry and fishing) or extracted (mining and quarrying) on a country’s territory. The material footprint indicator, on the other hand, measures all the resources mobilized worldwide to enable a country’s consumption.
The two graphs below show a correlation between the material indicators and GDP per capita, albeit less clear-cut than for CO2 emissions.
It should also be noted that the correlation is more marked for the material footprint indicator than for the extraction indicator. This is quite logical: the countries from which natural resources are extracted are not necessarily those where they are ultimately consumed (whether directly, as in the case of food, or once processed and incorporated into goods). In particular, this means that the people who suffer the negative consequences associated with the extraction of materials (particularly when mining activities are involved) are not always those who benefit from the products made from these materials.
Extraction and material footprint vs GDP per capita in 2021 for all countries in the world.
Reading: France has a GDP per capita of around $40,000 in 2021, a material extraction index of 11 and a material footprint index of 18. The higher the extraction index, the more materials (agriculture, mining, etc.) the country extracts from its territory. The higher the material footprint index, the more resources the country mobilizes globally to ensure its own consumption.
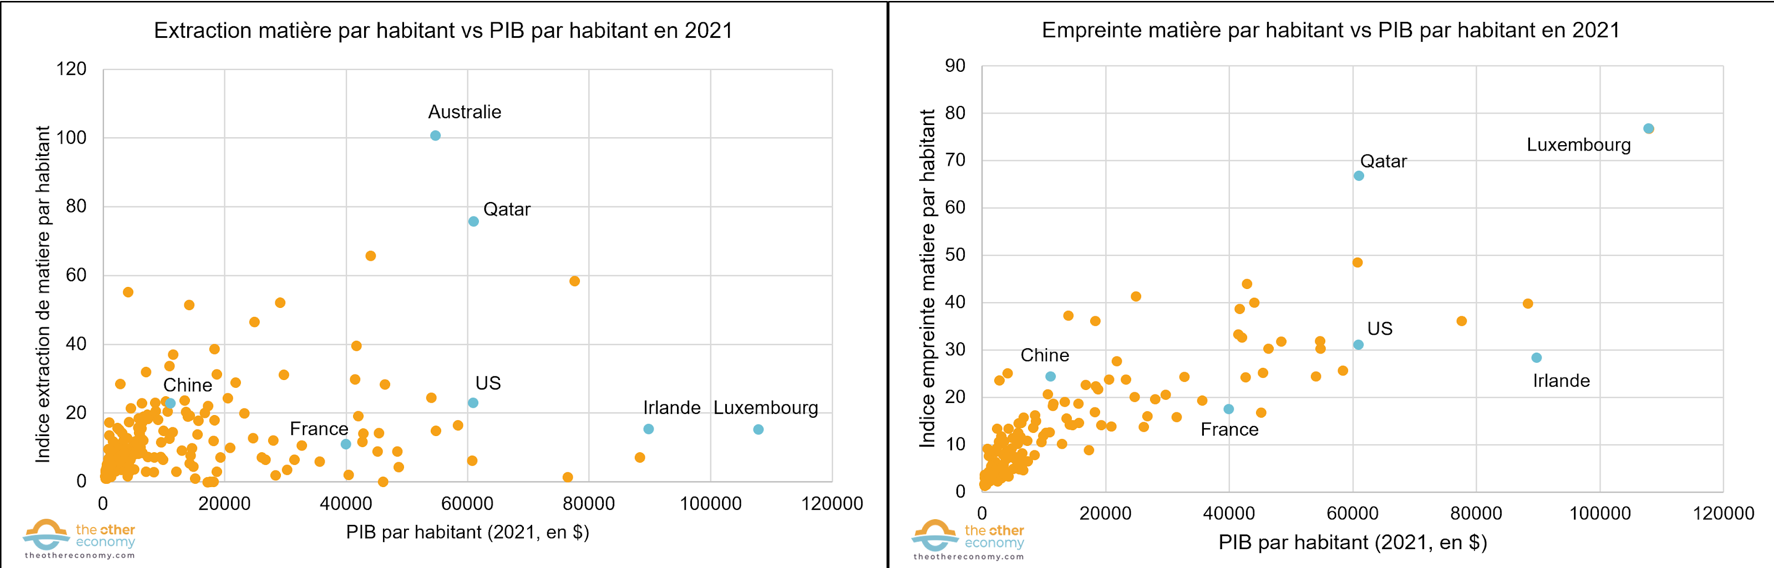
Source Global Material flows Database for material footprint per capita and Our world in data for GDP per capita.
Exposure to local pollutions
Pollutions that happen at a more local level (air, soil, water, plastic, chemical, noise, etc.) are generally lower in wealthier countries.
Indeed, these countries have the means to control emission levels, enforce environmental standards and treat waste. Their inhabitants also have the means to pay higher prices for less polluting goods and services. What’s more, rich countries are often in an economic situation that enables them to relocate polluting production and waste treatment to countries with less stringent standards.
Exposure to fine particle pollution as a function of GDP per capita
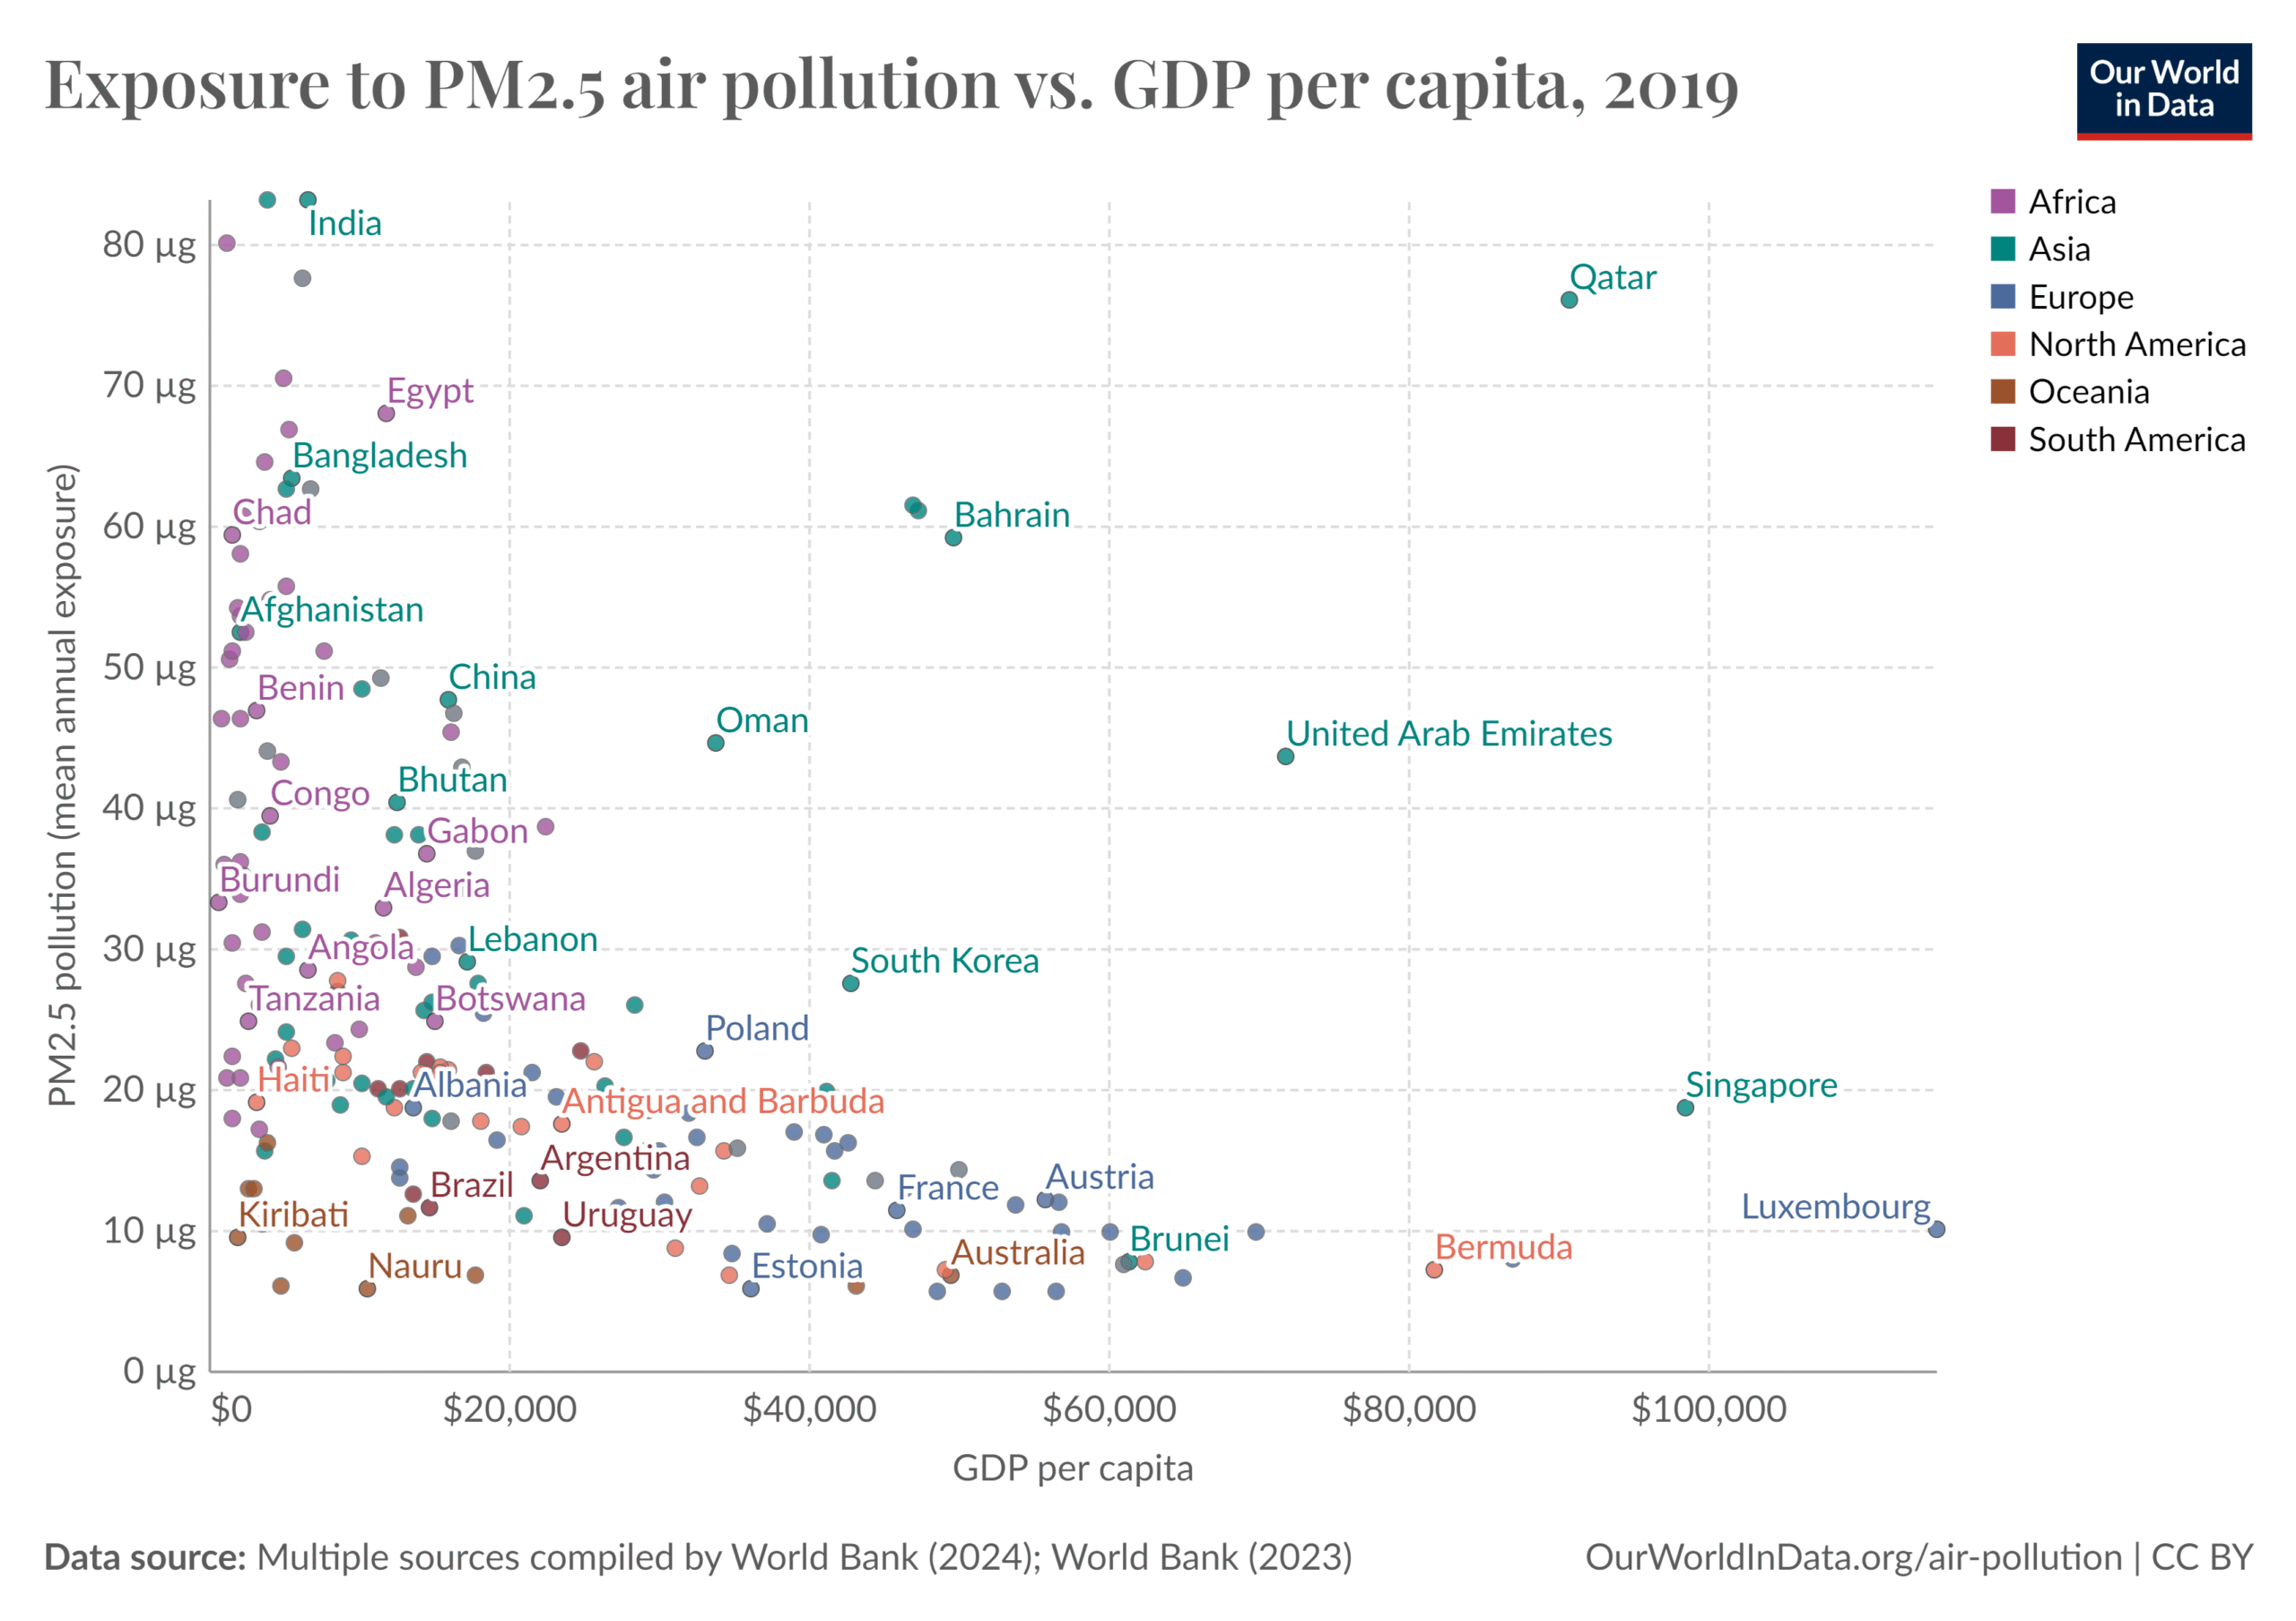
Source Exposure to PM2.5 air pollution vs. GDP per capita, 2017, Our World in Data.
Within a given country, greenhouse gas emissions are partly correlated with income.
On a national scale, inequalities in income and wealth obviously have an effect on the distribution of pollution between individuals.
When we consider the carbon footprint of individuals, i.e. the emissions induced by their consumption, 34 inequalities in emissions roughly follow inequalities in income. The higher an individual’s income, the more CO2 he or she emits, and therefore the more unequal a country is in terms of income, the more unequal it is in terms of greenhouse gas emissions.
It should be noted, however, that inequalities in CO2 emissions are less marked than inequalities in income. Firstly, wealthier households tend to save a larger proportion of their income, which by definition has no impact on the emissions linked to their consumption. 36
What’s more, the richest households emit proportionally less CO2 when they spend €1, than the poorest households. This is explained by two effects: the structure effect and the quality effect, highlighted by Antonin Pottier, Emmanuel Combet, Jean-Michel Cayla, Simona de Lauretis and Franck Nadaud in a study published in 2020, using INSEE data. 37
The structure effect refers to the fact that the consumption structure changes according to the decile. 38 of household income. Poorer households spend more of their income on CO2-emitting goods (home heating, transport, etc.), while richer households can spend more of their income on low-emission goods and services (i.e., the share of services in consumption increases as individual income rises).
The quality effect refers to the fact that for the same good or service, a wealthy household will be able to consume a proportionally lower-emitting version. For example, making a €4,000 luxury bag doesn’t emit 100 times more CO2 than a €40 bag, but perhaps “just” 10 times more, or even as much. This means that the carbon intensity of consumption by the wealthy classes is lower than that of the working classes.
Antonin Pottier and his colleagues point out that “the standard method for calculating household carbon footprints neglects […] the quality effect. It is possible that the quality effect plays down and that the method thus leads to overestimating the emissions of the wealthiest classes.”
The poorest people obviously don’t choose this situation, but are simply forced to consume gas to heat their homes or fuel to get around, without being able to buy labor-intensive products such as luxury goods.
In addition to income inequalities, geographical location also influences greenhouse gas (GHG) emissions. Insee explains that emissions generated by private car travel “vary markedly by department: they are low in highly urbanized departments (0.4 tCO2e per adult on average in 2019 in Paris, 0.7 in the inner suburbs, 1.0 in the Rhône), but exceed 1.5 tCO2e per adult in 15 departments, most of which are predominantly rural”. 39
Carbon footprint inequalities in France in 2011 by household: the average view by living standard decile, segmented by consumption item.
Reading: the 10% highest-income households in France in 2011 had a carbon footprint of around 33 tonnes of CO2 equivalent. Fuel is their number one CO2 emission per capita (around 10 tCO2e).
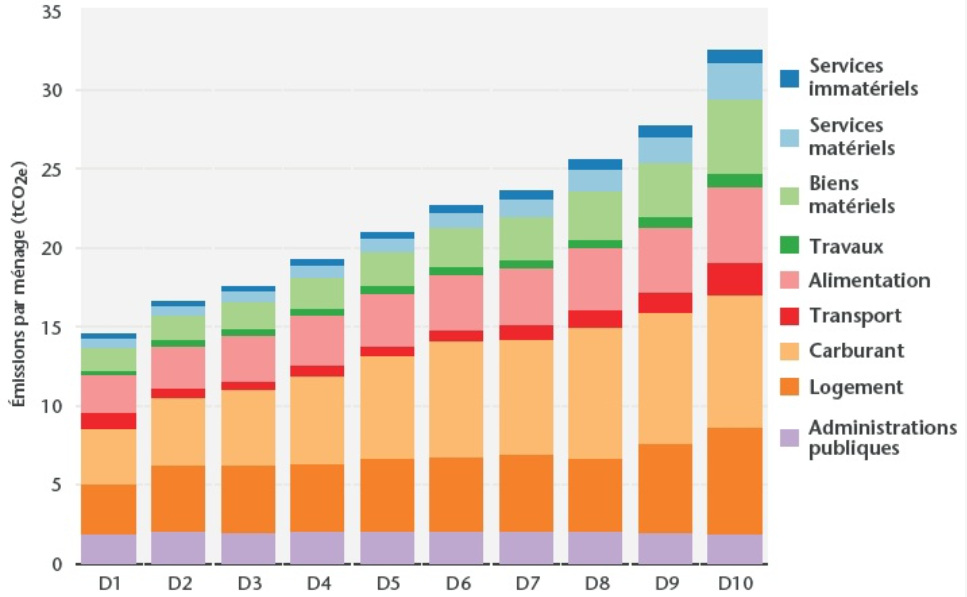
Source Antonin Pottier, et al, Who emits CO2? A critical overview of ecological inequalities in France, OFCE Review, 2020.
While there is an 8.8 ratio between the standard of living 40 of households in the last decile 38 and that of the top decile in France in 2011, this ratio is only 2.2 for the level of greenhouse gas emissions. Inequalities in CO2 emissions (in terms of consumption) are therefore more “crushed” than inequalities in income. However, this observation should not obscure the fact that the emissions of the richest are higher in absolute terms, even though they have more financial leeway to reduce them.
Moreover, it’s important to bear in mind that we’re only talking here about inequalities in carbon footprints linked to consumption. In fact, as we explained in Counting GHG emissions, there are different ways of attributing greenhouse gas emissions, reflecting political choices. For example, GHG emissions can be attributed to the shareholders of companies whose direct and indirect activities are a source of emissions.
In this case, inequalities in GHG emissions would broadly follow inequalities in financial wealth (which are far more pronounced than income inequalities). Oxfam, for example, points out that the financial wealth of France’s 63 billionaires is responsible for emitting as much greenhouse gas as that of 50% of the French population. 42 While the methodology is open to debate, the fact remains that this allocation of emissions according to financial wealth makes sense, given that (large) shareholders have real power to influence the transition of the companies whose shares they own, and that they have a priori the choice of investing their savings in other, more virtuous companies.
Find out more
- Antonin Pottier et al, Who emits CO2? A critical overview of ecological inequalities in France, OFCE Review, 2020.
- Global Resources Outlook 2024: Bend the Trend – Pathways to a liveable planet as resource use spikes, United Nations Environment Programme, 2024.
- Interview with Gaël Giraud Pour la planète, l’indispensable réduction des inégalités, CNRS Le journal (21/02/2020).
The concentration of wealth is due to economic and political choices
The increase in inequalities within developed countries since the 1980s – documented in Essentiel 3 – is sometimes presented as the consequence of inescapable economic evolutions, such as globalization shifting part of economic activity to emerging countries, or the development of digital technology creating a “digital divide” to the detriment of the less educated… While these phenomena are very real, it is misleading to abstract them from their political environment. As we detail in this Essentiel with the example of taxation, it is concrete political decisions, which can be revisited, that have led to the current situation.
The role of neoliberal reforms in the 1980s in increasing inequality
The 1970s/80s saw a turning point in the public policies of many countries. The neo-liberal theses of economists such as Milton Friedman and Friedrich Hayek 43 were gaining in popularity among decision-makers on both the right and the left: the aim was to promote the market economy, remove all constraints on free competition and trade, ensure price stability, and confine the State to the role of guardian of social order and the smooth functioning of markets.
This ideological evolution inspired reforms in many fields, carried out by conservative leaders such as Margaret Thatcher in the United Kingdom or Ronald Reagan in the United States, but also by social democrats such as Jacques Delors 44 in France.
These reforms, of which the following are just a few examples, have often resulted in increased inequality.
- The promotion ofcentral bank independence from governments and a monetary policy confined to price stability – which deprived governments of one of the fundamental tools of economic policy and still forces them to finance their deficits on the financial markets, making public policies dependent on the judgments of actors with no democratic legitimacy.
- The free movement of capital and the deregulation of finance have led to the financialization of the economy, with its proven negative consequences (financial crises, rising inequalities, shortening of corporate time horizons, abusive widespread consumption on credit), as well as the development of multinationals whose growing powers are excessive.
- The relaxation of labor laws and the reduction of trade union power, which have increased the dynamism of companies but plunged entire segments of the population into precariousness – see the example of the Hartz reforms in Germany. 45 ;
- Strict oversight of budgetary policies with, in the extreme case of the European Union, the adoption of strict rules that focus attention on budgetary calculations at the expense of more vital issues. This is reflected, in particular, in a constant discourse stigmatizing taxes and aiming to reduce public spending, i.e. social benefits and the cost of public services (notably education), and therefore their redistributive effect, described in Essentiel 6;
- The orientation of law and corporate governance towards maximizing profits in order to remunerate shareholders, with damaging consequences in ecological and social terms, and even for the long-term survival of the company itself;
- The development of a race to the bottom in terms of tax, which we develop in the following section.
The race to the bottom fuels inequality
The last three decades have been marked by deleterious tax competition, fuelled by neo-liberal rhetoric that sees taxation as a source of economic inefficiency. This trend has been exacerbated by the development of international tax evasion and tax havens (some of which are located in the heart of the European Union – the Netherlands, Luxembourg, Ireland – or in the United States), exerting downward pressure on governments.
Anti-tax economic theories
What various “economic theories” have in common is that they justify tax cuts (particularly those levied on the wealthiest economic players) on the grounds that they will benefit the economy and society as a whole.
- Taxes cause economic distortions
For neo-liberal economists, the competitive market enables supply and demand to meet, setting prices and thus establishing the value of goods and services, with a view to achieving a situation of equilibrium, a theoretical “social optimum”. 46 . Taxes introduce “distortions” into prices, which no longer reflect production costs alone. They therefore provide “artificial” incentives (in favor of capital or labor, in favor of certain products rather than others) that reduce economic activity (away from the optimum).
Find out more in our supply policy fact sheet.
- The Laffer curve
Drawn on a nape by Arthur Laffer in 1974 47 this curve represents the adage “too much tax kills tax”: when the tax rate rises, companies and workers have less incentive to produce or work, which reduces the tax base. 48 . It is therefore possible that the loss of revenue linked to this reduction is greater than the increase in revenue resulting from the rise in the tax rate.
Find out more in our “Runoff theory” fact sheet.””
- The Ramsey rule
According to this “rule”, formulated by the economist Frank Ramsey in 1927, the optimal tax rate is inversely proportional to the elasticity of the tax base. 49 of taxable income. If we consider that the income declared by the wealthiest is highly elastic (i.e., very sensitive to tax increases), it is inefficient to tax the rich heavily in order to raise taxes, as they would react by hiding their income, moving abroad or working less. According to empirical studies 50 the elasticity of income to taxation is actually quite low, which can be explained by a number of factors: entrepreneurs may have other motivations than financial gain alone; individuals are attached to their country by numerous ties; tax exemption possibilities are not unlimited.
Many governments have reduced the statutory corporate tax rate and the top marginal income tax rate. There has also been a decline in wealth taxes, which were already very low. Lastly, in addition to corporate income tax, the aim is to reduce all compulsory levies on companies (social security contributions and production taxes) in order to ensure their competitiveness, in line with supply-side policies.
A veritable “tax race to the bottom” has thus taken place over the last few decades. While some countries (notably tax havens) are able to take advantage of this situation 51 ), this strategy can only be a losing one overall.
This was underlined by Janet Yellen, US Treasury Secretary, on the day when nearly 140 countries and jurisdictions adopted a global minimum corporate tax.
Today is a historic day for economic diplomacy. For decades, the United States has participated in a counterproductive international tax competition, lowering its corporate tax rates only to see other countries lower theirs in response. The result was a global race to the bottom: who could cut their corporate tax rate further and faster?
No nation has won this race. Lower tax rates have not only failed to attract new business, they have also deprived countries of funding for important investments such as infrastructure, education and anti-pandemic efforts.
Faced with the loss of tax revenues induced by this race to the bottom, as well as by international tax evasion, governments are forced either to increase other taxes (particularly those levied on consumption, such as VAT, and therefore on the population as a whole), or to reduce some of the public spending that has a redistributive effect (social benefits, social policies, funding of public services _seeEssentiel 6). This is a primary cause of increased inequality.
The second reason is the specific nature of the taxes that have been cut the most, and the fact that they mainly concern the wealthiest sections of the population. In fact, the dual dynamic of tax cuts and international tax evasion particularly affects taxes with a base of 48 is relatively mobile (in a context of free movement of capital): the profits of multinational companies, taxes on the income of the most affluent and on wealth.
For example, the people who benefit from lower corporate taxes and tax evasion by multinationals (via dividends or rising share values) are well-to-do, or even very well-to-do: in 2021, only 6.6% of French people – the vast majority of whom are senior executives and self-employed – owned shares. 53 . At the other end of the spectrum, the loss of revenue for governments undermines their ability to implement social policies, and thus to help the most disadvantaged.
– States’ guilty laissez-faire attitude towards tax evasion and tax havens
International tax evasion by wealthy individuals and multinationals consists in playing with the loopholes and asymmetries of different tax systems, in order to place, legally or by fraud, part of their assets and/or income in low-tax countries, without expatriating there. In the early 2020s, the amounts involved were estimated at $350 billion in lost annual tax revenue.
International tax evasion began to develop with the opening up of capital markets in the 1970s and 1980s. Tax havens 54 some of which had existed since the 19th century, came into their own at the heart of the ultra-complex legal and financial structures of offshore finance. Wealthy individuals hid part of their wealth and the income derived from it. Multinationals transfer part of their profits via various schemes that exploit the loopholes in national tax systems. Banks and other financial institutions hide part of their risky activities.
If international tax evasion is not the result of a deliberate policy on the part of governments, it has benefited from the complicity of international finance and a guilty laissez-faire attitude on the part of public authorities for decades. “We mustn’t forget that it was the investment banks who, thanks to globalization, offered tax products in the 1990s, which created these excesses. And the states didn’t coordinate and create an avenue for tax advice.” 55
Find out more in our fact sheet on tax evasion and tax havens.
The emblematic example of corporate income tax
The reduction in the corporate income tax rate is a good example of the concomitance of the two dynamics mentioned above. It is fuelled by :
- On the one hand, there is the argument that low taxation is essential to the competitiveness of national companies, to attracting investment from multinationals, and thus benefiting the entire economy (on this reasoning, see Misconceptions 2 and 3);
- on the other, by the fear of multinationals declaring their profits in other countries with more accommodating tax regimes.56
In the United States, the top marginal corporate tax rate was still 50% in the early 1980s; it fell to 38% in 1993, and Donald Trump’s 2017 tax reform endorsed a 21% “flat tax” for all companies. In France, the standard rate has fallen from 50% in 1986 to 25% today; in the UK, the main rate was 50% in 1983 versus 19% in 2022.
Average statutory corporate tax rate by region and decade
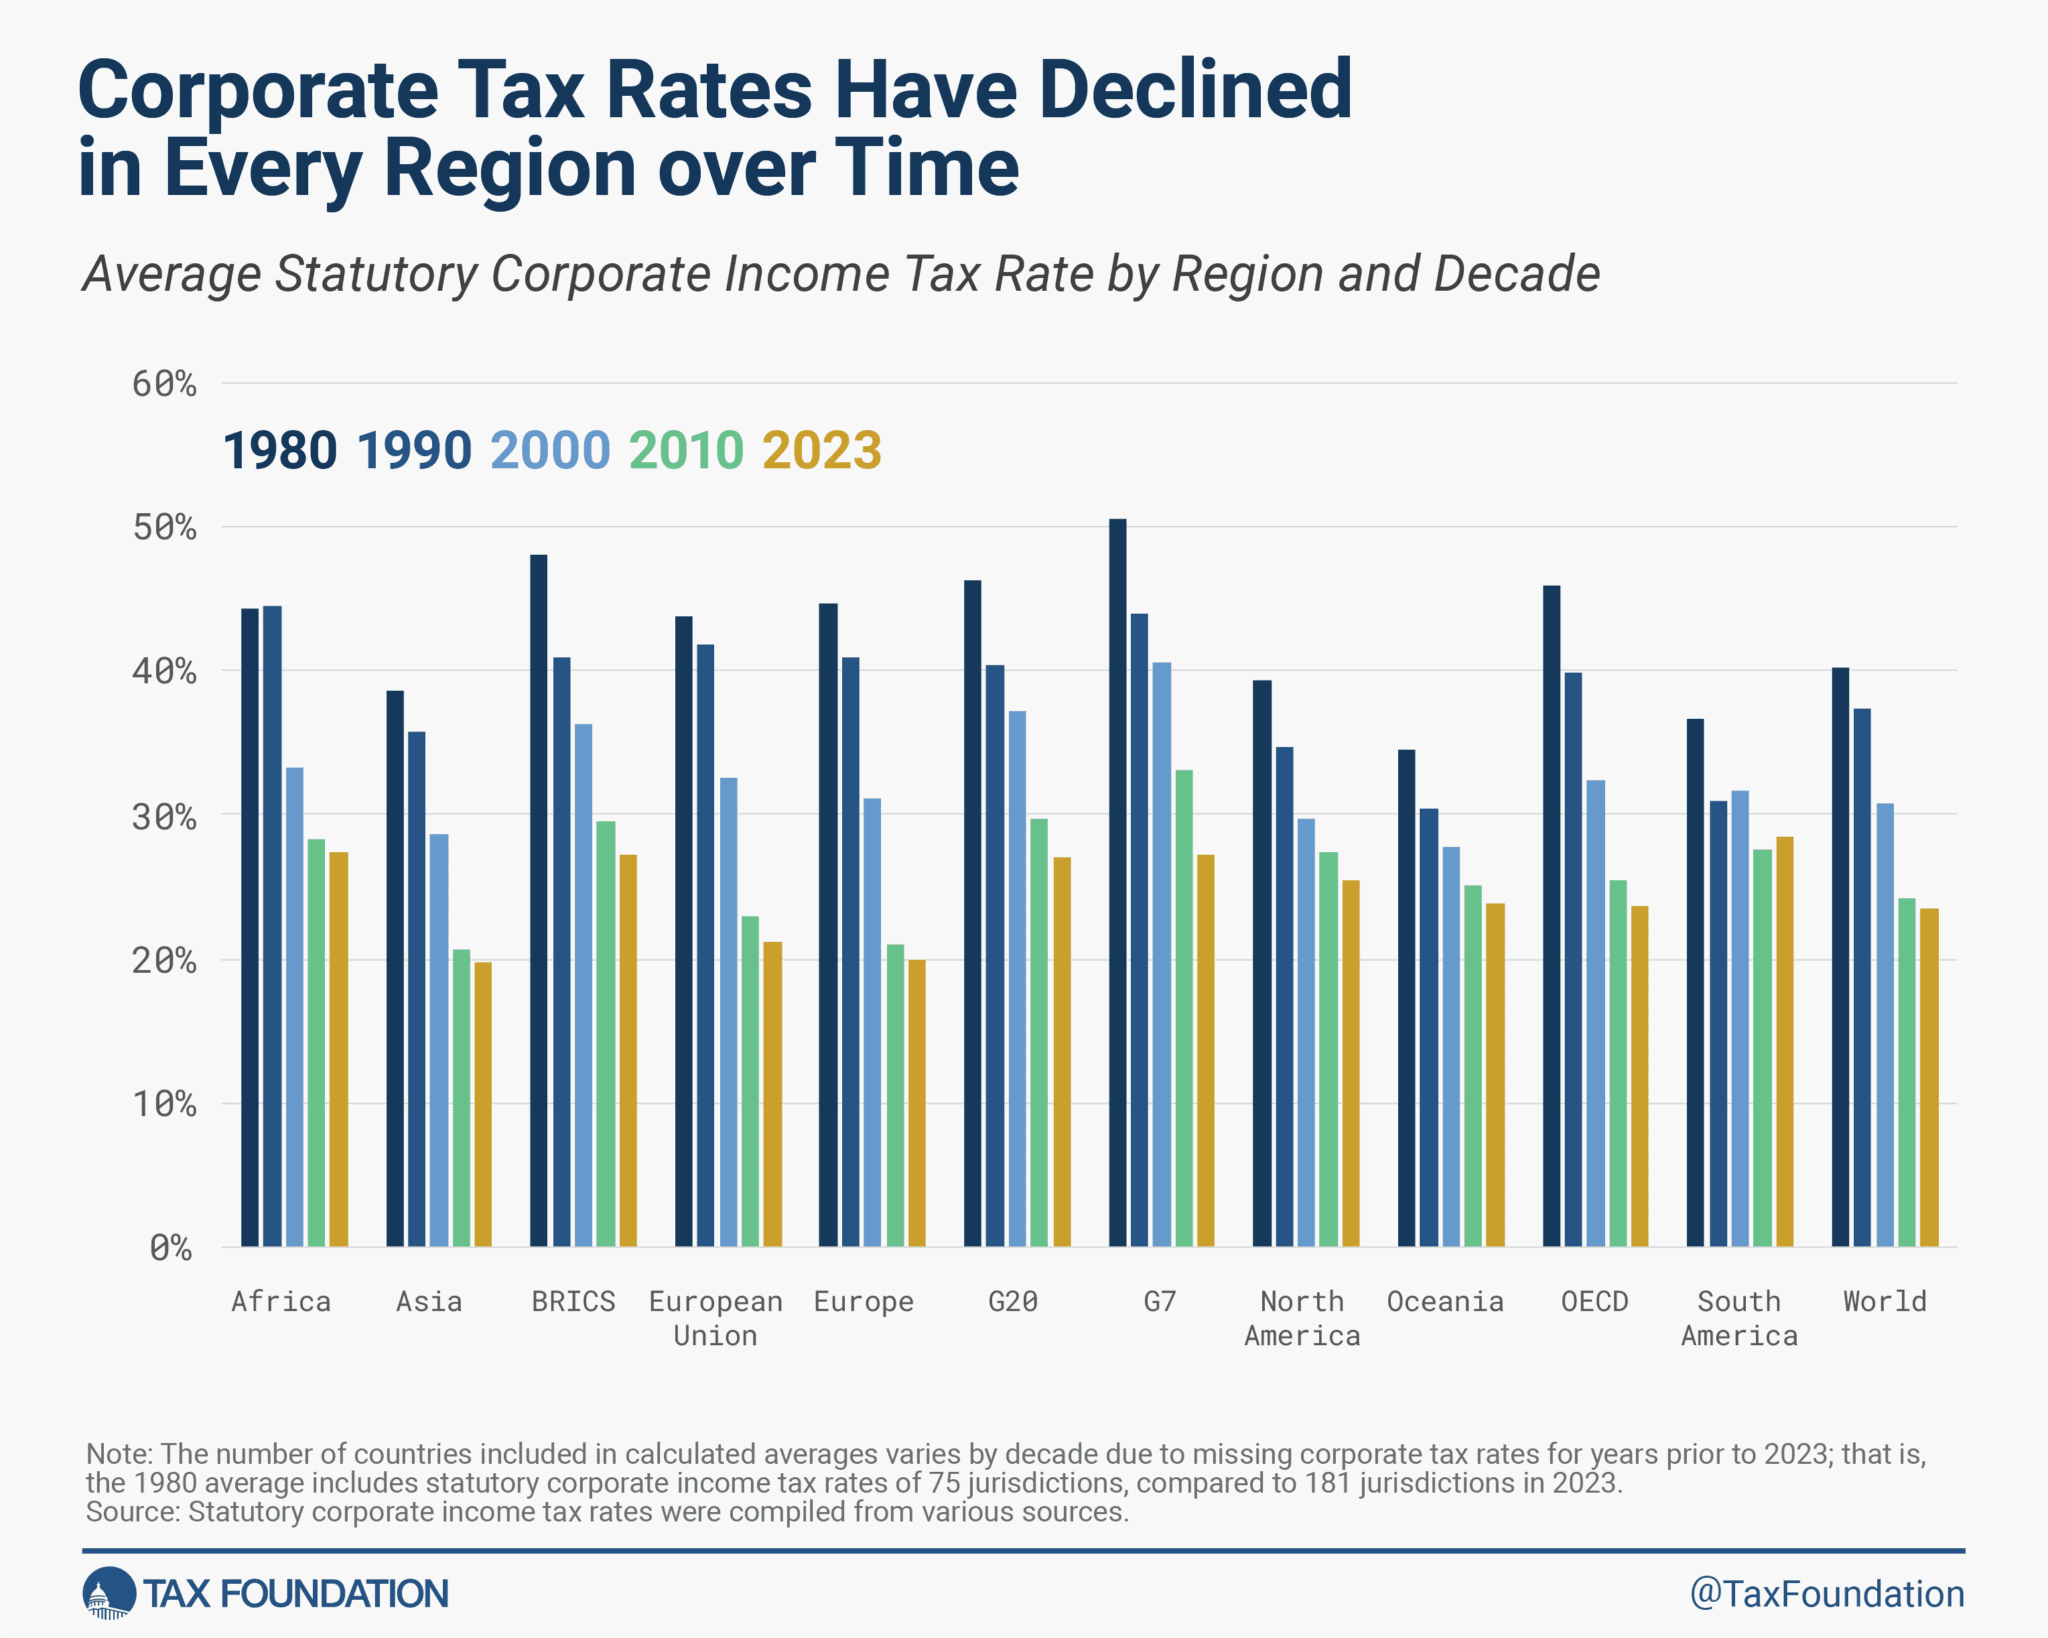
Source Corporate Tax Rates around the World, Tax Foundation, 2023
Heritage has always been little taxed
We explain in Essentiel 7 and Idée reçue 6 that the accumulation and transmission of wealth are at the heart of the dynamics of inequality. In essence, these mechanisms are cumulative: wealth (real estate and financial assets) generates income (rents, dividends, etc.), which makes it possible to acquire more assets and pass them on to descendants. Taxation is the main lever for deconcentrating wealth.
Left to its own devices, this mechanism runs the risk of converging towards a rentier society like the Europe of the early 20th century, where 80% of household wealth came from inheritance. Down to 34% in 1970, this figure had risen to 55% in France by 2010. 57 Yet very few political measures have been deployed in recent years to curb this trend.
The wealth tax, which explicitly targets the highest wealth, has existed in only a small number of countries, and was abolished in many European countries in the 1990s. In France, it was replaced by a tax on real estate wealth alone in 2017, considerably reducing its base 48 resulting in an estimated shortfall of 4.5 billion euros by 2022 59 (1% of the national budget). Many countries nevertheless levy taxes on real estate wealth (the taxe foncière in France), but these leave out a large proportion of total wealth. 60
Added to this is the fact that inheritance taxes are low in many Western countries. The effective average rate 61 is around 5-10% in several countries (including France at 4.5%). 62 Some countries (Portugal, Austria, the Czech Republic, Sweden and Norway) have abolished inheritance tax altogether.
Regressive tax systems
The different dynamics outlined above are partly responsible for the regressivity of tax systems: the poorest people devote a higher proportion of their income to taxation than the richest individuals. This is linked to the fact that, in most tax systems, revenue comes mainly from taxes on consumption and earned income. This is how, for example, the OECD showed in 2023 that, in the majority of countries, “taxpayers who earn at least part of their income from dividends have a lower effective tax rate than people earning wages alone.” 63
This can be seen by analyzing the French tax system.
This graph shows that the various taxes do not affect all classes of the population in the same way. Taxes on consumption (taxes on products) and social security contributions weigh heavily on the least well-off, whose entire income comes from work and who save very little. On the other side of the spectrum, taxes on capital income and wealth play an important role, but at lower rates.
It should be noted, however, that the regressivity of tax systems can then be corrected by redistribution mechanisms (i.e., the use made of taxes and social contributions). As explained in Essentiel 6, this is the case in France: redistribution mechanisms and public services help reduce inequalities.
The regressivity of tax systems is even more marked if we focus on the incomes of millionaires. This is what the work of Emmanuel Saez and Gabriel Zucman has shown for the United States, for example.
How taxes affect households differently depending on their standard of living
Reading: Standard of living is equal to household disposable income divided by the number of “consumption units” (CU) (1 CU for the first adult in the household, 0.5 CU for other people aged 14 or over, 0.3 CU for children under 14).
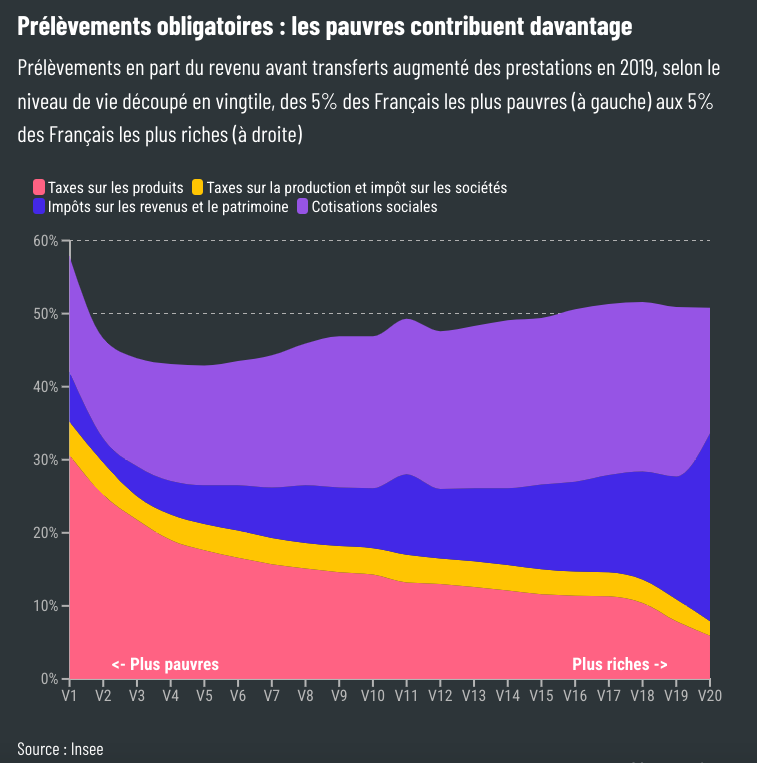
Source Budget 2025 Impôts : qui paie quoi?, Alternatives Économiques (18/09/24)
Evolution of the effective tax rate as a percentage of pre-tax income in the United States by population decile and for the 400 highest earners (1950 2018).
Reading: in 1960, the 400 highest earners in the US had an average tax rate of 70%. In 2018 it was around 22.5%.
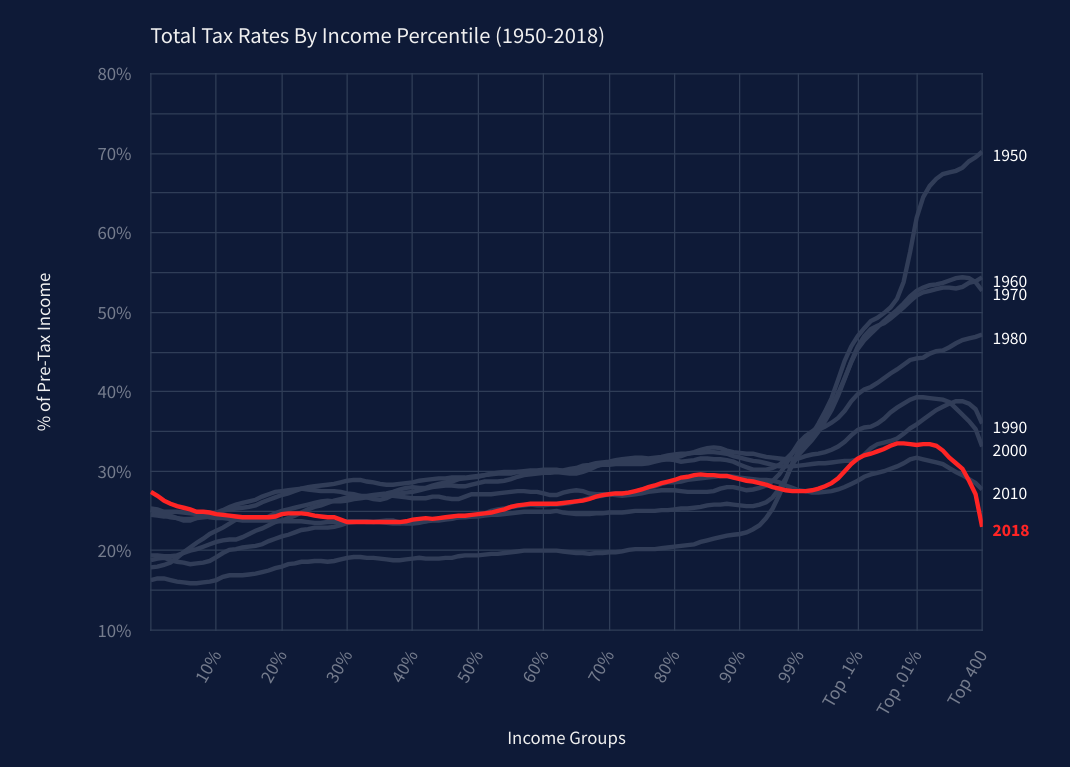
Source Tax Justice Network Database
Notes
1) Saez and Zucman point out that the top 400 for income coincides (with a few differences) with the top 400 for wealth. 64 This is the Top 400 for both income and wealth.
2) Details of the scope :
All compulsory levies are taken into account: consumption taxes, social security contributions, personal income tax, corporate income tax, property tax, inheritance tax. All taxes are attributed to individuals, even taxes paid by companies (in particular, corporate income tax is attributed to individual owners of shares).
Income includes all national income (measured according to standard national accounting definitions) before taxes and public transfers, and after pension payments. In the same way that corporate taxes are attributed to individuals holding shares in companies, profits are attributed to these same individuals (whether they are then distributed as dividends or retained within the company).
A half-hearted takeover of the tax issue
The financial crisis of 2007-2008 marked the start of the international community taking the tax issue in hand. It highlighted not only the role of tax havens in financial instability, but also the scale of international tax evasion and the extent of its negative consequences. The almost annual tax scandals uncovered by the International Consortium of Investigative Journalists (Panama Papers, LuxLeaks, etc.) since 2010 have only served to accentuate the legitimacy of this renewed focus.
Under the impetus of the G20, the OECD has launched several initiatives to combat international tax evasion.65
- Put an end to banking secrecy through the automatic and multilateral exchange of banking information, applied by more than 120 countries by 2024 (the United States having implemented a similar initiative as early as 2014 with the FATCA law).
- Adopt international standards to combat tax evasion by multinationals. The OECD/G20 Inclusive Framework on the BEPS project has adopted an action plan comprising 15 major types of measures. 66
One of the major successes of the BEPS project has been the adoption, in 2021, of a declaration approved by nearly 140 countries and jurisdictions on the implementation of a minimum 15% corporate income tax worldwide.67
This is a victory for two reasons: firstly, it makes it possible to combat tax evasion by multinationals (by imposing minimum taxation on profits, including those transferred to tax havens), and secondly, it puts a floor under the race to lower tax rates.
These advances have shown that forms of international cooperation previously considered utopian can take place. As the authors of the Global tax evasion report 2024 put it, “tax evasion is not a law of nature, but a political choice”: fatalistic speeches about the impossibility for states to impose overly powerful players in a globalized context are thus put to the test.
Nevertheless, there is still a long way to go before the tax system is restored to its rightful place.
On the one hand, despite real progress, efforts still need to be made in the field of tax evasion by wealthy individuals, due to:
- the limits of the automatic information exchange system (or the circumvention of the rules by certain players);
- the fact that this exchange only concerns financial assets (and not real estate);
- and that billionaires also evade taxes at national level (by holding a substantial proportion of their wealth in shares held by family holding companies, which in many countries, including France, are exempt from tax on dividends).68
On the other hand, as we have seen, international cooperation has focused on the fight against tax evasion: the logic of challenging the legitimacy of compulsory levies in the name of economic efficiency has not been called into question.
Several exemptions 69 have, for example, reduced the scope of the initial agreement on corporate income tax by a minimum of 15%. In particular, they are based on the idea that tax competition is not in itself illegitimate, but only the artificial transfer of profits.
In addition to lower corporate and personal income tax rates, tax competition now takes other forms. The European Tax Observatory 70 highlights the fact that, overthe past 15 years, a growing number of countries have introduced preferential tax regimes to attract high-income earners and wealthy individuals. These regimes target specific professions or income groups perceived as particularly mobile. Above all, since special regimes are mainly aimed at the wealthy, they reduce the progressivity of tax systems, which fuels inequality.
Redistributing wealth reduces inequality
The principle of redistribution is to correct certain inequalities in the name of solidarity. In this section, we limit ourselves to the case of redistribution on a national scale. Redistribution most often takes the form of income or wealth deductions from some people – generally those with the most – which are then shared with the population as a whole – particularly the most vulnerable – in various forms.
Correcting monetary inequalities upstream: wage controls
Distributed income can be controlled by means of a bottom-up (minimum wage) or top-down (maximum wage) wage control mechanism.
At the start of 2024, 22 of the 27 countries in the European Union (EU) had a national minimum wage. What’s more, in some countries – France, Belgium and Luxembourg – the minimum wage is indexed to price trends, to keep pace with the country’s economic situation. 71 .
The majority of EU member states have set a minimum wage, with significant variations between countries
Reading: in 2024, the gross minimum wage in Bulgaria was 477 euros per month.
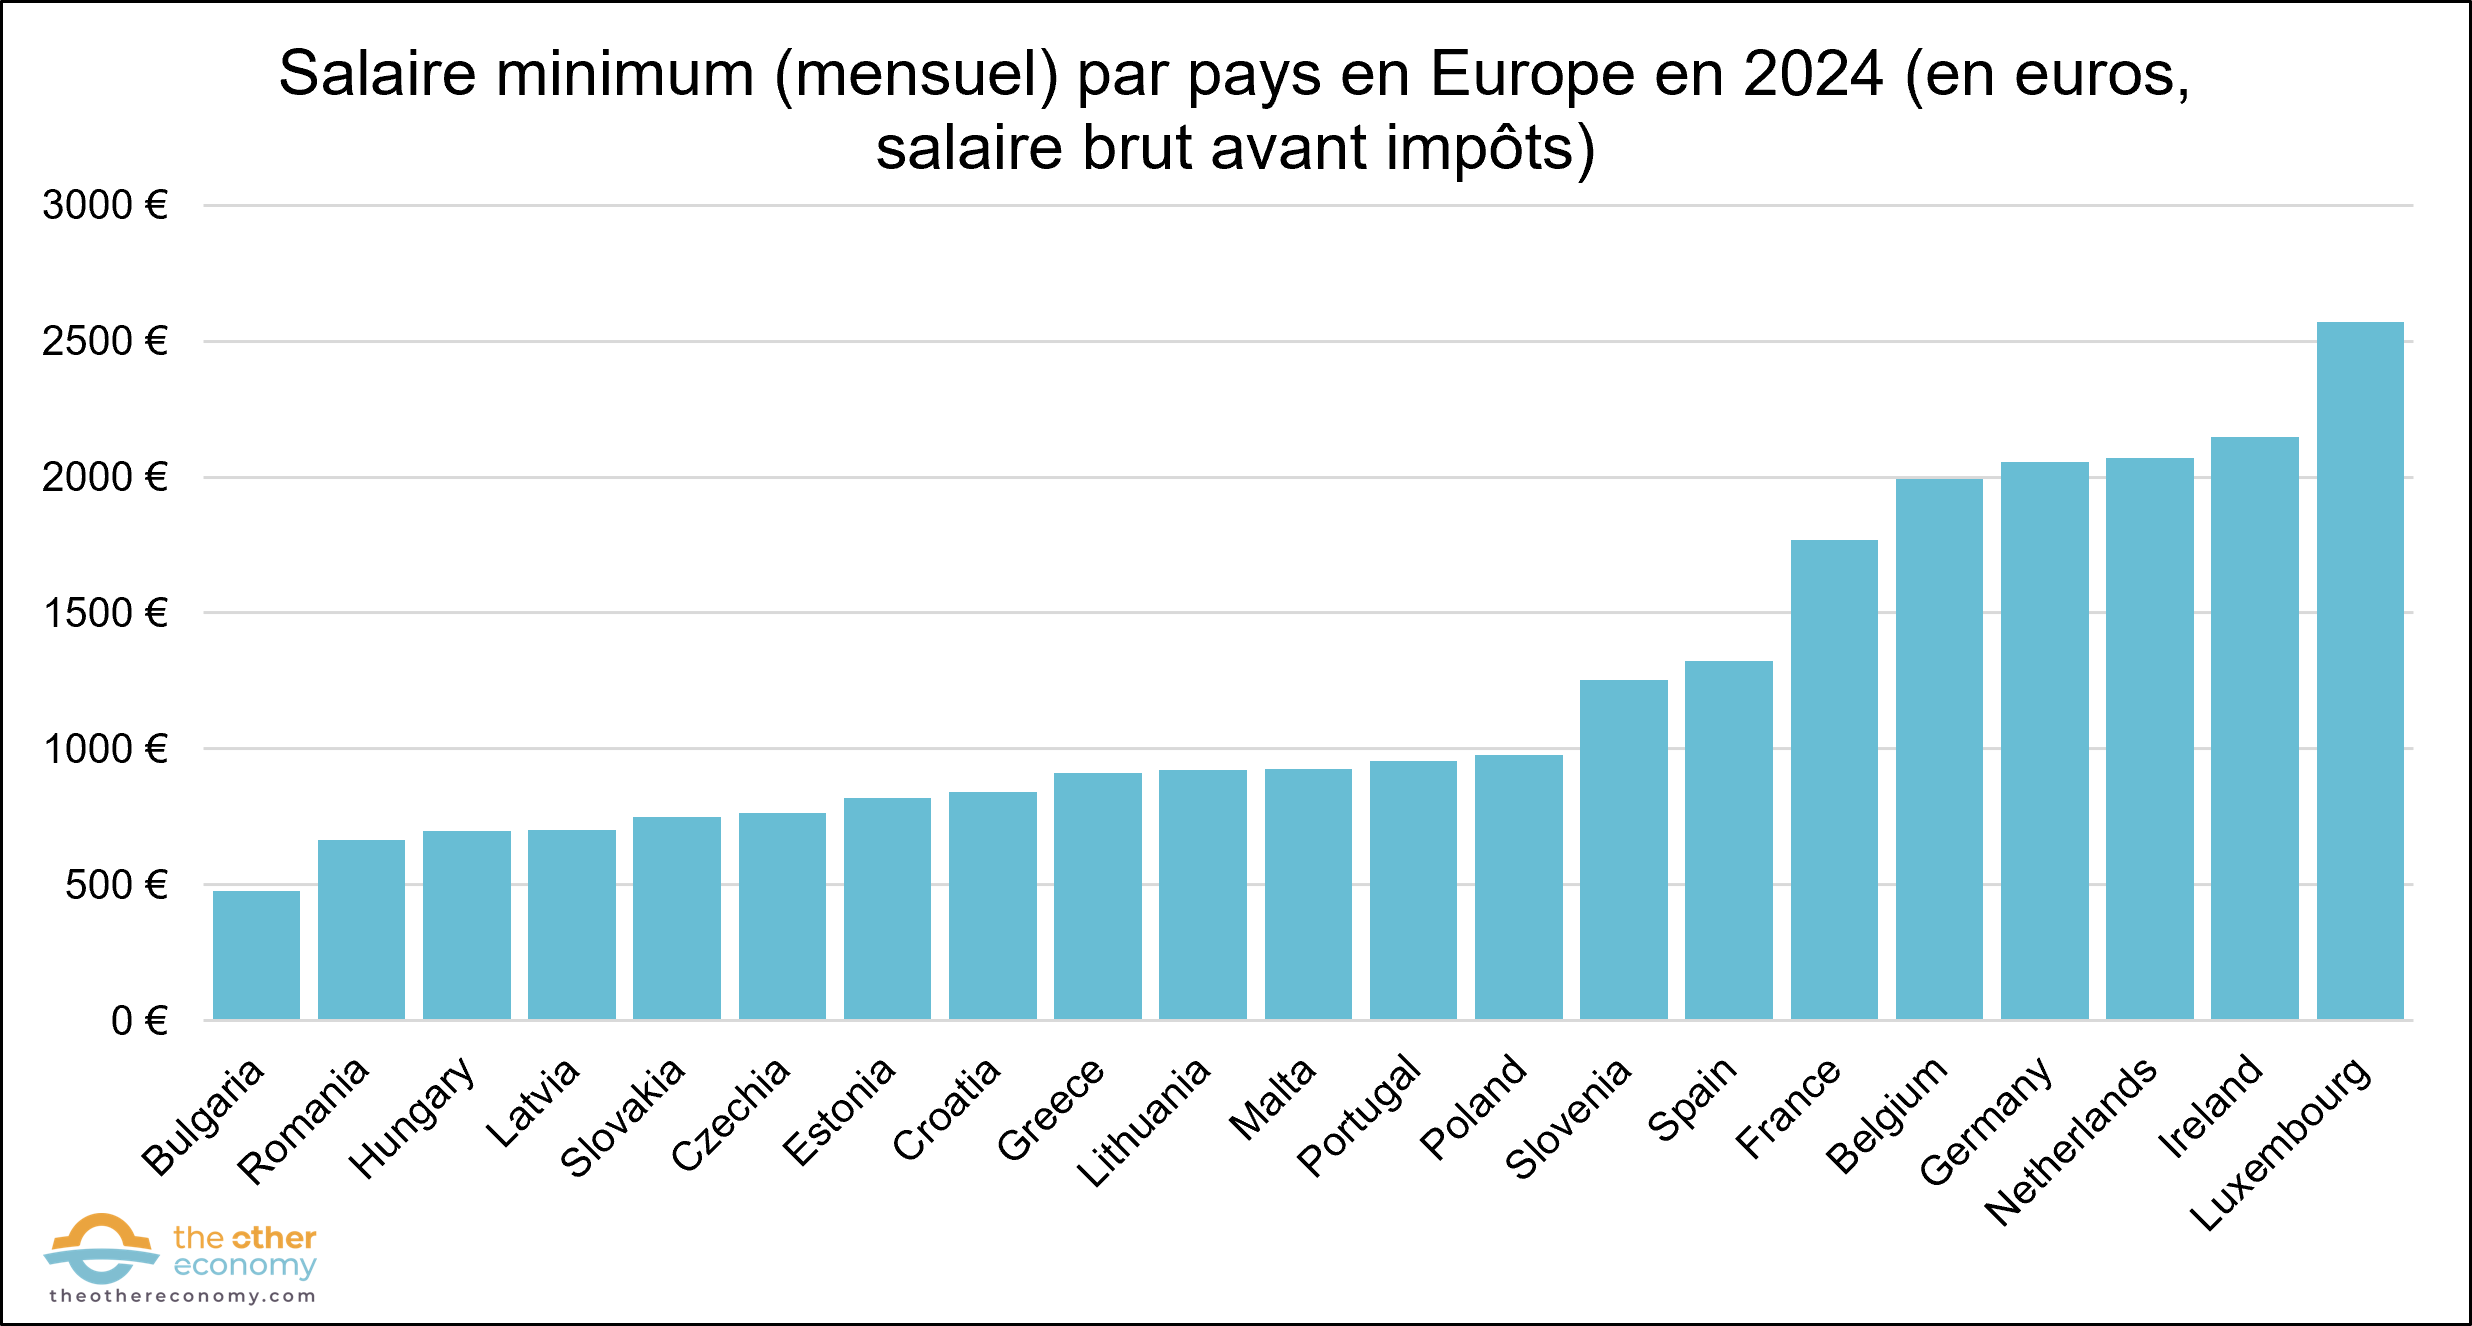
Source : Eurostat, January 2024
In the Scandinavian countries (Denmark, Sweden, Finland 72 ), there is no national minimum wage. In Sweden, for example, wages are negotiated between employees and companies, giving rise to “collective agreements” in which trade unions play a crucial role. These collective agreements provide a framework for dialogue that generally enables wage negotiations to take place over a given period. However, companies are under no obligation to enter into such exchanges with unions, particularly when the terms negotiated in a collective agreement expire. In 2023, for example, a number of companies refused to re-enter the wage negotiation phase when their collective agreements were due to expire, leading to strikes of a rare scale in Sweden. 73
Minimum wage and living wage
The minimum wage is determined – where it exists – by national legislation. However, this wage does not always guarantee that workers can provide for themselves and their families. The International Labour Organization (ILO) now recognizes the concept of a ” living wage”, defined as the wage that enables a worker to meet his or her own needs and those of his or her family (food, water, housing, education, health, transport and precautionary savings, etc.). 74 ).
Determining a living wage by region/country is a tricky business. THE NGO Fair Wage Network has developed a database on living wages. Based on the work of this NGO, the French group Michelin has, for example, committed itself to guaranteeing a decent wage (including bonuses) for all its employees (in France and internationally) by 2024. 75
At the other end of the social scale, in order to reduce inequalities, it is possible to introduce a “maximum salary” – as is the case, for example, in French public-sector companies. Note that it is preferable in this case to speak of “maximum remuneration” to include not only the fixed part of the salary, but also the variable part and profit-sharing (stock options, etc.), or even benefits in kind, which are important for the management and top management of companies. Combining minimum salary and maximum remuneration would thus be tantamount to establishing a maximum remuneration differential within a company. 76 As mentioned inEssentiel 8, this proposal has been put forward by certain economists – following the significant increase in the ratio between executive salaries and the minimum wage since the 1980s.
Correcting inequalities downstream: taxes and social benefits
One of the most visible mechanisms of redistribution is that which passes through the following two channels:
- On the one hand, compulsory deductions (taxes and social security contributions) – and their more or less progressive nature;
- on the other hand, redistribution in the form of social benefits – the latter giving citizens the assurance that they will be able to cope with life’s various risks (having a pension, having replacement income in the event of illness, maternity, loss of work, etc.).
In this section, we focus on the French case.
More or less progressive compulsory levies
The different types of compulsory levies 77 have more or less redistributive effects, depending on the type of tax base and levy method.
In France, all individuals pay VAT, which is applied to all consumer goods. It is said to be “regressive” insofar as the poorest people pay a higher proportion of their income (see Essentiel 8). On the other hand, not everyone pays income tax. In principle, income tax is progressive: the higher a household’s income, the higher the tax rate (up to a certain threshold), and the more modest households are exempt.
The various levies (taxes and contributions) contribute to different degrees to the financing of the State.
[In France] 44% of households pay income tax. […] People emphasize income tax, but in fact it brings in less than the CSG (Contribution Sociale Généralisée), and much less than VAT. […] We all pay the CSG, we all pay the VAT, so we all make a very substantial contribution to public finances.
Redistribution through social benefits and public services
Part of the compulsory deductions (in particular social security contributions, but also certain taxes such as the CSG) is then redistributed directly to citizens. This is done in particular through the payment of social benefits, which include family allowances, housing subsidies and so on.
The aim of these benefits is to pool risks and promote solidarity between different categories of population: from working people to retired people, from healthy people to sick people, from those who have a job to those who don’t, from people without young children to families, and so on.
In France, in 2017, these various social benefits enabled an 8-point reduction in the poverty rate (14.1% of the metropolitan population living below the poverty line, compared with 22.1% before redistribution). 78
The graphs below show the role of redistribution through tax and benefit payments in various European countries.
Reading: In France, the Gini coefficient 19 for household income is reduced by 0.093 points, or 24.8%, by redistribution excluding pensions. The closer a country is to the bottom-left corner, the greater its redistribution.
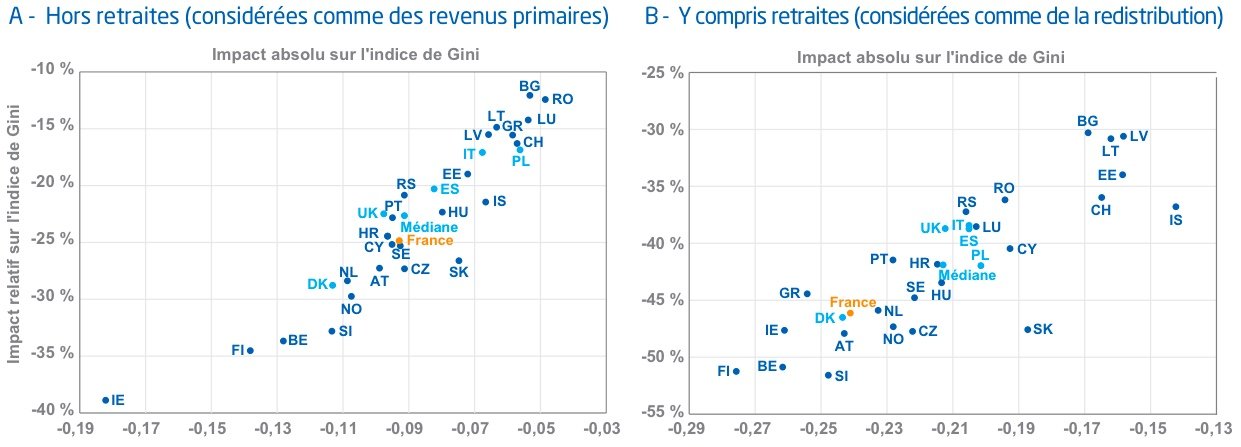
Source Inégalités primaires, redistribution: comment la France se situe en Europe, France Stratégie, 2020.
The Gini coefficient 19 is lowered by almost 23% thanks to Europe-wide redistribution mechanisms – France being characterized by a slightly higher impact of redistribution than its European neighbors (left graph).
It should be noted that there are major methodological issues at stake in these discussions and estimates: which compulsory deductions or social benefits should be taken into account? In other words, what perimeter should be considered when talking about redistribution? The impact of redistribution can vary according to the scope of the study. For example, in the chart on the right, pensions are included in social benefits, which means that the impact of redistribution on reducing inequality is much greater than in the chart on the left.
The evolution of redistribution – a historical perspective
Redistribution mechanisms were profoundly altered at the beginning of the 20th century with the introduction of progressive taxation: the higher a household’s income, the more it is taxed (in relative terms).
According to economist Thomas Piketty 81 this has had two significant consequences in Europe and the United States: on the one hand, a “static” impact, by reducing income inequalities at a given point in time; on the other, a “dynamic” impact on inequalities, by preventing too great a concentration of wealth – in association with the introduction of capital taxes.
For example, in France in the 1920s and 1930s, the top 1% of households earned around 20% of national income, compared with 7-8% in the early 1990s. Since the 1980s, the trend in developed countries has been towards lower taxation of very high incomes, and lower taxation of capital (see Essentiel 5).
Worldwide 82 Western Europe remains the most redistributive region, while Latin America and Africa are among the least redistributive.
Public services: another facet of redistribution
Another dimension of redistribution – which may seem less direct, but is no less essential – is found in public services. In fact, redistribution takes place not only at the level of individuals or households, but also through public services, financed by taxes, guaranteeing everyone, regardless of income, a supply of essential goods and services.
Insee refers to “extended redistribution” when it includes public services in the notion of redistribution. 83 – which leads to much higher redistributed sums. In an analysis published in 2023, Insee shows that more than one French person in two is a net beneficiary of extended redistribution.
[I]n 2019, [in France,] 57% of people receive more than they pay in. This share of people net beneficiaries of extended redistribution rises to 49% around the median standard of living, compared with over 85% among the lowest 30% and 13% among the wealthiest 5%. Before transfers, well-off households have an income 18 times higher than that of poor households, compared with 1 to 3 times higher after transfers.
Taking into account public services – notably health and education spending – redistribution divides the scale of inequality in France by 6. 84 Unsurprisingly, the most modest are the main beneficiaries, but it should be noted that some of the wealthiest are also net recipients (notably because of healthcare spending).
Extended redistribution also favors single-parent families, couples with three children and women, but is rather neutral for white-collar and blue-collar workers.
The breakdown of France’s Gini coefficient below highlights the net effect of wider redistribution. As mentioned in Essentiel 5, taxes on consumption and social contributions (VAT, CSG, etc.) tend to amplify inequalities. This is not entirely offset by the progressivity of income and wealth taxes. However, when social benefits (monetary transfers) and public services are taken into account, redistribution enables a significant reduction in the Gini coefficient, over 50% of which is explained by transfers in kind, which include spending on health and education, as well as pensions.
Reading: Social contributions have a slightly unequal effect in France in 2019 – by increasing the Gini coefficient 19 by 0.014 points.
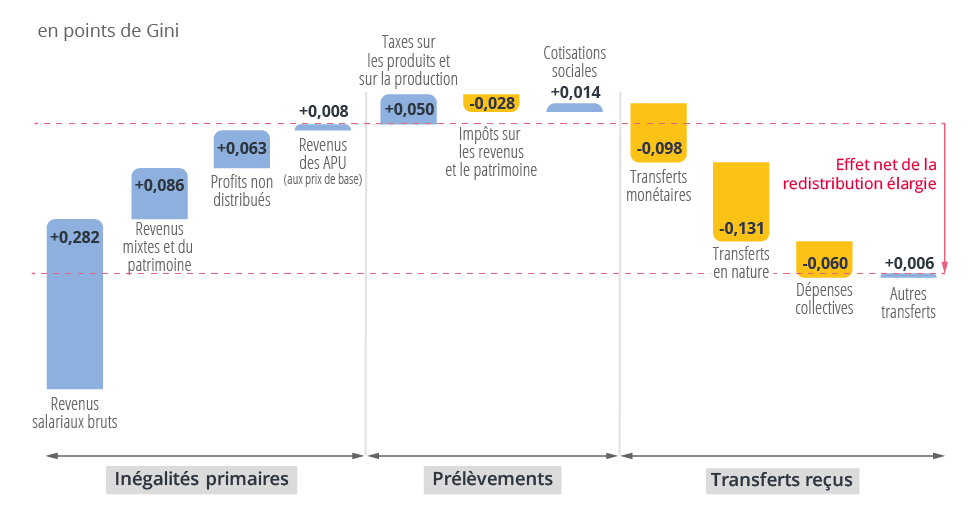
Source Insee, La redistribution élargie, incluant l’ensemble des transferts monétaires et les services publics, améliore le niveau de vie de 57 % des personnes, Mathias André, Jean-Marc Germain, Michaël Sicsic, 2023
Efficiency and acceptability of redistribution tools
The different means of redistribution we have just seen are not equal in terms of their impact on inequality. What’s more, some may be more difficult to implement than others.
For example, in a note from 2023 86 the Conseil des prélèvements obligatoires (CPO) underlines the effectiveness of targeted cash transfers compared to a reduction in VAT to support the poorest households.
It is, however, important to analyze VAT over its entire lifecycle, even if its “regressive” nature makes it difficult to assess its impact. 87 is not in doubt. The CPO note stresses the importance of analyzing the socio-fiscal system in its entirety: VAT is, in fact, a major source of revenue for the State, enabling it to set up targeted monetary transfers to the most modest households and, above all, transfers in kind (education, health) which, in absolute terms, benefit low-income households more. 88
Starting with the situation in 2023, a simulation is carried out to compare the effectiveness of different support measures, in particular comparing the VAT cut with targeted cash transfers. The CPO draws the following conclusions:
The progressive nature of the French social and fiscal system is based on social benefits and cash transfers rather than taxation. VAT also contributes to the progressiveness of the social and fiscal system by financing social transfers and national and local public services. […] A reduction in VAT is not effective in supporting the purchasing power of the most modest and middle-class households, since it benefits the wealthiest households to a greater extent, and a large part of this reduction is captured by companies.
Redistribution via public services, and access to healthcare for example, is a silent form of redistribution. On the other hand, targeted and direct cash transfers, however effective, can give rise to “stigmatization” processes, or fuel talk of “handouts”(see Essentiel 7 on the perception of inequalities). These processes have very real repercussions and must be taken into account: they explain, in particular, the high level of non-use of social benefits in France, as highlighted by the Direction de la recherche, des études, de l’évaluation et des statistiques (Drees) in 2022. 89
For redistribution to be effective, on the one hand, we need to be able to levy fairly (i.e., generally through progressive taxation, which is not always the case in practice), and on the other hand, we need to be able to ensure that the tax we pay is fair. 90 ). On the other hand, we need to target those households most in need. This may be those with the lowest incomes, but not necessarily, for example in cases where the state wishes to target disadvantaged single-parent families.
In addition, the design of a socio-tax system is, in itself, complex, and the superimposition of schemes (social benefits, exemptions, etc.) can undermine the progressiveness of the socio-tax system, notably through threshold effects. 91
The issue of threshold effects thus raises the question of the precise targeting of each redistribution policy. In France, for example, during the health crisis of 2020 and the period of high inflation in 2022 and 2023, the lowest 10-20% of income earners were protected by direct transfers and the indexation of the SMIC (minimum wage) to inflation. However, this has not been the case for households slightly below the median income, who, according to an OFCE study covering the period 2021-2023, had the lowest income growth over these two years, fuelling a feeling of “social downgrading” on the part of the middle classes. 92
Find out more
- Primary inequalities, redistribution: where France stands in Europe, France Stratégie, 2020
- François Bourguignon, Sharing the Wealth, IMF, 2018
- Thomas Piketty, A Brief History of Equality, Ed. Seuil, 2021
- Marion Cohen, Alain Grandjean, La France championne des dépenses publiques : comment fausser un débat, Chroniques de l’anthropocène, 2019
A distorted perception of inequality
In order to develop political solutions to growing inequalities, and to find public support for these solutions, it is first necessary to establish a common understanding of the phenomenon. As it turns out, inequalities are difficult to perceive and analyze, for a number of technical and psychological reasons
Economic inequalities are complex to apprehend: distinction between wealth and income
A first factor that complicates the perception of inequalities is their multidimensional nature. In Essentiel 1, we explained that inequalities are not limited to monetary aspects: inequalities in access to education and discrimination profoundly affect the lives and trajectories of individuals, even when placed in comparable economic conditions.
Moreover, wealth inequalities themselves need to be read on several levels. A notable example is the distinction to be made between income and wealth inequalities 93 because the mechanisms governing these two forms of wealth are quite different:
- Income from work (wages or self-employed remuneration) is a socially regulated flow (whether regulated by a minimum wage or through hiring standards such as company pay scales), relatively homogeneous within a given profession, and non-heritable.
- Wealth, on the other hand, is a stock (the totality of an individual’s physical and financial possessions): it is highly dependent on the family context, and in particular on inheritance – see Misconception no. 6.
As we explain in Essentiel 5, it is also based on a dynamic of accumulation, with the result that, throughout the world, wealth is far more concentrated than income.
In France, for example, in the early 2020s, the top 10% of income earners will receive 24% of national income before redistribution, while the top 10% of wealthy individuals will own 47% of the country’s assets. 94 On a global scale, the top 10% of earners receive 50% of income; those with wealth in excess of $100,000 hold 82% of wealth. 95 In both cases, the bottom 50% of the population own virtually nothing: 8% of wealth in France and 2% worldwide.
This distinction is not insignificant: it’s not just about the extra income inequality generated by wealth income.
Indeed, inequalities linked to wealth itself can have very specific effects on individuals’ career paths. Entering adulthood with capital provided by one’s parents means being able to pursue higher education without having to work to finance it, which has a major impact on success (probably several dozen percentage points in exam passes). 96 early access to home ownership 97 and avoid the cost of rent and the anxiety associated with financing a home; it means having a safety net that allows you to take time to discover yourself, choose a career that matches your aspirations, and take risks.
Young people from disadvantaged backgrounds make more conservative career choices than their wealthier counterparts. 98 At the other end of the spectrum, the rate of business start-ups rises sharply with the level of capital. 99 (doubling from one end of the wealth distribution to the other).
In short, to properly understand the effect of monetary inequalities on individuals, it’s not enough to compare their pay slips: we need to take into account their social environment, as well as the consequences (practical, psychological, etc.) they have on their lives.
Inequalities are distorted by our cognitive biases
Beyond the difficulty of interpreting figures, we need to look at how people perceive inequality in qualitative terms. A number of studies have shown that individuals misjudge the actual distribution of wealth. They highlight the psychological biases that explain this error, and the difficulty of correcting it.
According to a DREES study published in 2022, the French misjudge their position on the income scale: most consider themselves to be average, even when they occupy an extreme position. The effect is spectacular for high-income earners: 14% of the panel surveyed belonged to the wealthiest third of the population, but only 2% were aware of it. And none of them thought they were in the top 10%.
Reading: 13% of the sample is in the 5th decile 38 of the income distribution and 27% of the sample think they are in this fifth decile. This reflects the fact that people believe themselves to be more “average” than they actually are.
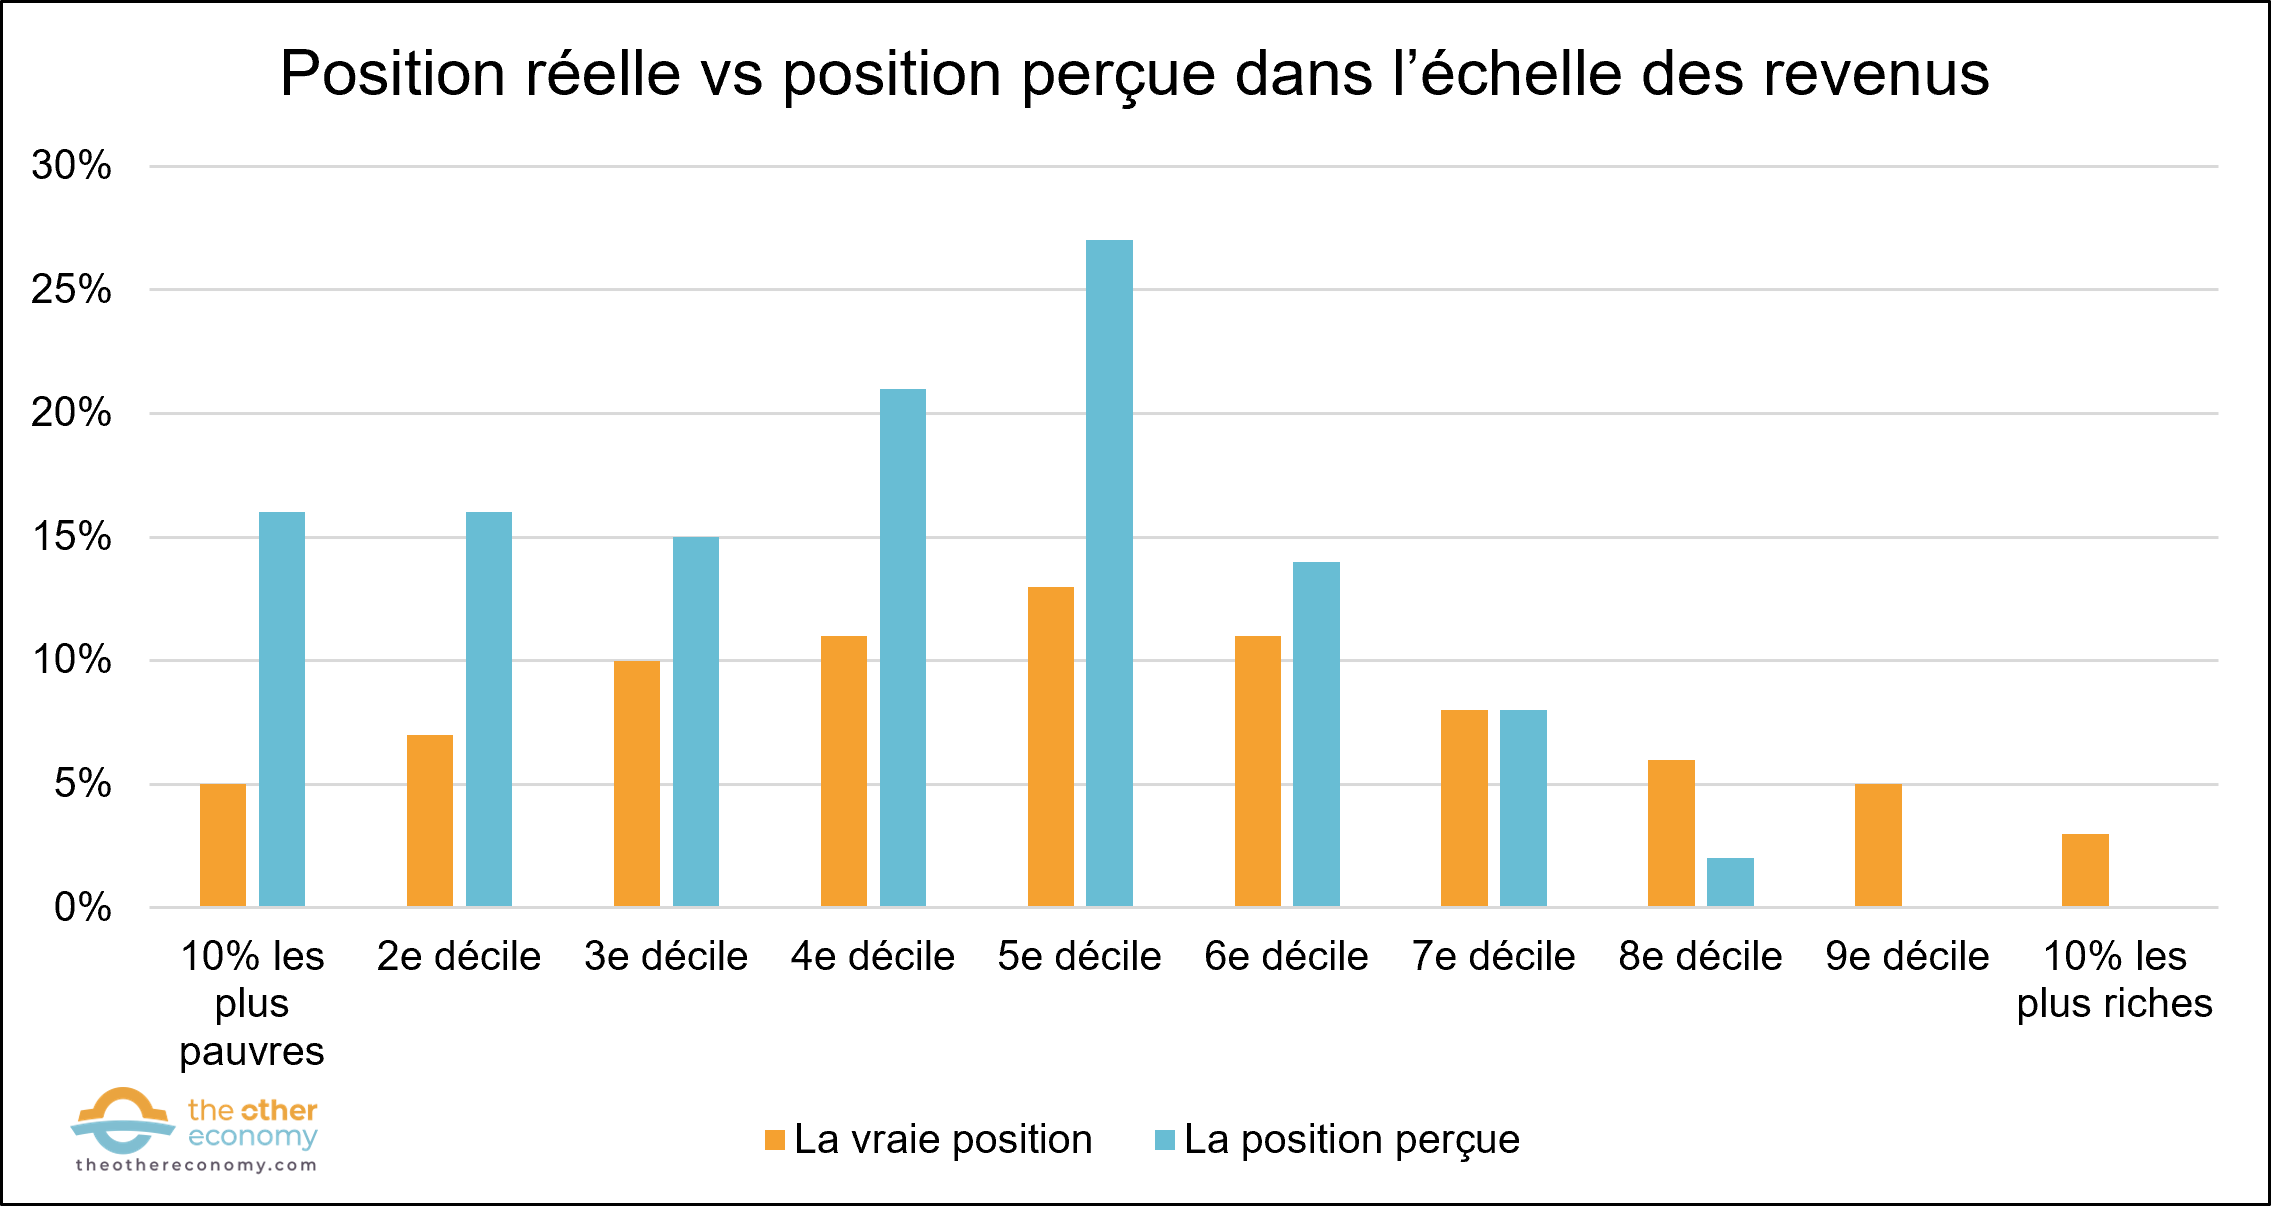
Source DREES, L’opinion des Français sur les inégalités reflète-t-elle leur position sur l’échelle des revenus, Études et Résultats, 2022
A 2013 study 101 proposes an explanation for this phenomenon: respondents would evaluate their wealth primarily in relation to their immediate environment, particularly their geographical environment. This is a typical example of the cognitive bias of representativeness: individuals consider by default that their observations (in this case, their socio-economic environment) are representative of the overall population. The lack of social mix thus has the effect of masking the extent of inequalities for all categories of the population, rich and poor alike.
Another psychological bias could have serious consequences for our understanding of inequality: the distorted perception of large numbers.
Some political activists have tried to translate the great fortunes on scales that we have mastered, in order to shock our perception. For example, comedian Pierre-Emmanuel Barré has calculated 102 that if the oldest known hominid, the 3.2 million-year-old australopithecus Lucy, had earned today’s minimum wage and spent nothing from her time to the present day, she wouldn’t be half as wealthy as Bernard Arnault today! In the same way, various websites and pages offer graphical representations of great fortunes, comparing them with more familiar sums of money. 103
The surprise generated by these conversions is significant: it indicates that we fail to give concrete meaning to amounts of millions or billions of euros. Here again, cognitive science research offers an explanation for this phenomenon: our sense of numbers is mainly relative 104 and we put roughly the same psychological distance between, on the one hand, 1,000 euros and a million euros, and, on the other, a million and a billion euros.
When it comes to the economy and inequality, our intuition is often a poor guide, as the quantities involved literally defy our imagination and everyday perceptions.
Perception of redistribution
The issue of inequality is inextricably linked to that of redistribution. In addition to being a risk-sharing mechanism, as discussed in Essentiel 6, redistribution has an economic justification: the economic “game” contains amplifying and cumulative mechanisms. 105 which cause individuals’ fortunes to diverge, all other things being equal. This is intuitively expressed by the popular expressions “Money works for you”, “You only lend to the rich” and so on. Redistribution partially offsets these effects.
Even so, various redistribution schemes (progressive taxation, minimum social benefits, etc.) have historically been contested by large sections of the population, and their application or amounts are regularly the subject of debate. There are two types of cause for this rejection: some have to do with values, others with perception.
Let’s take a look at the main value-based criticisms:
- Redistribution would hinder and discourage free enterprise: why should the community appropriate the wealth generated by an individual’s efforts and ingenuity?
- Redistribution (often referred to as “handouts”) would run counter to individual responsibility: everyone would have to earn their living through their own work, and climb the social ladder if they wanted to increase their income.
- The arguments of “social Darwinism 106 which have been politically influential in the past and are still influential in some countries, such as the United States, argue that it is legitimate for the “gifted” to drain wealth and use it to develop society in their own image, even if it means leaving the “incompetent” in misery.
These judgments are based on widely debatable assumptions, which we examine in Misconceptions 6 (on meritocracy) and 8 (on equal opportunities).
They can also be opposed by value-based arguments: as noted above, wealth tends to be self-sustaining, which can be seen as unfair, since it is independent of any notion of merit or effort. As we can see, there is a conflict between contradictory values, which can only be resolved through political debate(see Essentiel 8).
Other criticisms are based on a misperception of the amounts collected and distributed to the various players. For example, the French tax system, a heterogeneous historical construction, is difficult to understand. Citizens are unaware of their own total rate of compulsory deductions (direct taxes, indirect taxes such as VAT and social security contributions) – and a fortiori of the rates paid by others.
For example, the fact that the top 1% of income earners are proportionally less taxed than the rest of the population is little known to the general public(see Essentiel 5).
The total amount of redistribution is also subject to misinterpretation, not least because of the rhetorical trick of publishing absolute rather than relative figures: social minima, for example, are more readily presented in euros (30 billion in 2023 107 ) rather than as a proportion of public spending (2.1%).
Inheritance tax: a heated debate based on poor estimates
Misperceptions about the numbers involved are also affecting the public debate on inheritance. A 2022 survey 108 and a 2018 CREDOC study 109 attest to both a rejection of inheritance tax and a great ignorance of the system. Respondents fail to answer binary questions such as the existence of inheritance tax for married or civil union spouses, underestimate the value of high assets, and greatly overestimate the amount of tax paid in the direct line, i.e. from parents or grandparents to children (estimated at 22% on average, when the actual average value is less than 5%).
This latter bias could be due to the existence of substantial fees for indirect line inheritances (60%): all it takes is one such example of an “over-taxed” inheritance in an individual’s entourage to provoke a strong emotion and make him reject the whole system, even without knowing about it.
Finally, values also play an important role in perceptions: over 80% of French people prefer the proposition “Inheritance tax should be reduced, because parents should be allowed to pass on as much wealth as possible to their children “s to the following: “Inheritance tax should be increased, because inheritance sustains social inequality”. Family – and work – values are thus deemed more important than the justice of the social system.
Social security fraud is another example of the poor estimation of figures, which skews people’s opinions and is readily exploited in political discourse. The French overestimate it, focusing on examples drawn from their own experience or from the media, whereas the proportion of fraudsters observed during checks by social organizations is very low – 1% for the Family branch of the CAF in 2022. 110 3% for the RSA in 2009.note110
This can be seen as an availability bias: people prefer and overestimate facts that are salient in their memory, particularly when they are stereotyped. It is therefore instructive to compare the amounts of this so-called “social” fraud (fraud on social benefits) with those of tax fraud: several estimates from various institutions conclude that the latter costs public finances 10 times more than the former (around 100 billion versus 10 billion in 2019).
Annual detected and estimated amounts of tax and social security fraud in France (in billions of euros)
Reading: in 2019, in France, detected tax fraud amounted to 13.7 billion euros, while social security contribution fraud was estimated at 0.7 billion euros. The total amounts of these frauds are estimated, respectively, at 80-100 billion euros for tax fraud and 6.8-8.4 billion euros for social security fraud (a ratio of 10).
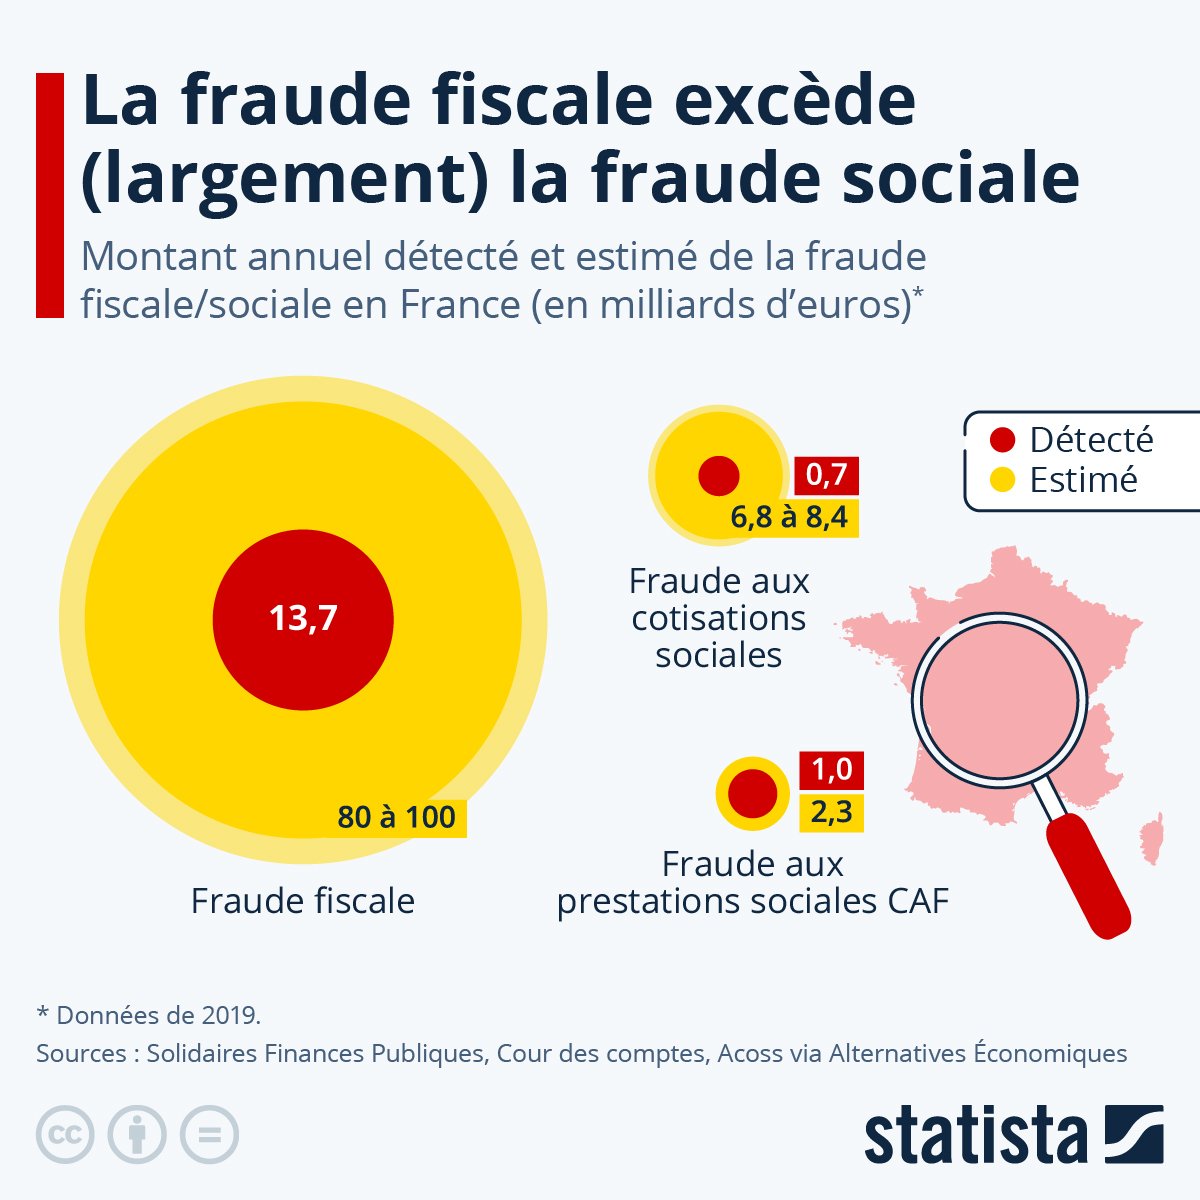
Source How much tax and social security fraud is actually detected, Statista, 2024
Find out more
- The reference work on cognitive biases : Daniel Kahneman, System 1 / System 2: The two speeds of thought, Flammarion, 2011
- Pascal Ory, Nouvelle histoire des idées politiques, Fayard, 1987
- On the “psychological” effects of inequalities, and their impact on individual trajectories: Ana Perrin-Heredia, “De si petites différences. Conduites économiques et segmentation sociale”, in Où va la France populaire?, Nicolas Duvoux and Cécile Lomba (dir.), PUF, 2019
Not all inequalities are unfair
Equality and equity are two fundamental concepts in the quest for social justice. The drawing below illustrates the difference between the two.
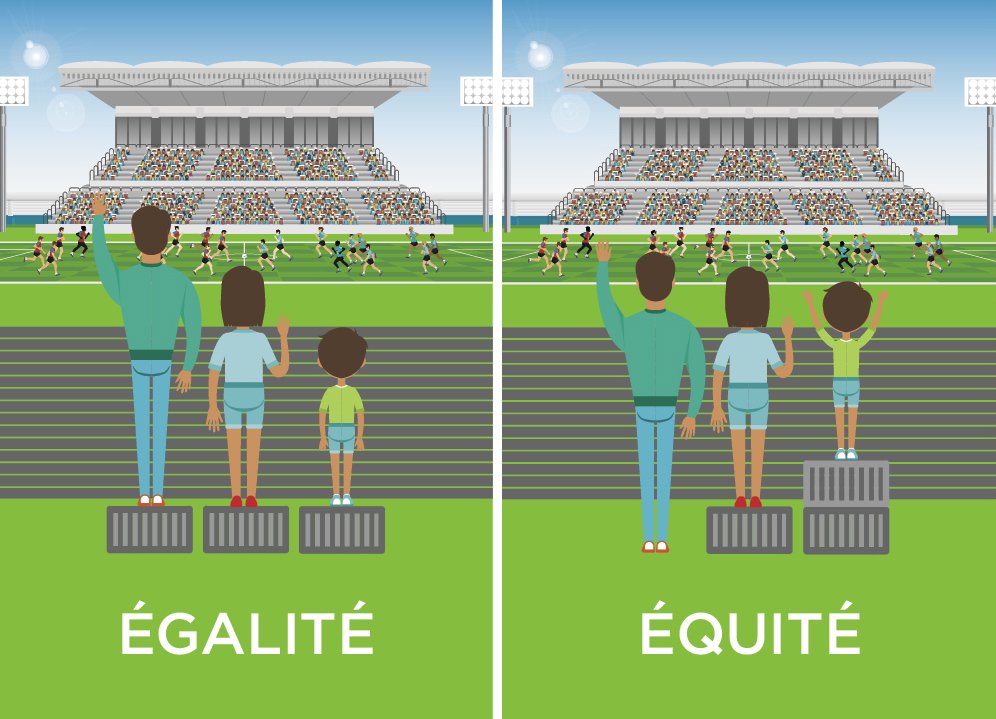
Source Image adapted from aUQAM drawing, inspired by the original illustration by Craig Froehle, University of Cincinnati.
The difference between equality and fairness
Put simply, equality means giving the same thing (rights, resources, etc.) to everyone: it takes on an almost mathematical meaning. Fairness seeks to give to everyone according to their needs, thus aiming to compensate for “natural” inequalities (disability, for example) and systemic inequalities (racism, sexism, etc.).
Let’s take the example of two taxes in France:
- VAT (Value Added Tax) is a tax that applies to all consumable goods and many services. For a given product, a fixed rate is applied to the price of the good, and is payable by the buyer. This tax on purchases is “egalitarian”: everyone pays the same amount of VAT for a given good, whatever their income. But it is arguably an unfair or unjust tax (known as a “regressive” tax), since it weighs more – in relative terms – on the budgets of lower-income households. 111
- Conversely, income tax is said to be progressive: the higher the income, the higher the tax rate. It is therefore designed to be fairer, since everyone contributes according to their means. 112 For example, in France in 2023, income tax has 5 brackets: 0%, 11%, 30%, 41% and 45%. The principle is not to tax the first few euros of income, to tax subsequent incomes at a “low” rate (11% in this case), and then to gradually increase the rate at which additional income is taxed. As a result, the average tax rate – i.e. the ratio between taxes paid and income received – increases as income rises. 113
Marginal income tax brackets vs. average tax rate
Reading: For a single person in France in 2023 – and whatever their income – the “first” incomes between €0 and €11,294 are not taxed (0%), those between €11,295 and €28,797 are taxed at 11%, those between €28,798 and €82,341 are taxed at 30%, and so on. What’s more, in France in 2023, a single person with a net taxable income (after allowances) of €28,800 will pay 6.7% tax (this is their average tax rate).
Example: If we take the case of a single person with a taxable income of €32,000 in 2023, the tax calculation is as follows: the first bracket (€0 – €11,294) is not taxed. The second bracket (€11,295 – €28,797) is taxed at 11%, or €1,925. The third bracket (€28,798 – €32,000 in this case) is taxed at 30%, or €961. For a total income tax of €2,886, and an average tax rate of 9%. The same calculation applies regardless of total income.
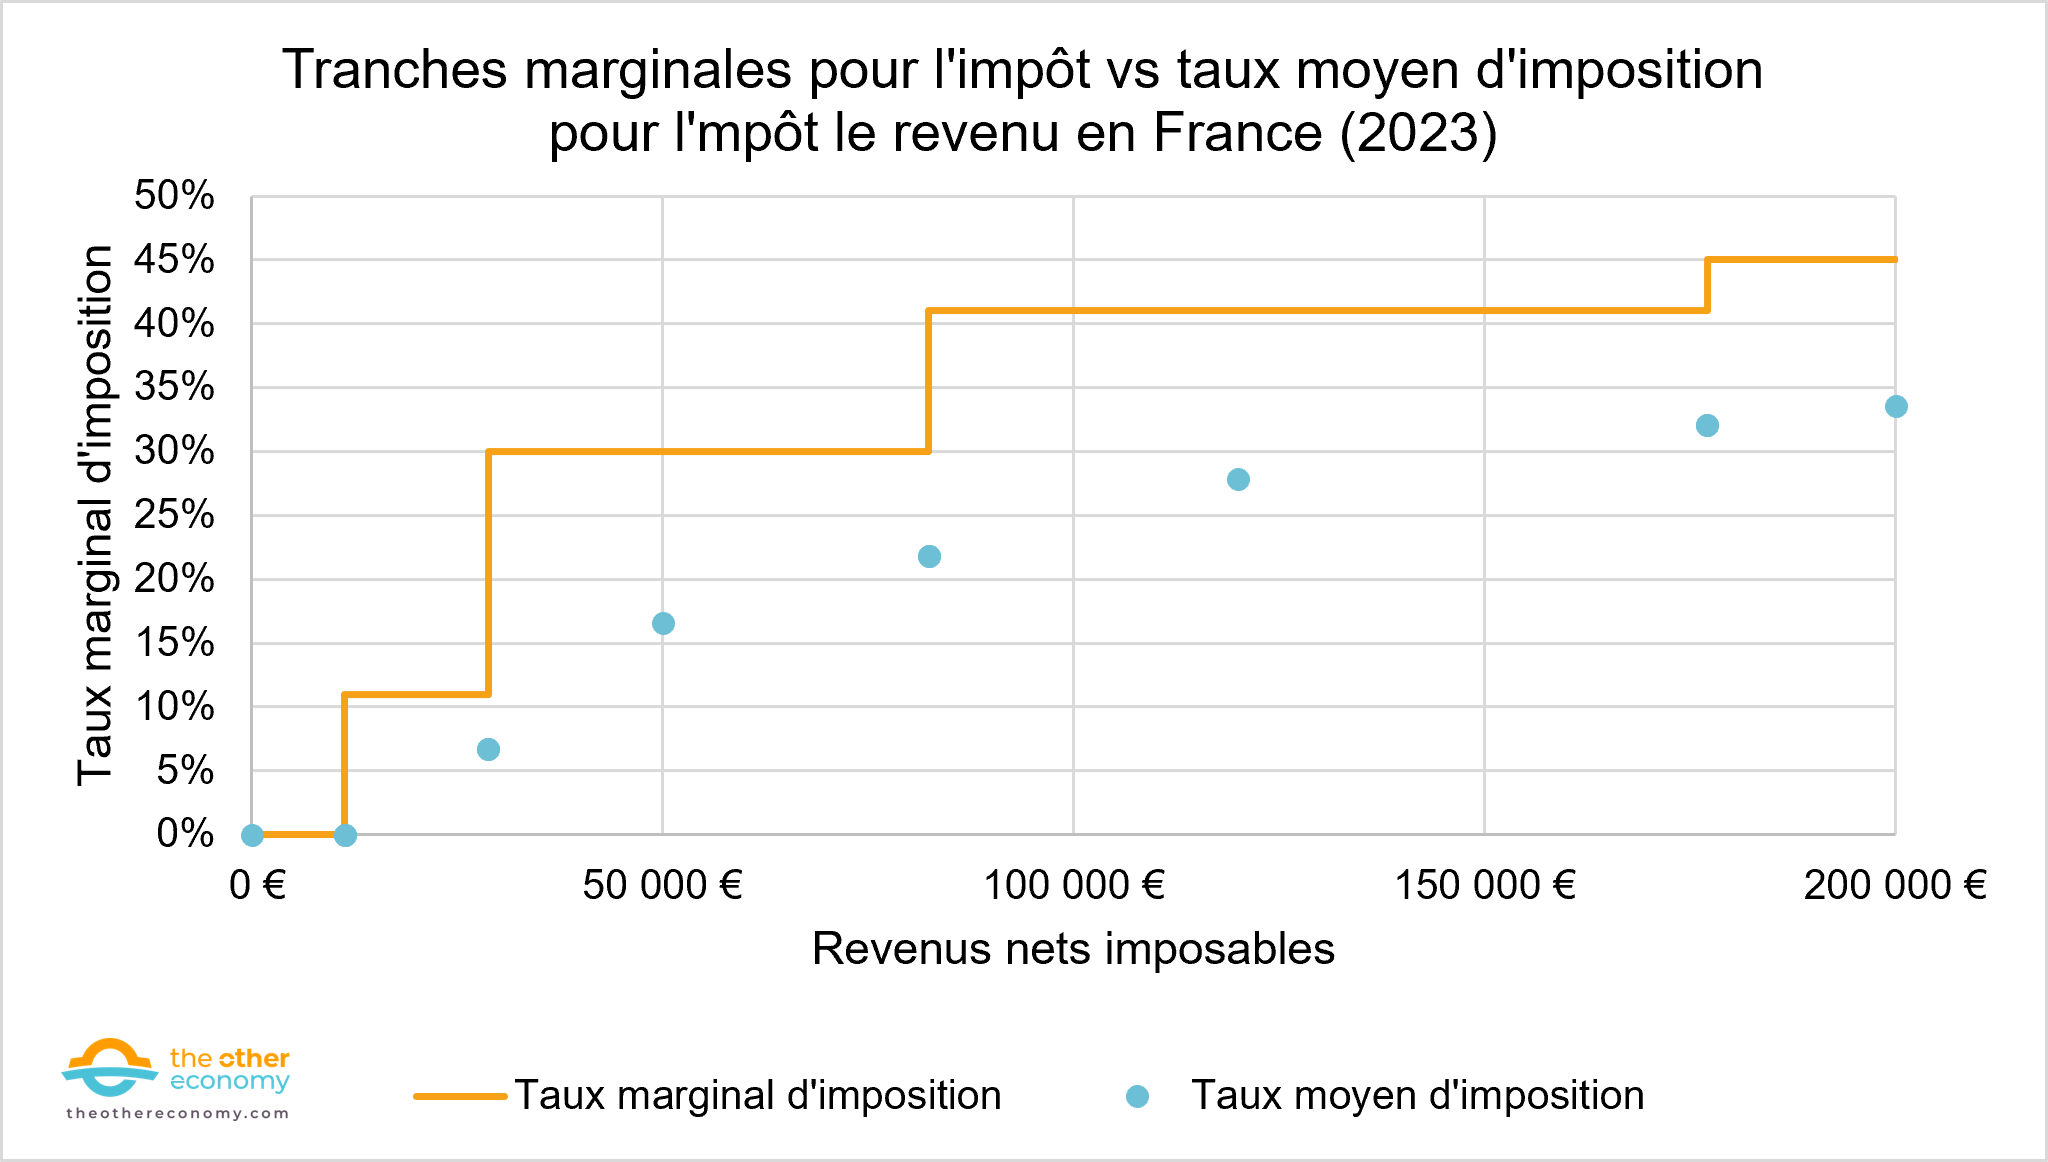
Source Comment calculer votre impôt d’après le barème de l’impôt sur le revenu, Bercy Infos, economie.gouv.fr. Link consulted on 24/02/2024.
In seeking what is “fair”, equity can therefore create technically “unequal” situations (in our example, different tax rates).
Some of the processes that give rise to inequality can be considered fair, while others are manifestly unfair and rightly arouse discontent or anger.
Numerous theoretical approaches to equity
The question of equity is particularly complex, and different approaches have been taken by philosophers, political scientists and economists. This deliberately non-exhaustive sub-section focuses on the work of three twentieth-century thinkers on equity: John Rawls, Michael Walzer and John Roemer.
John Rawls’ veil of ignorance
The American philosopher John Rawls made a significant contribution to the debate on “just inequalities” with his work Theory of Justice (1971). In it, he asserts that there are just inequalities, and that any desire to equalize (reduce inequalities) is neither just nor desirable. 114
John Rawls theorized the concept of the “veilof ignorance” as a means of building a more just society. This thought experiment consists in individuals conceiving the principles of justice in a society without any knowledge of their own social or economic position. By placing themselves behind this veil of ignorance – and thus in an “original position” – people are encouraged to develop principles of justice that do not favor any specific group. According to Rawls, they would then make the choice that produces the highest return for the least advantaged.
Walzer’s Spheres of Justice
The pioneering thought experiment proposed by Rawls has nevertheless been challenged by various thinkers, including the American philosopher Michael Walzer. Whereas for Rawls, the principles of justice should be elaborated by ignoring the identities and singularities of societies, Walzer promotes a plural and more concrete vision of justice – i.e., one that is not based on an abstract, universalist experience. 115 He thus speaks of “complex equality”.
In his main work, Spheres of Justice. A defense of pluralism and equality (1983), Walzer focuses on the different forms of inequality and the context in which they occur. In his view, the cultural meaning of goods must determine their just distribution. In other words, there is no single answer to all inequalities, and inequalities in wealth, access to education and so on must be treated differently.
To symbolize this, he introduces different “spheres of justice” into his theory (political power, wealth, work and education). In a given society, from one sphere to another, the “just” distribution would not be the same. For example, if political power is to be equally distributed, inequalities in wealth can persist without necessarily posing a problem of social justice. Walzer adds that domination within one sphere should not mechanically entail domination in another. For example, wealth should not give more political power. In his view, the different spheres of justice must be independent.
Fairness and equal opportunities in Roemer’s view
Finally, it’s worth noting that work on the notion of equity has also fed into reflections on the notion of equal opportunity(see Idea 8 for more details on equal opportunity). For example, the economist and political scientist John Roemer has argued that equity requires a “politics of equal opportunity”.
In his book Equal Opportunity (1998), he argues that inequalities should only be the result of differences linked to personal choices (such as the effort 116 ), and not to aspects uncontrollable by individuals (parents’ level of education, gender, etc.).
For Roemer, the market is an efficient mechanism for allocating resources, but it can also generate inequalities that are not necessarily fair. His approach seeks to reconcile market pricing with greater state intervention – with the state owning more of the means of production – in order to prevent excessive concentration of capital.
Finally, Roemer argues that, to achieve this goal, public policy must be able to intervene and target factors beyond the control of individuals to reduce their influence on individual economic outcomes, thereby ensuring greater equity.117
These three thinkers have undoubtedly contributed to the reflection on the notion of equity, by underlining its complexity. Many other philosophers and economists have also contributed to this reflection (see, for example, Amartya Sen’s capability approach presented in Essentiel 1). These approaches remain, however, theoretical and invite us to question, in practice, what fair inequalities are.
Find out more
- Chad Kleist, Global Ethics: Capabilities Approach, Internet Encyclopedia of Philosophy
- Joseph Stiglitz, The Price of Inequality, Les liens qui libèrent, 2012.
- Michael Sandel, Toppling the myth of meritocracy, The Harvard Gazette, 2020.
- Gaël Giraud, Why Economics Is a Moral Science: Lifting the Veil of Ignorance in the Right Direction, Law, Economics, and Conflict, 2021.
In practice, how can “fair” or acceptable inequalities be defined?
This theoretical reflection on equity, important for building a “just” society, raises many questions in practice. Here, we focus on the subject of remuneration.
Firstly, it should be noted that perfect equality is not desirable: it does not seem “fair”, for example, to want to pay the same wage to a low-skilled employee and a surgeon, who, on the one hand, have not had the same education 118 and do not have the same level of day-to-day responsibility.
In the Petit bréviaire des idées reçues en économie (La Découverte, 2003), Ioana Marinescu and Gilles Raveaud take another, fictitious example: that of two handlers, Laurel and Hardy, the latter being twice as physically strong as Laurel. If they are paid by results (the number of crates moved, for example), then Hardy could be paid twice as much as Laurel for the same physical effort. But if they are paid by the hour, both will receive the same salary for a different value created (for their company). This example illustrates just how complex the issue of putting fair pay into practice really is.
What difference in remuneration is “fair” or at least “acceptable”?
While there’s no “right” answer to this question, one way of thinking about it is to look at the remuneration ratios between CEOs and employees.
The curve below shows the evolution of the ratio of earnings between CEOs and employees for the 350 largest US companies since 1965. Despite some fluctuations, it is clear that this ratio is around 10 times greater today than it was in the 1970s.
Evolution of the CEO/employee earnings ratio for the 350 largest US companies (1965 – 2022)
Reading: CEO compensation includes salary, bonus and stock options. The value of shares and stock options is calculated at the time of granting. If we consider the evolution of the value of these shares(a posteriori), the ratio is then higher than the curve above. Employee compensation is the average annual compensation (wages and benefits) for a full-time employee in a production job (non-supervisory) in the industries in which the 350 companies considered operate.
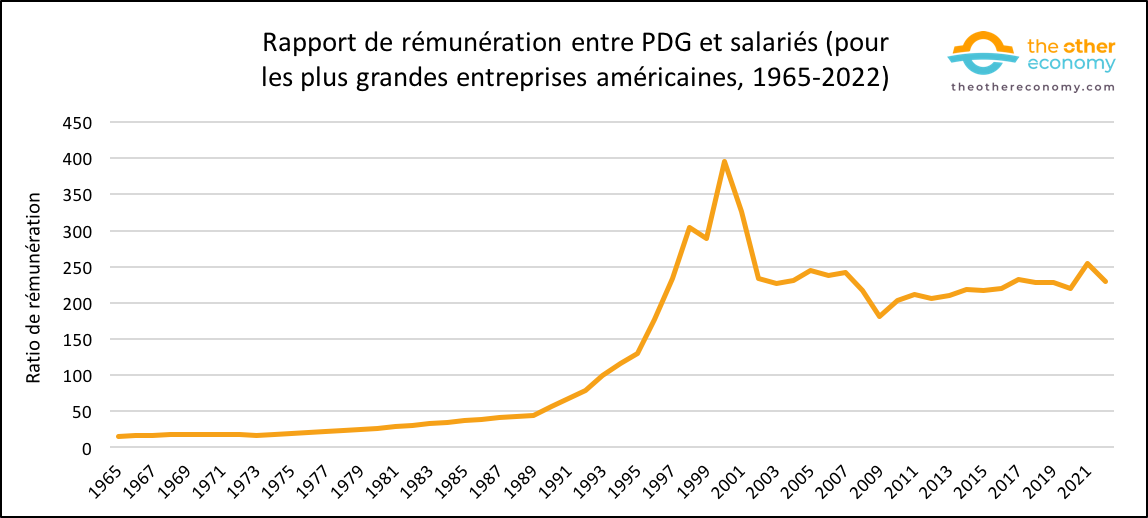
Source CEO pay in 2022, Economic Policy Institute.
A study published in 2014 119 based on responses from over 55,000 people in 40 countries, estimated that a CEO should earn no more than 7 times what the lowest-paid employee in his or her company earns. 120
In 2020, a report by the United Nations Research Institute for Social Development 121 suggests that “from the perspective of redistributive justice, associated with sustainable development and far-reaching changes, a ratio of the order of 10-30 to 1 could be considered fair.”
In France, Gaël Giraud and Cécile Renouard recommended in 2012 that this ratio be capped at 12 122 based on surveys asking French people what the maximum salary should be in France, and using existing civil service pay scales. Note that this ratio of 12 is close to what was in place in large American companies in the 1970s, whereas today many companies have a ratio well in excess of 100.
Finally, in a report from 2023 123 Oxfam advocated limiting “as a first step, [the] pay gap of 1 to 20 between the executive’s salary and the company’s median salary”, noting in passing that the pay cap (450,000 euros) in state-owned companies, in which the State is the majority shareholder, has had a notable effect at EDF, where “in 2011, the gap was 23, but ten years later it had fallen to 5.35”.
Remuneration for work does not necessarily reflect its value to society
According to the economic theory most widely used in academic circles (theory stemming from the neoclassical school of thought 124 ), an activity’s contribution to society or the fairness of its remuneration are not a priori taken into account when determining the remuneration of different professions: it is the law of supply and demand – i.e., a market mechanism – that determines wages.
High salaries would therefore correspond to the skills most in demand and least available on the market, reflecting higher “marginal productivity”. In other words, wages should reflect (directly) the added value (from an economic point of view) of the employee. However, this theory is largely invalidated by the facts (see our modules on work and the company) – as demonstrated, for example, by the differences between men’s and women’s wages for the same activity.
The COVID-19 crisis has highlighted the extent to which remuneration does not correlate with the social value (i.e. the benefit to society) of the work performed. Indeed, the pandemic highlighted the essential nature of “front-line” workers: nurses, shop assistants, garbage collectors, and so on. These are often unrecognized, poorly paid jobs with uncomfortable working hours. 125 It has also highlighted the “invisible work” of domestic and family chores, most often performed by women. 126
Defining the “value” of work is therefore a complex issue. In practice today, many factors play a part in determining remuneration: level of education required, competition on the job market, location, tax policy (with exemptions from charges for certain salaries encouraging companies to offer certain levels of remuneration), etc. The “Shapley Value” is a way of thinking about how to integrate the social contribution of work into remuneration. The “Shapley Value” is a way of thinking about how to integrate the social contribution of labor into its remuneration.
The Shapley Value is a way of calculating a person’s contribution to the collective good: it measures the reduction in collective well-being (in the creation of economic value) caused by the absence of this person/skill. […]. According to Shapley’s value, the contribution of a care assistant in the event of a national epidemic, for example, is clearly greater than that of a financial trader. Even if the probability of a national pandemic is low (sic), the remuneration of a caregiver, in normal times, should therefore reflect her contribution to the collective good in the event of a catastrophe, weighted by the probability of occurrence of such a catastrophe.
Clearly, the wages we see today are not solely a function of the social utility (in Shapley’s sense) of those who earn them.
Extreme inequality is detrimental to ecology and a just transition
Various mechanisms help explain why the most unequal countries are the least likely to take action for the environment.
Extreme inequalities are not conducive to ambitious environmental governance
In societies characterized by marked inequalities, particularly in developing countries, the wealthiest individuals often wield considerable influence beyond the economic sphere.
They can exert significant power over political decisions and regulations. 127 When these large fortunes have built up their wealth by exploiting their country’s natural resources, they tend to oppose regulatory policies concerning the exploitation and treatment of natural resources – as these can be detrimental to their business activity. This aspect is not insignificant, given that, according to the 2024 report of the International Resource Panel, an initiative launched by UNEP in 2007 to improve the state of knowledge on the use of natural resources (biomass, fossil fuels, metals and non-metallic minerals), natural resource extraction and processing activities are associated with almost 90% of biodiversity loss and water stress worldwide. 128
Volume of materials extracted worldwide, 1970-2024, in millions of tonnes.
Reading: in 1970, 30.9 billion tonnes of materials were extracted worldwide.
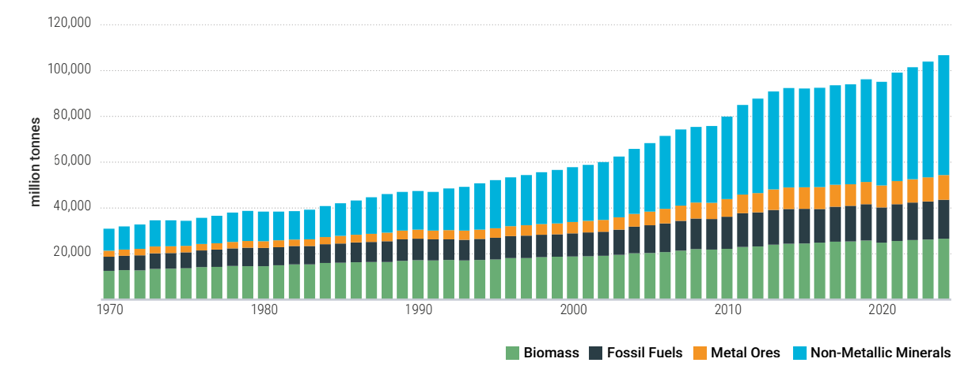
Source Global Resources Outlook 2024: Bend the Trend – Pathways to a liveable planet as resource use spikes, United Nations Environment Programme, pp. 26, 2024.
What’s more, the growth opportunities presented by the extraction of raw materials are rarely taken up by the population as a whole(see also Misconception 3). On the contrary, the time-honored expression “the curse of natural resources” has become a commonplace. 129 underlines the political and social challenges facing countries whose economies are based, in particular, on the extraction of natural resources.
The growth of the mining and oil sectors in several countries has […] accelerated their overall economic growth, but has widened inequalities […]. While the increase in mining wealth is good news, it needs to be managed carefully to reduce capital flight and avoid the “natural resource curse” of rising poverty and inequality.
Given these risks, the fight against corruption and the establishment of independent institutions can play a key role in the social stability and ecological commitment of certain developing countries.
A study carried out in 26 Chinese provinces between 1995 and 2017 demonstrated that the fight against corruption could have a twofold positive impact 130 . Not only does it reinforce a society’s social stability and equity, but it also proves to be a powerful tool for improving environmental governance.
In a 2017 report on income inequality in sub-Saharan Africa 131 the United Nations Development Programme recommends the establishment of strong, transparent institutions in resource-dependent developing countries to ensure that resource extraction is inclusive, does not encourage corruption, and does not lead to increased inequality.
The ecological transition must be fair and not amplify inequalities
The relationship between inequality and ecology can also be explained by the challenges involved in adopting ambitious environmental policies. While essential, such policies can often disproportionately affect the poorest in society, when they fail to take social impacts into account.
For example, environmental policies aimed at putting a price on pollution can have a significant impact on the standard of living of the poorest (especially when they concern pollution linked to fossil fuels) – and even on the middle classes – while the wealthiest remain in a position to pay additional taxes. Ultimately, this means that these policies do not encourage the poorest and the richest to be sober in equal measure.
The transition is spontaneously unequal. Even for the middle classes, renovating their homes and changing their heating system, on the one hand, and acquiring an electric vehicle instead of a combustion one, on the other, require an investment of the order of a year’s income. […] The economic cost of the transition will only be accepted politically and socially if it is fairly distributed. […] The transition will require everyone to make substantial efforts to adapt their lifestyles, and it would be ethically unacceptable for the most affluent to exempt themselves by simply paying more for the same consumption.
Thus, in 2022, in the midst of an energy crisis exacerbated by the war in Ukraine, private jets, used by a minority of the ultra-rich, were the subject of heated debate in France, not least because of the environmental inequalities highlighted by this dossier. At a time when all citizens were being urged to save energy for economic and ecological reasons, a few very wealthy individuals were (and still are) arrogating to themselves the right to consume and emit greenhouse gases without limit when traveling by private jet.
This disparity has sparked debate about the need for a more equitable and inclusive approach to tackling greenhouse gas emissions – in fact, a Cluster 17 poll found that over three-quarters of French people in 2022 felt that “energy sobriety is imposed only on the people, but not on the elites”. 132
Find out more
- Jean Pisani-Ferry, Selma Mahfouz, Les incidences économiques de l’action pour le climat, France Stratégie, 2023
- Éloi Laurent, La social-écologie : une perspective théorique et empirique, Revue française des affaires sociales, 2015
- Global Resources Outlook 2024: Bend the Trend – Pathways to a liveable planet as resource use spikes, UNEP, 2024
- Le mal hollandais, Alternatives Economiques, (02/03/2022)
- Is inequality bad for the environment?”, The Guardian, 2017. Accessed on 24/02/2024.
Extreme inequality undermines social cohesion and well-being
Inequalities and social cohesion
The fact that extreme inequality undermines social cohesion is now widely accepted. Highly unequal countries 133 such as South Africa, Brazil, Chile, Mexico, Argentina, China and the United States (for which the Gini coefficient will be 19 was greater than 0.35 135 ), are more prone to major social fractures.
Brazil is thus often cited as a country where economic and social inequalities strongly affect the cohesion of society. Despite some progress since the 1980s, Brazilian society remains one of the most unequal in the world – the top 5% of earners have the same income as the rest of the population – which fuels high levels of violence and crime. 136
Extreme inequality [in Brazil] breeds conflict, violence and instability. All Brazilians, whatever their social class or ethnicity, are affected by this crisis of inequality. This is what unites us.
Of course, extreme inequality is not the only explanation for the high level of crime. Other factors, such as changing gun laws and high unemployment, have undoubtedly fuelled Brazil’s high levels of violence. However, the literature studying crime in Brazil – and in South America more generally – is unanimous in citing wealth inequality as one of the main factors explaining high levels of insecurity. 137
A joint statement by the French Ministry of Labor, the ILO, the OECD and the IMF also states:
Around the world, growing inequalities within countries pose risks to inclusive growth, economic stability and social cohesion, in both advanced and developing economies. […] high levels of inequality contribute to undermining confidence in democratic institutions, and can ultimately call into question the foundations of our rules-based system of international cooperation.
In their book, Why equality is better for everyone (Les petits matins, 2013), the two British researchers Kate Pickett and Richard Wilkinson highlight the correlations that exist between the unequal nature of a society and the many ills that affect it (health, life expectancy, obesity, mental health, incarceration or homicide rates, drug addiction, early pregnancies, success or failure at school, carbon footprint and waste recycling). 138
Even if a direct causal link between inequality and well-being indicators cannot be established with certainty 139 their work shows that in unequal countries, the various indicators of social cohesion, well-being and the state of the environment are lower than in more equal states. On the other hand, these indicators are not correlated with the level of GDP per capita, as shown by the example of the USA: despite having one of the highest GDP per capita levels in the world, the USA has a rather low life expectancy for a developed country, a high obesity rate, and an abnormally high homicide rate – these three indicators being associated here with the notions of social cohesion and well-being. 140
Inequalities and subjective well-being
In addition to objective indicators, other studies focusing on the subjective assessment of people’s well-being have sought to investigate the potential links between well-being and inequality: they show that people living in more egalitarian countries also tend to declare themselves happier (See also our module on GDP to find out more about subjective indicators of well-being).
This relationship between inequality and well-being can be explained by a feeling of injustice and a lack of trust in leaders. Unsurprisingly, these feelings are particularly felt by the most disadvantaged – who report lower satisfaction and well-being than the better-off. Similarly, rising inequality tends to make poorer people feel that their chances of “climbing the social ladder” are limited. 141
Studies also suggest that inequalities play a decisive role in well-being insofar as they lead to comparison with others. As mentioned in Essentiel 7, the perception of inequality is largely based on comparisons with those around us.
Based on this finding, research has shown that it’s not just a person’s income that determines their well-being, but also their ability to compare their income with those around them. 14 1 In other words, for the same income, people living in wealthier neighborhoods declare themselves less satisfied with their lives than people living in similar neighborhoods where the average income is slightly lower. 143
It shows that people are more “satisfied” with their lives when they live in a more egalitarian country – this link being particularly well established for Western European countries.144
Find out more
The poorest populations are the hardest hit by ecological crises
As explained in the introduction to this module, there are several types of environmental inequality:
- inequalities in exposure to ecological crises and access to the environment
- inequalities in adaptability
- impact inequalities (for example, inequalities in terms of contribution to pollution – see Essential 4 and Misconception 5),
- inequalities induced by environmental policies (see Essentiel 9)
- inequalities in terms of influence on the implementation of environmental policies(see Feature 9).
We focus here on the first two types of inequality, starting with those linked to climate change, for which a vast literature is available.
Around the world, the climate crisis affects the poorest first
Internationally, poor countries are the most vulnerable to global warming
Whether on a national or global scale, the poorest populations are the most vulnerable to the climate crisis, even though they are responsible for fewer greenhouse gas (GHG) emissions.
The 45 Least Developed Countries (LDCs), defined by the United Nations as “the poorest and weakest group of countries within the international community”, account for 28% of those affected by climate-related disasters, even though they are home to 14% of the world’s population and emit less than 4% of CO2 emissions.
Climate disasters affect more and more people in the least developed countries
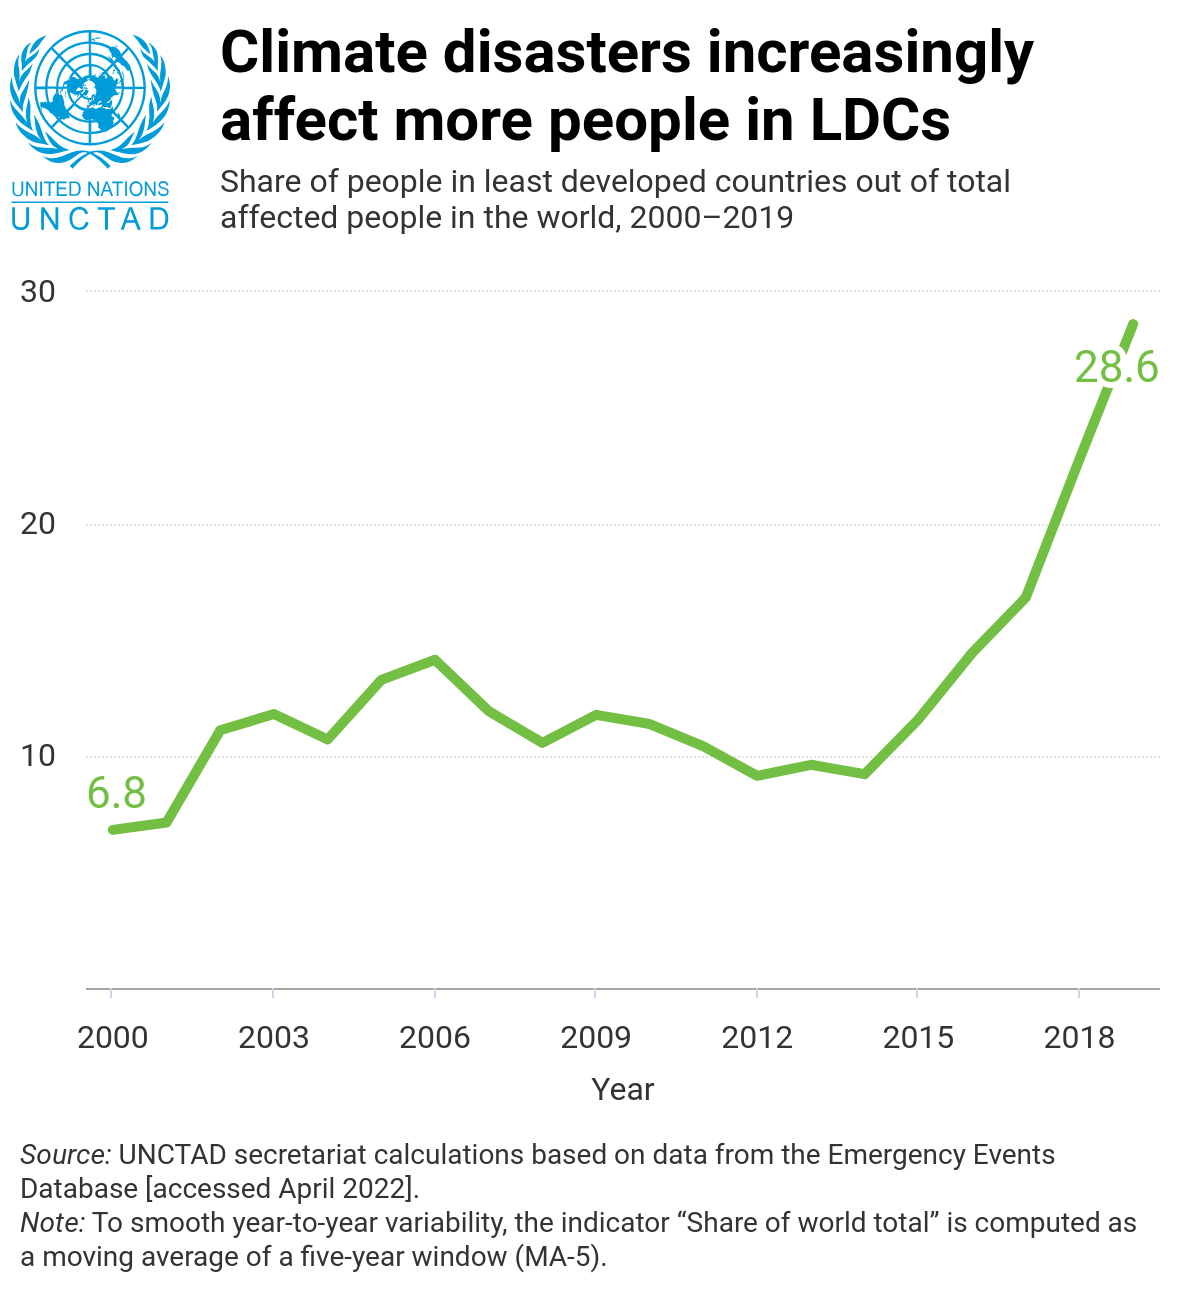
Source Least Developed Countries Report 2022, UNCTAD
Reading: in 2018, 28.6% of people affected by climate-related disasters worldwide lived in the least developed countries.
According to the IMF, Sub-Saharan Africa, home to around 60% of the world’s people living below the poverty line, “is perhaps the region most vulnerable to climate shocks. A third of the world’s droughts already occur in sub-Saharan Africa. Given its dependence on rain-fed agriculture, the region is particularly exposed to rising temperatures and extreme weather events.” 145 The IMF points out in passing that this is “the region that contributes the least to global CO2 emissions, with less than 3% of the total.”
Oxfam calculated 146 that in the 10 countries with the highest number of UN humanitarian appeals linked to extreme weather events between 2000 and 2021, the number of acutely food-insecure people has more than doubled, from 21 to 48 million.
Adelle Thomas, Vice-Chair of IPCC Working Group 2 on Climate Impacts, Adaptation and Vulnerability, explains that “the losses and damage [associated with global warming]” 147 “disproportionately affect developing countries and vulnerable populations, such as people at the bottom of the socio-economic ladder, migrants, the elderly, women and children.” 148 According to Unicef, half of the world’s poor are children. 149
Climate: a poverty trap that feeds inequality
More than 130 million additional people could fall into poverty as a result of climate change by 2030, according to World Bank estimates.150
“Global warming constitutes a poverty trap, complicating adaptation to climate change in developing countries, particularly in countries with the lowest income levels due to their low resilience and high socioeconomic vulnerability. “ This is the conclusion of research carried out by three Banque de France economists in 2021. 151
Two Stanford researchers even estimate that, over the period 1961-2010, climate disruption has increased inequalities between countries by 25%.152
Vulnerability to climate change is also increasing inequalities within countries, particularly in the developing world, according to an IMF study in 2022.153
In rich countries, it is also the poorest who suffer most from global warming
People who are already vulnerable, including low-income populations and other marginalized communities, have less capacity to prepare for and cope with extreme weather events and climate impacts, and are likely to be harder hit.
In 2021, the Environmental Protection Agency (EPA), published a detailed study 154 of the impacts of global warming on four “socially vulnerable” populations in the United States: low-income; minorities (African-Americans, Hispanics, etc.); non-graduates; 65 and over.
It concludes that “ethnic and racial minorities are particularly vulnerable to the most significant consequences of climate disruption.”
For example, in 2021, black Americans were 40% more likely than the rest of the population to live in places where mortality due to extreme temperatures would increase the most with +2ºC warming.
There’s also, of course, Hurricane Katrina, which devastated New Orleans in 2005, or the monster floods in Houston in 2017, caused by Hurricane Harvey. 155 In both cases, it was Black and poor neighborhoods that were disproportionately affected, the vulnerability of these neighborhoods and their populations being the result of political choices. Thus, for example, an investigation by the US Department of Housing and Urban Development, made public in 2022, showed that the state of Texas had largely favored white communities in the allocation of federal funds intended to prevent natural disasters. 156
In the collective imagination, natural disasters don’t discriminate; on the contrary, they strike everyone equally. Hurricanes do not select victims according to race, gender or class, but neither do these catastrophes occur in historical, political, social or economic voids. On the contrary, the consequences of these disasters reproduce and exacerbate the extent of existing inequalities, and often highlight the importance of political institutions, processes, ideologies and norms.
In France, according to a survey carried out in 2022 157 76% of people living in Quartiers Prioritaires de la Politique de la Ville (QPV) 158 said the temperature in their homes was too high in summer, and 52% too low in winter. For the population as a whole, these percentages are 56% and 35% respectively.
According to Insee, “in mainland France, 3.5 million households, or 14.8% of all households, declared that they had suffered from the cold in their homes during the winter of 2005. This proportion rises to 22% among the poorest 25% and 10% among the wealthiest 25%.” 159
Finally, while very few studies exist on the subject 160 it is clear that homeless people are particularly vulnerable to extreme events, which are on the increase as a result of global warming.
Unequal in the face of climate damages, unequal in the face of adaptation costs
As well as being more vulnerable today, the poorest countries will also be more vulnerable tomorrow. On the one hand, they have less capacity to repair and compensate for damage (rebuilding infrastructure, shops and houses after a cyclone, or compensating for lost harvests), and on the other, these countries do not have the means to prevent the destruction caused by climate change (early warning systems, transforming agriculture, building resistant infrastructure, etc.).
This is shown, for example, by the annual ranking established by the Notre Dame Global Adaptation Initiative (ND-Gain). This ranking by the University of Notre Dame (USA) is used by various economic and political players (governments, IMF, rating agencies, etc.) to assess the ability of countries to cope with climate change.
This assessment is based on indicators of vulnerability andreadiness:
- Vulnerability measures a country’s exposure, sensitivity and capacity to adapt to the negative impacts of climate change.
- Readiness refers to the state’s ability to raise funds and implement adaptation measures. ND-Gain looks in particular at economic, governance and social aspects.
The graph below clearly illustrates the fragility of LDCs and their lack of capacity to adapt.
Reading: Colored dots represent the 45 LDCs, with the exception of South Sudan, which is not included in the ND-Gain index due to lack of data.
Countries in the upper left quadrant (in red) are highly vulnerable to climate change, and have little capacity for anticipation.
Only 5 of the LDCs (Kiribati, Rwanda, Solomon Islands, Timor-Leste, Tuvalu) are in the upper right quadrant, i.e. they are highly vulnerable but have a certain capacity for anticipation to implement actions enabling them to adapt to global warming.
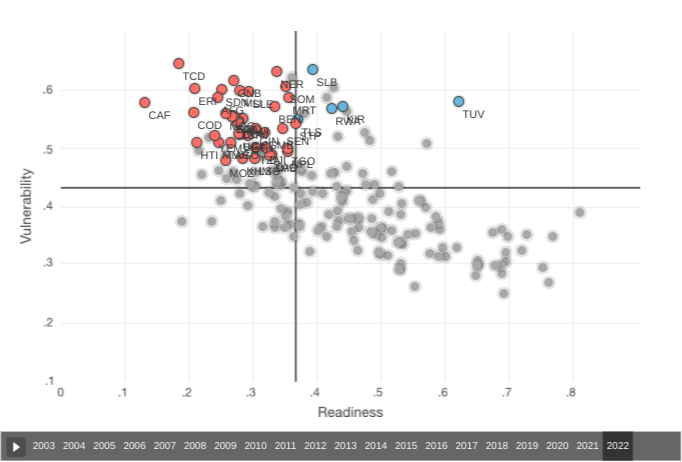
Source ND-Gain, 2021 data
In 2019-2020, less than 8% of climate financing (public and private) worldwide was dedicated to adaptation, i.e. around $49 billion. 161 Yet the investments needed for adaptation in developing countries are estimated at between $160 and $340 billion a year between now and 2030 by the United Nations Environment Programme, which also points out:
Estimated adaptation costs/needs are currently 5 to 10 times higher than international funding flows, and the adaptation funding gap continues to widen.
In developed countries, adaptation is also less accessible to low-income households: as mentioned in misconception 5, insulating your home, for example, involves a considerable investment, which is not necessarily within the reach of small homeowners. As for tenants, they are dependent on their landlord and the property market.
Can’t insure your home in a hot world?
More and more regions around the world are becoming uninsurable. In California, for example, several major insurance companies have, as of 2023, “paused” signing new policies. One of them, AllState, explains that “the cost [to the insurance company] of insuring new homeowners in California is far greater than the price they would pay, due to wildfires, rising repair costs and higher reinsurance costs.” 162
Families with low incomes are therefore faced with impossible choices: staying at home without insurance and risking losing everything; paying insurance that is beyond their means; selling their home for far less than they expected and looking for somewhere else to live.
This example is far from isolated: in Australia, more than half a million homes (1 in 25) will be “uninsurable” by 2030. 163 In France, Alain Chrétien, mayor of Vesoul and member of the board of the Association des maires de France, estimates that between 1,000 and 2,000 communes will have seen their insurance contracts cancelled or their premiums increase dramatically by 2024. 164
Finally, let’s remember that a large part of the world is uninsured: in 2018, in a study covering 43 countries, the insurance company Lloyds estimated the value of uninsured property at $162.5 billion – 96% of which was in developing countries.165
This estimate conceals another reality: the lack of reliable data for assessing damage. In 2023, a study by the United Nations Office for Disaster Risk Reduction estimated that, of the more than 11,000 natural disasters that occurred between 1990 and 2020, data on insured property was missing in 88% of cases. For reconstruction costs, data was missing in 96% of cases. 166
In addition to the financial investment required for adaptation, impacted communities pay a social, cultural and emotional price. 167 In 2016, the inhabitants of Isle de Jean-Charles in Louisiana had to be moved inland as their island gradually disappeared. At a cost of $48 million to the federal government 168 A loss of a way of life, a culture and part of the community’s identity.
Find out more
- Céline Guivarch, Nicolas Taconet Inégalités mondiales et changement climatique, OFCE Review, 2020
- Uninsurable future, chapter in Interconnected Disaster Risks, United Nations University Institute for Environment and Human Security (UNU-EHS), 2023
- The invisible toll of disasters, United Nations Office for Disaster Risk Reduction, 2022
- How Federal Disaster Money Favors The Rich, NPR (05/03/2019)
- As Gulf swallows Louisiana island, displaced tribe fears the future, Des Moines Register (02/29/2020)
Pollution and environmental inequality
Similarly, environmental pollution and destruction of all kinds primarily affect the most vulnerable populations, in both developing and wealthy countries.
In 2024, the European Environment Agency stated: “Communities with the lowest levels of income and education are more often impacted by air, water and noise pollution. […] In many cases, vulnerable groups are exposed to multiple environmental and climatic risks.” 169
A collective study Pollution and health: a progress update, published in 2022 by The Lancet Planetary Health, estimates that “[between 2000 and 2019], deaths from modern forms of pollution (e.g. ambient air pollution and toxic chemical pollution) increased by 66%, due to industrialization, chaotic urbanization, population growth, fossil fuel use and the lack of adequate national or international chemical policies.”
According to the authors, these forms of modern pollution account for around 5.8 million deaths a year. They also note that “high-income countries with programs to address air and chemical pollution continue to show progress [in preventing deaths from these pollutions], but only a handful of low-income countries show measurable progress.”””
Industrial pollution poisons disadvantaged communities
In the United States, numerous studies and journalistic investigations have shown that poor, non-white populations are particularly exposed to all types of pollution – and their effects on health.
One example is Cancer Alley, along the Mississippi River in Louisiana. This 137 km-long area is home to some 200 chemical and fossil fuel plants. The NGO Human Rights Watch describes the situation in a 2024 report entitled We’re Dying Here’: The Fight for Life in a Louisiana Fossil Fuel Sacrifice Zone.
“Cancer Alley residents were exposed to health risks from hazardous air pollutants more than ten times higher than residents in the rest of the state.”””” Black residents of Cancer Alley are even more at risk than white residents, with the most polluting operations disproportionately concentrated in black communities.””
Legend: Cancer Alley is the set of dark blue dots in the southwest of the country, the area with the highest cancer risk in the country.
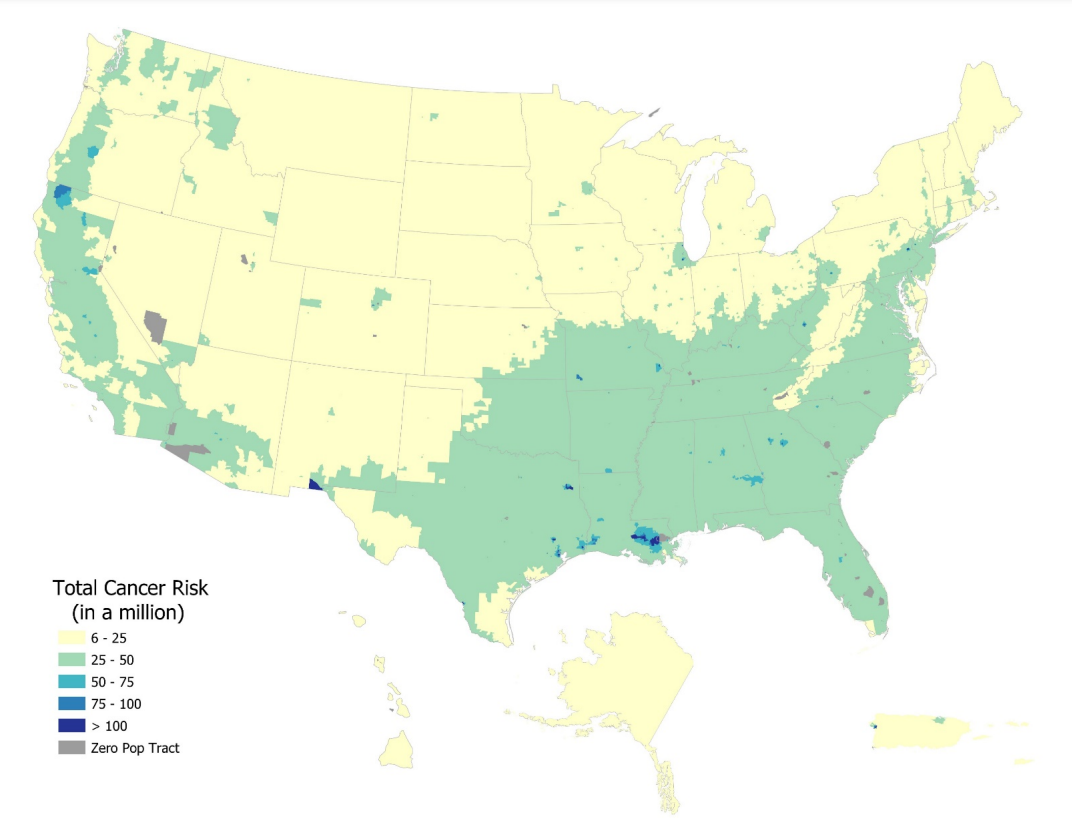
Source Environmental Protection Agency (EPA) evaluation: 2014 NATA Summary of Results, 2018
Pollution: toxic inequalities for low-income countries
This trend towards greater exposure of vulnerable communities (low incomes, “minorities”, low levels of education) can be seen worldwide. Examples include pollution from mining, water pollution and the processing of electronic waste.
In June 2021, the WHO studied for the first time the extent of the impact of electronic waste on children’s health. 170 The organization points out that “electronic and electrical waste (e-waste) is the fastest growing household waste stream worldwide. […] Unmonitored sites in low- and middle-income countries host a large proportion of the world’s e-waste.”
Of the 53.6 million tonnes of electronic waste generated in 2019, only around 17% was recycled via appropriate channels. 171
The WHO explains that “an unknown proportion of the remaining 83% is processed in a vast, informal, globalized system of waste recovery sites, mostly located in low- and middle-income countries.”
For example, the Agbogbloshie site in Accra (Ghana) receives around 215,000 tonnes of used electronic equipment every year. Around 40,000 people live in this area, which the report considers to be one of the most toxic in the world. In the same report, the WHO points out that scientific literature suggests a link between exposure to electronic waste and numerous health problems such as immune system dysfunctions, endocrine disruption, impacts on neurological development, the onset of chronic diseases, etc. The WHO estimates that 18 million children are exposed to these risks.
Resource exploitation and indigenous peoples
Indigenous peoples are among the hardest hit by ecological crises. They are particularly vulnerable because their lifestyles are closely tied to their environment, and because they receive little attention and protection.
We had to wait until 2007 and the United Nations Declaration on the Rights of Indigenous Peoples 172 for international recognition of their right to Free Prior and Informed Cons ent (FPIC ). In other words, the right of indigenous peoples to be informed and consulted on projects affecting their lands, territories and the natural resources on which they depend.
The case of “Block 192” in northern Peru is emblematic: oil extraction began in 1969, on more than 500 million hectares of ancestral land belonging to the Quechua, Achuar, Kichwa and Kukama peoples. Mining concessions, the construction of a pipeline and countless oil spills and toxic residues caused forced displacements, environmental destruction and poisoned communities for decades. In 2005, a study by the Ministry of Health showed that almost all Achuar children and adults had blood cadmium levels in excess of accepted limits.
As early as the late 1970s, Achuar representatives demanded that their territories be recognized and their rights respected. Since then, legal advances have been made: the peoples of the region have seen their right to be informed and consulted recognized. In March 2024, legal action by indigenous women led to recognition of the Marañón River as an entity with rights, including the right to exist and not to be polluted. 173
But the situation remains catastrophic: for more than 1,000 sites – on “block 192” alone – no clean-up plan was in place by 2020. The main company responsible for the pollution, PlusPetrol Norte SA, declared itself bankrupt in 2020 – despite the fact that its parent company, PlusPetrol, presented itself on its website in 2024 as “the leading private oil and gas company in Latin America”… In addition to illustrating the difficulties faced by indigenous peoples, this example also shows the problems linked to the irresponsibility of parent companies towards their subsidiaries, and the importance of attempts to implement an effective duty of vigilance.
Source For more on Block 192 in Peru Marti Orta-Martínez, Lorenzo Pellegrini, and Murat Arsel, The squeaky wheel gets the grease? The conflict imperative and the slow fight against environmental injustice in northern Peruvian Amazon, Ecology and Society, 2018 Pluspetrol Norte: un historial de sanciones sin pagar y de derrames en la Amazonía peruana, Mongabay (19/04/2022)
Find out more
- The cost of doing business? The petrochemical industry’s toxic pollution in the USA, Amnesty International, 2024
- The Poisoned City: Flint’s Water and the American Urban Tragedy, Anna Clark, MacMillan Publishers, 2018
- Environmental inequalities in Europe, Éloi Laurent, SES.ENS website, 2021
- Rights of Indigenous Peoples, Amnesty International
- Indigenous groups say Big Oil’s pollution threatens their existence in Canadian forest, NBC News (21/11/2021)
Preconceived notions
Globalization should be credited for the reduction in world poverty
The notion of globalization revolves around two points: on the one hand, increased trade in goods and services, and on the other, increased capital movements. Its proponents emphasize the benefits resulting from the development of international trade, and assert that global integration increases average incomes within countries while reducing inequalities.
In L’inégalité du monde, Pierre-Noël Giraud details how globalization – both commercial and financial – has been the driving force behind emerging countries’ catching up with developed countries, thanks in particular to the development of their manufacturing industries (as in the case of China, which has become “the world’s factory”). Globalization has had a dual effect on inequalities: on the one hand, it has reduced international inequalities – with the strong growth of certain developing countries – but, on the other, it has also catalyzed an increase in internal inequalities in Western countries(See Essentiel 3).
Inequalities and the free movement of goods and services
The most widely cited economic theory supporting the development of international trade is that of comparative advantage, developed in the 19th century by British economist David Ricardo. He recommended that countries concentrate on the production of goods for which they were more competitive – in relative terms – and trade with other countries for all other products. According to this theory, specialization and international trade would always improve a country’s situation – compared to a situation without trade.
Without going into the criticism of this theory, which we cover in our Infosheet Ricardo’s Comparative Advantages: An Inconsistent Theory, let’s just point out that it is no guarantee of the evolution of inequality in countries opening up to international trade. As detailed in Essential 3, internal inequalities in the West have been on the rise since the 1980s.
Based on this observation, some experts, such as François Bourguignon and Eric Maskin, have demonstrated the role of globalization in the growth of internal inequalities in the West. 174 The opening up of many Western countries has led to the relocation of industries to emerging regions – penalizing the poorest in the West (see the module on work and unemployment). According to Eric Maskin, this has led to a lower demand for low-skilled workers in these countries, as illustrated by the example of the automotive industry in the USA(see Essentiel 3).
Inequality and the free movement of capital
In addition to income inequality, wealth inequality in developed countries has also been on the rise since the 1980s.
Financial liberalization and rising asset prices have, among other things, catalyzed the enrichment of the wealthiest – the main holders of financial assets. Capital owners have been able to take advantage of this liberalization to invest directly in foreign companies and markets, enabling them to diversify, secure and increase the income from their asset portfolios.
The extensive liberalization of capital movements has also placed tax havens at the heart of globalization, enabling the world’s largest capital owners to escape taxation to a certain extent.
Tax havens thus contribute to accentuating inequalities(see Essential 5) in wealth within countries, as the very wealthy pay proportionally less tax than their country’s law allows, while the rest of the population pays “its share” (as provided by law).
In addition to highlighting inequalities in the face of taxation, the use of tax havens deprives states of the resources needed to finance essential public services such as healthcare and education – which are crucial elements in the fight against social inequalities. 175 (See Essentiel 6).
Find out more
- Worldwide, “inequalities have been falling for 20 years”. Interview with François Bourguignon, Observatoire des inégalités, 2022
- Why globalization may not reduce inequality in poor countries, The Economist (03/09/2014)
- Globalization, growth and inequality: implications for economic policy, Direction Générale du Trésor, 2017
Money from the rich trickles down to society as a whole
The trickle-down “theory” has never been formulated as such by any economist; the expression was even coined to mock proponents of policies favoring the wealthy classes. Yet this belief that wealth “trickles down” from the top (the richest 176 ) to society as a whole underpins a number of economic discourses – and the policies that are inspired by them.
Thus Mandeville, for whom, in The Fable of the Bees (1714), “private vices make for public good”, is a precursor of the myth of trickle-down economics. Closer to home, the policies of Margaret Thatcher and Ronald Reagan in the 1980s were guided by this trickle-down economics myth.
Schematically, by giving money to the rich (or making them save it), they would invest it and consume, thus creating growth. 177 which in turn would benefit everyone, including the poor, via job creation on the one hand, and additional government revenue on the other. 178
This belief is largely contradicted by the facts. (See Misconception 3 and Essential 2).
A 2015 study by IMF researchers 179 based on data from 159 countries, concludes that “if the income share of the richest 20% increases, then GDP growth declines in the medium term, suggesting that their profits are not trickling down. Conversely, an increase in the incomes of the poorest 20% is associated with higher GDP growth. The poor and middle classes have the greatest impact on growth”“.””
The authors cite several possible explanations for this greater effect on growth, in particular :
- increasing the disposable income of the poorest people enables them to access a higher level of training, thus increasing the country’s productivity;
- the poor and middle classes spend a greater proportion of their income than the richest (who tend to save).180
Finally, they note, “a growing body of evidence suggests that the increasing influence of the wealthy and the stagnation of poor and middle class incomes have a causal effect on crises, and therefore directly harm growth in both the short and long term.”
In 2020, a study by two economists at the London School of Economics of 18 OECD countries between 1965 and 2015 found that 181 analyzed the effect of reforms to reduce the tax burden on the richest 1%. Their conclusion? These tax policies increase the income of the wealthiest, but have no measurable impact on GDP/capita or the unemployment rate, either in the short or medium term.
Their findings are in line with those of Thomas Piketty, Emmanuel Saez, and Stefanie Stantcheva. 182 who, in 2014, estimated that“tax cuts for [the top 1% of income earners] are associated with increases in the share of pre-tax income of the richest 1%, but not with higher economic growth.”
Despite all this empirical evidence, many tax policies stem from a belief in the trickle-down of wealth across the classes of society. These policies act as a brake on the ecological transition. Indeed, such an approach effectively limits the ability of states to invest (tax revenue shortfall) and, by increasing inequalities, makes the acceptability of certain measures more complicated.
We devoted a whole article to trickle-down theory. Read it for more details on the very real consequences of this pseudo-economic and political theory.
Economic growth leads to a reduction in social inequalities
It has long been assumed that a country’s strong economic growth – i.e., its rising GDP – would necessarily lead to a reduction in inequality. However, this shortcut is questionable.
GDP measures the market and non-market added value (e.g. public services) produced in a territory in a single year; another way of calculating it is to add up all the income received by its population (see our module: GDP, growth and planetary limits for more details). From this measure, we regularly evaluate “GDP growth”, i.e. the increase in GDP from one year to the next. In other words, if the sum of the incomes of a country’s inhabitants rises sharply, then the country will experience strong growth.
An organic link between growth and inequality?
In the 1950s, economist Simon Kuznets defended the idea of a fairly clear link between growth and inequality through his famous curve. 183 Based on the German and British cases during the industrial revolution of the 19th century, he determined a “general law” between growth and inequality in the form of an “inverted U” curve.
This curve is supposed to explain the link between growth and inequality
Legend On the x-axis we note GDP per capita, and on the y-axis the level of income inequality – described, for example, by the Gini coefficient.
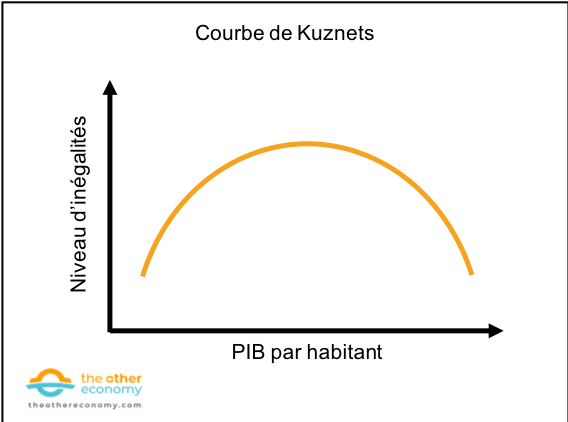
This theoretical curve describes three successive situations.184
- For low-income countries, the first phase of development is synonymous with increasing inequality. It involves massive investment in infrastructure and productive capital (machinery, factories, etc.) – which stimulates growth. Economic players able to invest and save are the big winners, which exacerbates inequalities,
- In the “middle” of the curve, as GDP per capita rises – and the country develops – the growth in inequality slows and then levels off. This is linked to a better-educated population – and a growing proportion of employees in the tertiary sector – who have more bargaining power over wages, as well as to the gradual implementation of redistribution policies.
- Once a certain threshold of development has been reached, inequalities begin to diminish (redistribution policies, etc.).
In other words, a high level of inequality would be “natural” at a certain stage of development. All that’s needed is for the country’s GDP per capita to continue growing for inequality to decline.
The Kuznets curve, though often cited in the media, has come up against empirical analyses that dispute any generalization about a potential “U-shaped” relationship between inequality and growth.
Although it’s not easy to gather reliable data on inequality levels in Europe during the pre-industrial period, it is clear that inequality was already high at that time. The Industrial Revolution thus appears to be just one factor in the rise of inequality in 19th-century Europe. 185
With regard to the second and third phases of the Kuznets curve, Thomas Piketty’s work has shown that the reduction in inequality is not organically linked to growth in France and the United States. 186 According to Piketty, the decline in inequality observed at the beginning of the 20th century in Western countries was in fact the consequence of one-off, unexpected events (war, high inflation) and the implementation of redistribution policies (income taxes) – there is therefore no “mechanical” or “natural law” link between inequality and growth.
Moreover, as we shall see, growth can be accompanied by rising inequality.
Growth doesn’t benefit everyone equally
GDP offers an aggregated view at the scale of a country, a region, or the world. However, even if total income increases, this growth may not be captured in a similar way by the whole population, which can increase inequalities.
Worldwide
In the 2021 edition of The Changing Wealth of Nations report, the World Bank notes that global GDP did increase between the 1990s and the end of the 2010s. Over these three decades, developing countries have continued to catch up with wealthier nations. In particular, the intensive use of natural capital in the poorest countries has fuelled global growth, leading to a worldwide reduction in inequality (see also Essentiel 3 and idée Reçue 1).
However, this does not mean that all countries have benefited from this growth. More precisely, the poorest countries have not all followed the same trajectory as China or other emerging countries: in more than a third of “very low-income” countries 187 per capita GDP actually fell over the three decades.
It should also be noted that this global enrichment, in addition to not having benefited everyone, has come at the cost of unsustainable management of natural resources, particularly in the poorest and developing countries (massive deforestation, over-fishing, etc.).
At national level – the case of OECD countries
Between the 1980s and the 2010s, in almost all OECD countries, growth in the incomes of the poorest 20% was lower than growth in GDP per capita. 188 This is what determines whether income inequalities within a country are rising or falling.
This is illustrated by the example of the United States: since the 1980s, the incomes of the richest 20% have always grown faster than those of the poorest 20%.189
A similar observation can be made in France: the average standard of living in France rose by 23% between 1996 and 2019 for the population as a whole, by just 17% for the poorest 10%, and by 31% for the richest 10%.
190
Inequality has therefore increased, even as the median standard of living has continued to rise (with the exception of three years).
191
In other words, GDP growth is no guarantee of reduced inequality, as not all sections of the population benefit equally.
This is illustrated by the following graph at regional level: since the 1980s, GDP per capita has risen in Western Europe and North America, as has the share of total income received by the top 10% in these regions.
Reading: in 1980, in Western Europe, GDP per capita was around 30,000 euros, and the share of national income received by the top 10% was 31%. Forty years later, GDP per capita had risen to 50,000 euros, but the share of the top 10% had also risen, to almost 36%.
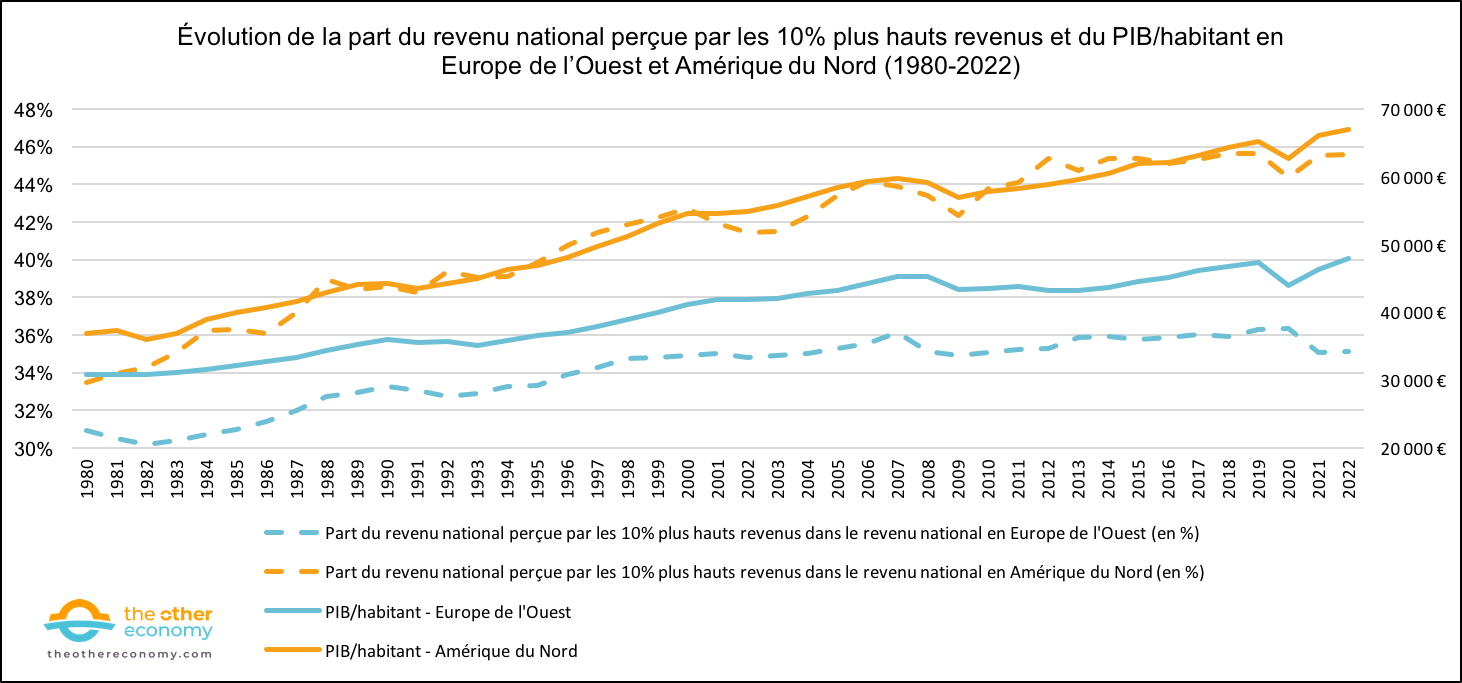
Source World Inequality Database (WID). Note: right-hand scale for the share of national income received by the top 10% in national income (in %); left-hand scale for GDP/capita in tens of thousands of euros. For an exhaustive list of countries included in Western Europe and North America, see the Code Dictionary page of the World Inequality Database website.
The nature of the public policies implemented has an impact on the link between growth and inequality
Work carried out in 2016 by OECD researchers shows that public policies implemented to stimulate growth can, depending on their nature and target, reduce or increase inequalities.192
According to this study, between the early 1980s and the early 2010s, when growth was based on an increase in labor productivity, this tended to have inequitable effects (notably because these productivity gains mainly affected the most qualified people, via the deployment of cutting-edge technologies for example).
Conversely, public policies promoting higher employment rates and investment in job search assistance programs have both stimulated growth and reduced monetary inequality – by bringing greater income gains to households at the bottom of the ladder compared to the average household. 193
OECD researchers have concluded that redistribution mechanisms (taxes, transfers) help to reduce inequality without harming growth, provided they are targeted. In this context, reforms encouraging access to training and lifelong skills development appear to be particularly effective in combating inequality. 194
“If the OECD has made it clear in previous work that the benefits of growth do not spread by themselves to the lower strata of society, the new evidence comes full circle in suggesting that inequality also has an impact on growth. It’s likely that policies that help to halt or reverse the trend will make societies richer, as well as less unfair.”
Economic growth is a prerequisite for social justice
Many economists have addressed the question of the fair distribution of resources. Adam Smith, for example, is considered “the father of economics”:
“Can we ever regard as a disadvantage to the whole that which improves the lot of the greater part?”
He continues: “Surely a society whose most numerous members are reduced to poverty and misery cannot be regarded as happy and prosperous. Equity alone, moreover, demands that those who feed, clothe and house the whole body of the nation, should have, in the product of their own labor, a sufficient share to be themselves passably fed, clothed and housed.”
But as economist Agnar Sandmo points out , “the study of income distribution is so closely linked to questions of equity and justice that many economists, eager to detach themselves from ethical issues, have tended to turn away from it.” 195
Thus, in the 1870s, with the emergence of the neo-classical school, economists tended to focus more on the “efficiency” of distribution, i.e. the “optimal” allocation of resources for growth, seen as an indicator of a country’s social well-being.
“Economic theory has long neglected the effects of income distribution on economic performance. Students were taught from the very first year of their studies that the subject of efficiency had to be separated from that of equity. The idea was that the size of the cake had to be maximized before it could be shared. Implicit in this dichotomy was the idea that the economist should deal with the question of efficiency, leaving distribution (or redistribution) to politics.”
Would the reduction of inequality then be a subsequent step to economic growth? In other words, we’d have to increase the size of the cake first, before looking at the size of the shares. In this case, the question arises of how big enough is enough before we can finally turn our attention to redistribution. No economist seems to have an answer to this question. As we pointed out in Essentiel 2, the world as a whole has never been so rich. In 2022, global GDP was over $100 trillion. So the cake is already looking pretty big.
The underlying logic is that of scarcity: redistribution is illusory if the quantity of wealth produced does not allow people to live adequately. This situation is a reality in poorer countries, where growth in production is necessary to meet the population’s essential needs. On the other hand, developed countries today have the technical and organizational means to guarantee a satisfactory quality of life for all their inhabitants.
Growth then becomes just another political objective, no more desirable than reorganizing our societies to ensure a decent minimum for the most vulnerable. The political philosopher John Rawls, for example, defended the idea that a political decision is only just if it improves the condition of the weakest. 197 (see Essentiel 8).
“There’s no reason to make efficiency a value in itself, above all other considerations”.
Moreover, as we explained in Misconception 1, too much inequality is a brake on growth. So it makes no sense to worry about growth without also tackling inequality.
Finally, it seems unrealistic to want to perfect a system that is economically “efficient” but blind to inequalities, in order to later transform it and make it take social justice into account. The slow and imperfect results of positive discrimination policies (see preconceived notion 8), which are supposed to rebalance systemic inequalities, show that profoundly transforming the way society works is no easy task.
Making the rich pay would be enough to achieve our climate objectives
Now that the Paris Agreement has set a target for reducing CO2 emissions by 2050, the question of individual and collective responsibility arises. The fact – now well known – that the richest individuals pollute more than the poorest (see Essentiel 4) may lead us to believe that a simple reduction in the CO2 emissions of the richest would be sufficient to reach our targets by 2050. However, there are several reasons why this reasoning is inadequate and wrong.
Individual efforts will not be enough to achieve our decarbonization targets
Firstly, an analysis of individual emissions reveals that the impact of individual actions alone cannot meet emission reduction requirements – whether we are rich or poor.
Individual efforts are certainly not negligible (choosing low-carbon transport, reducing consumption, giving up meat, investing in home insulation, etc.). However, as a study by Carbone 4 reveals 199 on France, it is totally unrealistic to hope to achieve our 2050 targets by relying solely on individual decisions. Carbone 4 estimates that a realistic and moderate individual commitment would only enable emissions to be reduced by a quarter of the stated targets.
In other words, three-quarters of the way there is to go depends on companies and public authorities, in particular through the introduction of incentives and regulations favorable to decarbonization.
Impact of individual and collective actions on the carbon footprint
Reading: in France in 2019, the individual carbon footprint was 10.8 tCO2e. Voluntary individual action could reduce this figure by around 2.2 tCO2e per capita – which would still fall short of the Paris Agreement target of 2 tCO2e.
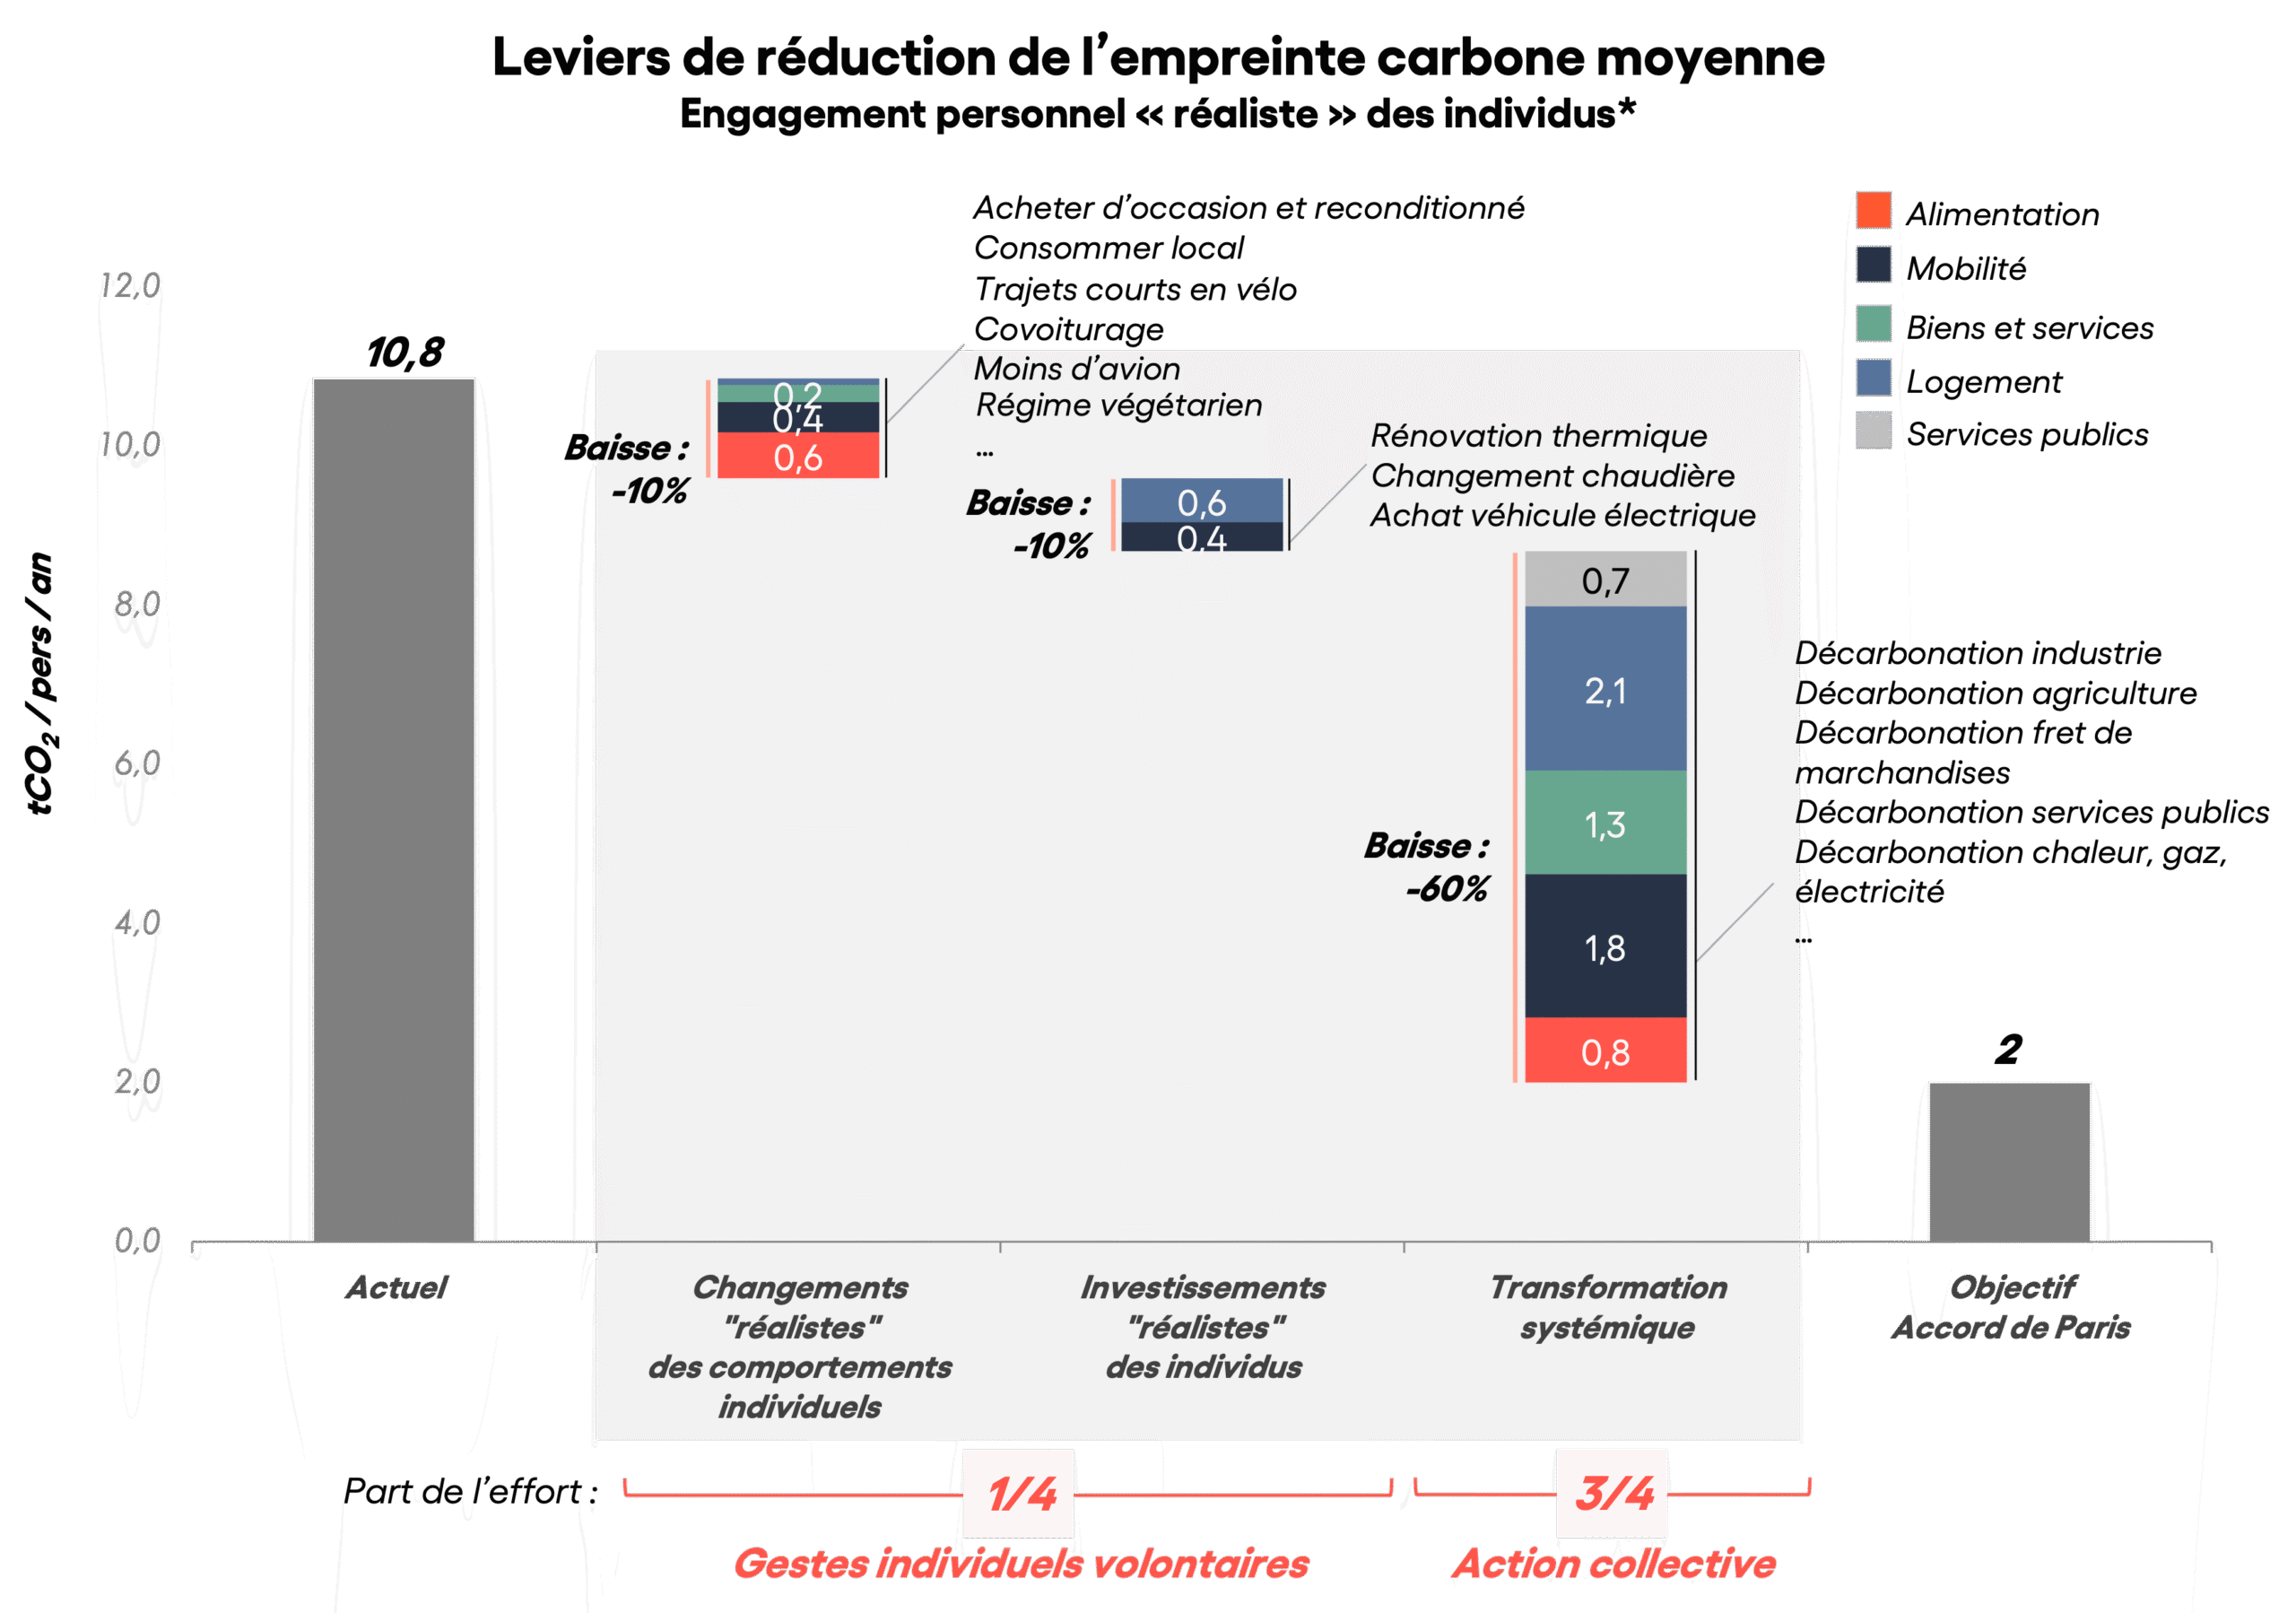
Source Faire sa part?, Carbone 4, 2019
Who should bear the burden of the ecological transition?
Let’s start by pointing out that reducing our carbon footprint requires certain investments that are difficult for more modest households to afford.
While some actions are free or even save money (turning down the thermostat, cycling for short distances, cutting down on meat consumption, etc.), their impact remains limited, and the cultural image conveyed by these actions is not the same for all income classes: not eating meat may be seen as a sign of modernity in some populations, while in others it may be seen as a downgrade. In other words, the same action can be perceived as a deliberate sobriety on the one hand, and a consequence of poverty on the other, which doesn’t make it easy to adopt.
But reducing greenhouse gas emissions doesn’t just depend on consumption habits: it also requires substantial investment (renovating your home – and therefore owning it – installing a heat pump, buying an electric car, etc.) and therefore investment capacities that the poorest people don’t have in the absence of public aid.
The wealthiest have the means to implement these actions, and some have lifestyles that emit excessive amounts of greenhouse gases(see Essentiel 9). Would limiting these excesses be enough to balance the scales? No.
A quick calculation shows 200 that if the emissions of the richest 50% were reduced to the current median level, overall French emissions would fall by around 15%. If the emissions of all French households were brought down to the level of the poorest tenth, then total emissions would fall by only around 35%: this is significant, but far from the target of reducing greenhouse gas emissions by 80% to reach net zero. 201
So, even if CO2 emissions are concentrated among the richest, this does not mean that we don’t need a “generalized” climate transition. It won’t be enough to change the behavior of the ultra-rich alone.
The rich are rich because they deserve it
The myth of the self-made man, and the meritocratic ideal that stems from it, are among the founding discourses of the United States, and continue to influence imaginations the world over: a narrative that outlines the dream of achieving success (i.e. money and power), starting from “nothing”, purely on one’s own merit. Of course, such trajectories do exist, but they are the exception, and conceal the scale of systemic inequalities.
These speeches support the idea that the rich are rich only because of their own qualities and efforts. This idea is obviously false, for two main reasons.
No-one evolves completely independently of his or her social environment.
The famous abolitionist Frederick Douglass, though a perfect example of a self-made man 202 put it this way:
There are no self-made men in the world, strictly speaking. The term implies an individual independence of past and present, which is not possible.
[…] In reality, it has to be said, even if forced individuality and self-importance may not sit well with it, no natural strength of character, and no greatness of originality can raise a man to absolute independence from his fellow men, and no generation of men can be independent of the previous generation.203
The most famous recent example of a supposed self-made man is Donald Trump Jr. The businessman and President of the United States from 2016 to 2020 has often boasted of being a self-made billionaire, and has made his “success” 205 as one of his campaign and popularity planks. Various journalistic investigations have shown, however, that he received nearly $150 million 206 from his parents. So it can’t be said that he came from nothing…
In addition, Trump was able to leverage these first millions by relying on his father’s professional network (Bourdieu’s social capital, discussed in Essential 1), as well as on the financial (and tax) system, infrastructure and skills existing in the United States. Finally, we might add that, as a white male, he has probably not suffered racist or sexist discrimination in the course of his professional career.
Privileges at birth are decisive
While we are theoretically born equal in rights, we are not all equal in practice.
In a note published by France Stratégie in 2023 that focuses on four factors (gender, parents’ occupation, migratory ancestry 207 and territory), the authors conclude that social origin proves to be a decisive criterion in terms of income. “With comparable characteristics, the average income gap between people from favored and modest backgrounds amounts to 1,100 euros per month.” 208
The study also shows that gender is the second most influential attribute on income, with a gap of 600 euros per month between men and women, all other things being equal. The authors point out that gender is the only factor for which income inequality has changed between 2010 and 2018, with the gap between men and women narrowing by 28%.
Inheritance perpetuates inequality
As Frederick Douglass pointed out, we are also dependent on our past, and in particular on the “capital” we inherit (in Bourdieu’s sense) – capital that can be economic, social or cultural(see Essential 1).
Turning to wealth, a note from the Conseil d’analyse économique in 2021 209 highlights the edifying concentration of wealth in France:
“Within a single generation], 50% of individuals will have inherited less than 70,000 euros in wealth over their lifetime, and of these, a large fraction will have inherited no wealth at all. […] Within [the] last decile”. 38“Concentration is extreme: the top 1% of heirs in a generation will receive an average of over 4.2 million euros net of tax […]. The average inheritance of the top 0.1% is therefore around 180 times the median inheritance. […] The top 1% of a cohort’s heirs can now obtain, through a simple life as an annuitant, a higher standard of living than that obtained by the top 1% of “workers”.”
They conclude:
“To reach the very top of the distribution of living standards, it becomes almost imperative to be lucky enough to inherit.”
Far from being a meritocracy, the advantages we enjoy from birth, whether by social class, gender, skin color, etc., generate privileges that accumulate throughout our lives.
Find out more
- Le mythe de l’entrepreneur Défaire l’imaginaire de la Silicon Valley, Anthony Galluzzo, La Découvrete, 2023.
- Interview with researcher Anthony Galluzzo: “The myth of the self-made entrepreneurial genius helps justify a social order” Le Monde, 2023.
- Inégalité des chances : ce qui compte le plus, France Stratégie, 2023.
- Meritocracy in May 2033, Michael Young, Futuribles, 1969 (Original publication: The rise of meritocracy, 1958): Satirical and dystopian essay that sees the birth of the term meritocracy.
To get out of poverty, all you have to do is give yourself the means.
The symmetrical idea behind the myth of the self-made man and the meritocratic ideal, which we saw in the previous Received Idea, is that if the poor are poor, it’s also because they deserve to be. They don’t have the qualities or the will to get out of their situation. In particular, there are two persistent and correlated clichés: poor people spend their money (badly), and they don’t make the effort to save to give themselves the means to get by.
Do poor people mismanage their money?
Various studies have examined the issue, and come to contradictory conclusions. For example, a study published in 2013 in the journal Science 211 evaluated that being preoccupied with financial problems “has a cognitive impact comparable to” “that of losing a full night’s sleep”, leading to “poor decisions”. The study is based on questions posed to passers-by in a shopping mall in the USA, but also on cognitive tests presented to Indian peasants. In 2015, two of the same researchers concluded, in another study 212 that people of modest means are more rational in their economic decisions than wealthy individuals.
In the light of this research, it seems difficult to draw any conclusions – one way or the other – about the financial management skills of the poor.
“The poor are no less rational than anyone else – on the contrary. Precisely because they possess so little, they are often extremely cautious in their choices: it’s only by developing a complex economy that they can survive.”
Duflo and Banerjee’s assertion that the poor manage their money prudently and rationally is based on the results of numerous empirical studies.
Indeed, a multitude of programs carried out in developing countries clearly show that the most effective form of household assistance is the so-called cash-transfer: families receive money because they are in the best position to assess and prioritize their needs.
A meta-analysis by the British think-tank Overseas Development Institute, based on 165 studies covering 56 programs in 30 countries, shows that this type of program has a positive impact on monetary poverty, school enrolment, access to health care and the diet of beneficiary households.213
The example of Bolsa Familia
Bolsa Familia is a Brazilian cash-transfer program created in 2003 under President Lula. Through Bolsa Familia, poor families receive small sums of money, on condition that their children attend school and that mothers and children have regular medical check-ups.
An impact study 214 published in 2007 claims that “Brazil’s Gini coefficient fell by 4.7% between 1995 and 2004, and that Bolsa Familia is responsible for 21% of this difference”. It should also be pointed out that this impact was achieved in just two years, Bolsa Familia having begun in 2003!
The authors continue “Given that [these] transfers represent only 0.5% of total Brazilian household income, it’s impressive that Bolsa Familia is the second largest source of income – after labor income – thus reducing inequality.”
The success of Bolsa Familia has inspired many similar programs, even in wealthy countries such as the United States.
Beyond the benefits for families and the effects on inequality, research based on the transfer of money by an NGO to over 10,000 families in Kenya between 2014 and 2017 215 even estimates that the program benefits the local economy as a whole, with a multiplier effect of 2.6: i.e., for every $1 paid out under the program, the local economy grew by $2.60.
Sociologist Denis Colombi, who has written a book on how low-income households spend their money, has written a book on how low-income households spend their money. 216 agrees with Duflo and Banerjee’s observations: “The main finding of the sociologists is that poor households manage their money with great care and rigor, contrary to what we are led to believe. Simply because they have no choice.” 217
He explains 218 that “budget management, [which is] a very feminine activity, is a real ‘moneywork‘ […]: we are constantly on the lookout for ‘good deals’ […]” . “and promotions, we relentlessly inspect labels to compare prices or expiration dates, and, often, we manage stocks, whether of food, […]- household products or anything else. These are all practices that require calculation and forecasting skills that I’m not sure most of the middle and upper classes apply on a daily basis…”
What the work of sociologists highlights is that being poor means depriving oneself all the time. Pleasure” spending, often put forward as “proof” of poor management, must be interpreted within this framework of perpetual deprivation. Giving your child brand-name sneakers or a smartphone is not irrational: all parents want to protect their children (in this case, from the stigma of poverty and mockery at school); a smartphone allows you to do things online (without the cost of a computer) and has become a marker of belonging to society.
“To be poor is to be forced into permanent self-denial”.
How do you save when you’re poor?
As we’ve seen, the conventional wisdom that poor people spend their money “badly” doesn’t hold water. But what about savings? points out the Observatoire des inégalités. 219
In 2017, in France, the lowest 20% of income earners saved less than €360 a year. The equivalent of half a month’s rent. 220 By comparison, the 20% with the highest incomes saved nearly €16,000. These figures show that saving is not enough for the poor to become rich, or even to escape poverty.
Let’s quote Denis Colombi again, who explains that poor people’s savings can also take a non-monetary form: “it’s simply more rational, in their situation, to conserve value in material form than in liquid form. If a bill comes in, no one will come and take your peas out of the freezer. And stocks are reassuring in the face of uncertain income. It’s a popular form of saving.”
The double penalty of poverty
One of the reasons why poor people can’t save is that being poor is expensive. This seemingly counter-intuitive observation was first made in 1963 by American sociologist David Caplovitz, in a book that continues to set the standard, The Poor Pay More . This is what is known as the “poverty penalty “.
This double penalty can take various forms: a poorer quality/price ratio; lack of access to certain products or services; too high a cost that makes certain goods or services inaccessible and effectively excludes low-income households from the market in question; etc.
Ronald Mendoza, of the United Nations Development Programme, also highlights another form of double punishment 221 the “catastrophic burden of expenditure. In some cases, such as healthcare, consumption of the good or service is a necessity. The poor may then find themselves faced with the impossible choice of not taking care of themselves, or having to resort to extreme strategies to one degree or another, such as going into debt to meet this “catastrophic” expense”””” “, closing their business,” 222 “pulling a child out of school,” 223 “etc.”
In France, a study by Action Tank Entreprise & Pauvreté and Banque Postale estimates that, in 2023, “the double annual penalty will amount to €745 for households in the 1st decile of the standard of living and €640 per year for households in the 2nd decile.” 224
The mechanisms that generate this double penalty include higher borrowing costs, linked to greater use of revolving credit.
Finally, we can cite the extreme example of the United States, where, in 2020, 16% of families with an annual income of less than $25,000 had no bank account. 225 This situation leads them to turn to alternative services, which generally charge much higher rates than banks. This example, given in 2007 by expert Michael S. Barr offers a good illustration of the additional costs caused by poverty: “a minimum-wage worker, working full-time, and earning less than $12,000 a year, would pay between $250 and $500 a year, just to collect his pay via a check-cashing service.” 226
Find out more
- Interview by Denis Colombi with Dan Israel on Médiapart, 2020
- Faire les comptes: normes comptables, normes sociales, Ana Perrin-Heredia, Genèses Sciences sociales et histoire, 2011
- How the Other Half Banks – Exclusion, Exploitation, and the Threat to Democracy, Mehrsa Baradaran, Harvard University Press, 2018
Equal opportunity would be the solution to inequality
Equal opportunity aims to “level the playing field” by giving everyone the same starting opportunities(see also Essentiel 8). Various types of public policy are based on this objective (scholarships, quotas, positive discrimination). After presenting the implementation methods and often mixed results of some of these policies in France and the United States, we’ll focus on the essentially competitive vision underlying the goal of equal opportunity.
Equal opportunity: the impossible role of French schools
The pursuit of equality of opportunity is an often-stated political priority. In France, this role is mainly played by schools.
The graph below shows that access to secondary education has undeniably increased over the last few decades.
Proportion of baccalaureate holders in a generation
Legend: dark blue represents the proportion of general baccalaureate holders; medium blue the proportion of technological baccalaureate holders; light blue the proportion of vocational baccalaureate holders.
Data for metropolitan France from 1851 to 2009; with overseas departments (excluding Mayotte) from 2001 to 2012.
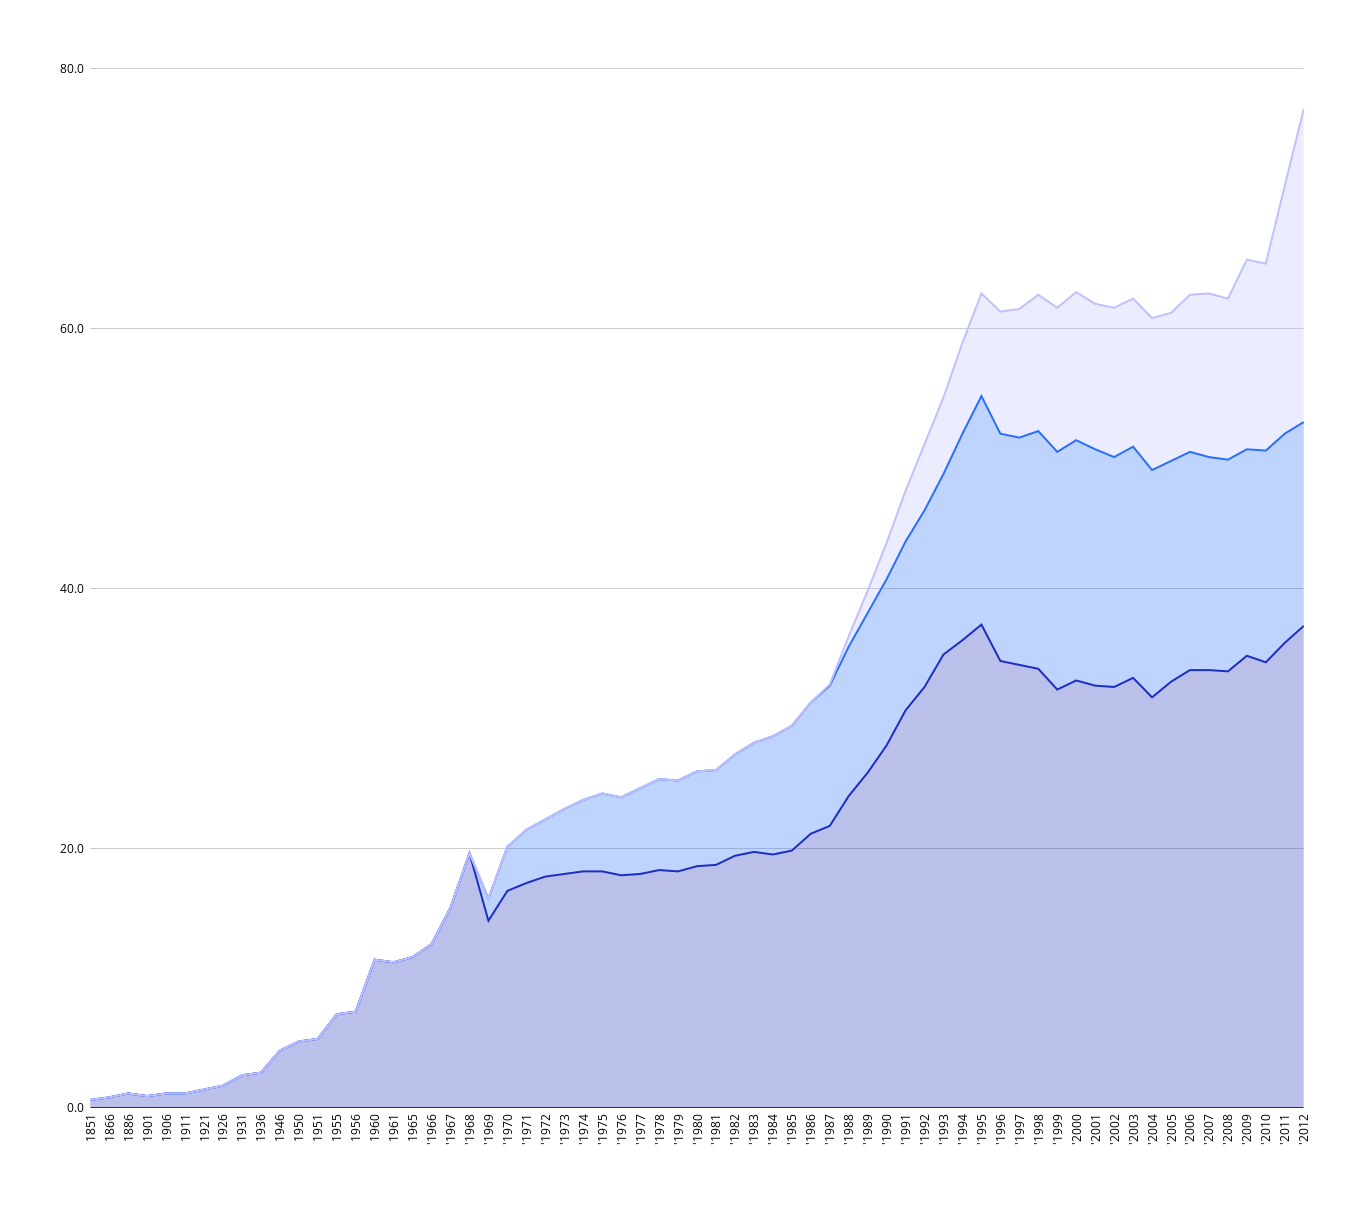
Source Direction de l’évaluation, de la prospective et de la performance
But while progress has been made, schools continue to reproduce social inequalities.
Thus, according to figures from the French Ministry of Education, in 2022 “among young people aged 20 to 24, 77% of the children of managers, intermediate professions or self-employed people will be studying or have studied in higher education, compared with 52% of the children of workers or employees (i.e. 1.5 times more).” Twenty-five years earlier, these figures were 62% and 33% respectively (a ratio of 1.9). 227
This progress has not been uniform: some fields of study in particular remain highly unequal. In engineering and business schools, the children of senior executives are 10 to 11 times more numerous than the children of blue-collar workers. 228 They even account for up to 70% of ENA and Polytechnique students. 229
Conversely, children from working-class backgrounds (blue-collar, white-collar and economically inactive) are over-represented in school failure statistics: they account for more than 80% of Segpa 230 pupils, even though they make up only half of the middle school population (see table below). They are also over-represented in the shorter, less prestigious technical streams.
Reading: 23% of middle school students are the children of blue-collar workers.
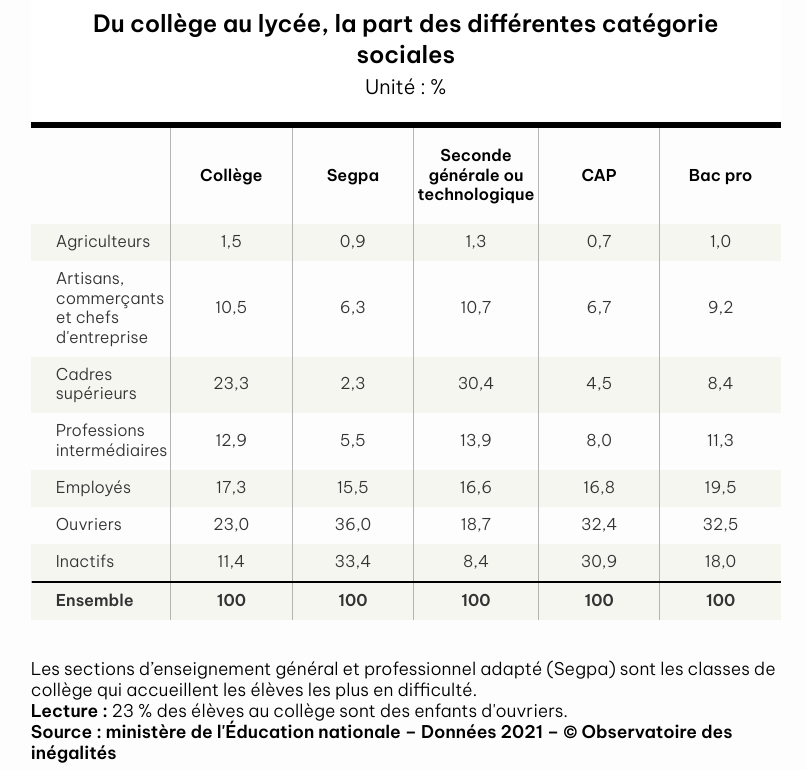
Source Les inégalités sociales, de l’école primaire à la fin du collège, Observatoire des inégalités, 2023 – based on data from the French Ministry of Education (2021).
At national level, priority education policies have been in place since 1981, with the aim of “contributing to equality of opportunity and combating social and territorial inequalities in terms of academic and educational success”, as recalled in the report of the information mission tasked with drawing up an overview and assessment of priority education, published in 2023.
According to the report, by 2021 the “cost ” of priority education is estimated at 2.3 billion euros”, or around 1.4% of the budget allocated to education in France(168.8 billion from elementary school to higher education).
The authors note that “this policy suffers from a lack of evaluation”. They note, moreover, that the Direction de l’évaluation de la prospective et de la performance “has established that among pupils enrolled at the start of the 2020 school year in a state school belonging to a priority education network (REP or REP +), 6.7% are one year behind in sixth form, compared with 3.7% of pupils from state schools outside these networks. […] Three quarters of middle-school students in REP + and 59.2% of those in REP have working-class or inactive parents, compared with 37.6% of students attending public middle-schools outside priority education.”
While these findings do not lead to the conclusion that priority education policies are totally ineffective, they do demonstrate – unsurprisingly – that in 40 years, they have failed to put an end to educational inequalities, which reflect other structural inequalities. On this subject, see our box on cultural, social and economic capital in Essentiel 1.
To think that providing an “equal” education would enable everyone to enter working life with the same assets, is to believe that education would suffice to erase all other structural inequalities (in wealth, gender, etc.).
Equal opportunities and positive discrimination
To offset systemic inequalities throughout the curriculum (mainly at school, but also in the workplace) and thus achieve a more equitable society, positive discrimination policies have been implemented in various countries, with varying results.
The Observatoire des inégalités defines positive discrimination as “the preferential treatment of certain categories of the population in order to improve equality of opportunity. It is thus considered that to establish real equality in practice, it is necessary to give an advantage to people who are disadvantaged to begin with”“.
Affirmative action policies in the United States
The United States is the best-known example, and probably the country where the scope of positive discrimination is the widest – and where the concept is the most debated.
Origins and evolution of affirmative action
In the 1960s, most Southern states had so-called “Jim Crow” laws, which established official segregation between blacks and whites. In the rest of the United States, de facto segregation existed in many areas of daily life (school, employment, housing, etc.).
It wasn’t until 1964 that the Civil Rights Act enshrined equal rights. 231 into law.
The first positive discrimination mechanisms were introduced in 1965 232 by decree 233 requiring companies involved in public works to adopt “affirmative action” procedures to ensure that job applicants and employees were not discriminated against. 234
The term affirmative action (also known asequal opportunity) gradually evolved to include quota policies, finally declared unconstitutional by the Supreme Court in 1978. 235 From the mid-1990s onwards, several states outlawed affirmative action practices (particularly in universities), either through legislation or court rulings, 236 until 2023, when a Supreme Court decision 237 severely restrictedaffirmative action policies in education throughout the country.
Affirmative action applies to sectors receiving money from the federal government: essentially education and public jobs (or subcontractors of public contracts). We will concentrate here on its effects on employment.
According to several studies, 238 affirmative action has increased the employment of African-Americans in companies subject toaffirmative action compared to those that were not, and that there is no conclusive evidence that the performance of people who have benefited from affirmative action policies is weaker. In 1990, economist Jonathan S. Leonard 239 notes that this evolution is more marked over the period 1974 – 1980, during which regulations were particularly enforced. A 2017 article 240 finds that the effects of affirmative action continue to influence employee demographics beyond the duration of the federal contract, suggesting that its impact is partially lasting.
Overall, these studies show that positive discrimination helps to improve equality of opportunity, provided that it is actually applied (control bodies) and that it is accompanied by appropriate recruitment and training policies. In this case, the effect is stronger for growing companies (which seems fairly intuitive, since new positions are opened up).
However, the effects of affirmative action on employment nationwide are limited, not least because it only applies to jobs dependent on federal funds. A 2013 estimate puts the number of jobs affected by affirmative action at a quarter of the US workforce. 241 Moreover, the inequalities they seek to address depend on the notion of justice adopted, a “moral” vision(see Essential 8), which partly explains the heated debates surroundingaffirmative action.
Positive discrimination in France
In France, the most frequently cited example of positive discrimination is the “priority education agreement” at Sciences-Po Paris, set up in 2001. Twenty years later, the famous school was congratulating itself on the success of this scheme 242 highlighting the fact that the proportion of grant-holders among those admitted had risen from 12% in 2006 to 25% in 2020.
However, the 170 students who entered Sciences-Po via this “unique equal opportunity scheme” should not overshadow the overall view of the prestigious grandes écoles. In 2021, the Institut des politiques publiques published a report entitled Quelle démocratisation des grandes écoles depuis le milieu des années 2000? The conclusion is unequivocal: “Despite the social outreach measures introduced by certain grandes écoles from the mid-2000s onwards, there has been very little change in their recruitment since 2006, whether in terms of the social and academic profile of their students, their geographical origin, or the distribution of girls and boys”“.
In other areas too, positive discrimination policies seem to be struggling to bear fruit: since 1987, companies with more than 20 employees have been obliged to employ 6% disabled people. In 2021, the employment rate for disabled people was only 3.5%. 243
In France, laws to break the glass ceiling of sexism
In recent years, France has also introduced positive discrimination mechanisms to break through the notorious “glass ceiling”.244
In 2011, the so-called Coppé-Zimmermann law imposed a 40% quota for women on the boards of directors and supervisory boards of public and listed companies. The law has been an unqualified success: by 2020, women accounted for 44.6% of board members in the CAC40 and 45.2% in the SBF120. 245
But in companies not covered by this obligation, progress has been slow, according to the French High Council for Equality between Women and Men (Haut Conseil pour l’Égalité entre les Femmes et les Hommes). 246 And “the expected trickle-down from governance bodies to management bodies has not really happened.” 247
In 2021, only 21% of SBF 120 companies had women on their executive and management committees. In fact, women continue to be victims of sexist discrimination 248 They may be less suited to positions of high responsibility because they are less available (because they look after children), they may be absent for long periods in the event of maternity, they may not be firm enough, or even emotional…
Other laws have therefore been passed in an attempt to achieve parity:
- In 2018, the so-called “Pénicaud Index” was created to measure equality in companies with over 50 employees. Unions and associations were quick to point out the flaws in the indicators on the one hand, and the possible circumvention techniques on the other. 249
- In 2021, the so-called Rixain law requires that by 2027, 30% of the total workforce 250 of women among “senior executives and members of management bodies”, and makes it compulsory to publish equality indexes.
Every year, the British magazine The Economist publishes its Glass Ceiling Index which measures progress in the “role and influence of women in the workplace” in some thirty countries. In 2023, France was ranked 6th.
The aim of positive discrimination policies is to combat prejudices that are so deeply rooted in society that they structure it. Such policies must therefore be assessed over the long term, and as the French High Council for Equality between Women and Men points out, 246 be monitored and adjusted in the light of actual changes in practices.
Limits of equal opportunity policies
Beyond the mixed results of the various policies outlined above, the equal opportunity approach – particularly at school – often carries with it a questionable ideology. Indeed, the underlying idea is that a society offering equal opportunities to all its citizens would not make inequalities disappear, but that they would be “fair”, since they would simply be the expression of individual merit(see Essentiel 8 and Received Idea 6).
“Basically, equal opportunity generates inequalities whose victims are not really victims at all, since they are accountable for their fate. In this sense, it’s liberal morality taken to its logical conclusion, the social equivalent of natural selection.”
As sociologist François Dubet points out, equality of opportunity reflects a competitive vision of life. But in this competition, the definition of “losers” and “winners” is based on revealing indicators: wealth, prestige, power. Not well-being or the value to society of each individual’s contributions. Thus, the CEO of a fast-fashion company, with substantial income and wealth, but whose activity has a disastrous impact on the planet and on workers, is a “winner”. A nurse earning just over the minimum wage 252 is a “loser”.
With these criteria, the losers are structurally far more numerous than the winners. And yet, being a winner “entitles” you to benefits that should be shared: access to quality education and healthcare, culture and leisure, and so on. It seems very difficult to want to build a society with a logic that devalues and disadvantages the vast majority of the population.
Finally, achieving real equality of opportunity – which would translate into equality of “capabilities” – presupposes the elimination of all forms of discrimination (racism, sexism, etc., but also access to culture, healthcare, etc.).
To conclude with François Dubet: “Equality of opportunity is undoubtedly more difficult to achieve than the progressive reduction of inequalities between social positions. For heavy sociological reasons, it is “easier” and fairer to improve the living and working conditions of the working classes than to promise everyone that they will rise in the social hierarchy.”
- Where do inequalities come from? by Jean-Paul Demoule, La Recherche, 2021. ↩︎
- A brief history of equality Thomas Piketty, Ed. Seuil, 2021. ↩︎
- Céline Guivarch, Nicolas Taconet, Inégalités mondiales et changement climatique, OFCE Review, 2020. ↩︎
- See for example Christophe Jaffrelot, Les inégalités en Inde et leurs implications politiques, Collège de France, 2011. ↩︎
- Punit Paranjpe, The multiple faces of inequality in India, The Conversation, (30/05/2022). ↩︎
- This is particularly true at university level. At the end of the 2010s, there was still an over-representation of people from historically dominant castes, and an under-representation of ex-untouchables, in scientific courses at various levels (bachelor’s, master’s, thesis). See : Ankur Paliwal, How India’s caste system limits diversity in science – in six charts. Nature, 2023. ↩︎
- “Married women had the status of minors in the same way as children”, gouvernement.fr, 2023. Accessed on 24/02/2024. ↩︎
- See for example Bernard Salvaing, Esclavage dans les colonies européennes, Encyclopédie d’Histoire Numérique de l’Europe. Accessed 09/03/2024. ↩︎
- See for example Erin Blakemore, Jim Crow laws created ‘slavery by another name’, National Geographic, 05/02/2020. ↩︎
- Amartya Sen, Equality of What? Tanner Lectures on Human Values, Stanford University, 1979. See also his book Development as Freedom Oxford University Press, 1999. ↩︎
- Emmanuelle Bénicourt, Amartya Sen: un bilan critique, Cahiers d’économie politique, 2007. ↩︎
- In 1990, together with the Pakistani economist Mahbub ul Haq, A. Sen proposed the Human Development Index (HDI), now internationally used to qualify a country’s level of development. To find out more about the HDI, see this article by the University of Geneva. See also work on the relational capability indicator, Gaël Giraud et. al, Relational Capability: A ↩︎
- Black women are a case in point. As pointed out by the United Nations Population Fund in the report Maternal Health Analysis of Women and Girls of African Descent in the Americas (2023), pregnant black women have severely degraded access to healthcare. The way in which inequalities “add up” has been the subject of much research, including that of Kimberlé Williams Crenshaw, who in 1989 developed the concept of “intersectionality” to describe this phenomenon. ↩︎
- See, for example, La répartition géographique des emplois publics en 2017, FIPECO, 2019. ↩︎
- Thomas Piketty, Capital and Ideology Ed. Seuil, 2019. ↩︎
- Angus Maddison, Shares of the Rich and the Rest in the World Economy: Income Divergence Between Nations, 1820-2030, Asian Economic Policy Review, Japan Center for Economic Research, 2008. ↩︎
- The extreme poverty line in 2024 is set at $2.15 per day per person (expressed in 2017 PPP). See our Infosheet How to measure poverty? ↩︎
- Poverty and Shared Prosperity 2022: Correcting Course, World Bank, 2023. ↩︎
- The Gini coefficient is a commonly used indicator for quantifying income inequality. Its value lies between 0 and 1: a value of 0 corresponds to “perfect equality” (each household receives the same fraction of income) and a value of 1 represents “perfect inequality” (the richest fraction of the population receives all income). To find out more, see our fact sheet: How do you measure monetary inequality? ↩︎
- For data, see : Poverty and Inequality Platform, World Bank. ↩︎
- For data, see : World Inequality Database. ↩︎
- Pierre-Noël Giraud, Inégalités, Pauvreté, Globalisation : les Faits et les Débats, CERISCOPE Pauvreté, 2012. ↩︎
- Branko Milanovic, The Three Eras of Global Inequality, 1820-2020, with the Focus on the Past Thirty Years, World Development, 2024. ↩︎
- World Food Security and Nutrition, Chapter 2 of The State of Food Security and Nutrition in the World 2023, Food and Agriculture Organization of the United Nations, 2023. ↩︎
- Pinelopi Koujianou Goldberg, Trade and Inequalities, The IFS Deaton Review, 2019. See also Essential 5 ↩︎
- By “Nobel” in economics is meant the Bank of Sweden Prize in Economic Sciences. SeePourquoile “Nobel d’économie” n’est pas un prix Nobel comme les autres – Les Décodeurs, Le Monde (09/10/2023). ↩︎
- Katelynn Harris, Michael D. McCall, The relative weakness in earnings of production workers in manufacturing, 1990-2018, U.S. Bureau of Labor Statistics, 2019. ↩︎
- Not least because of less protective labor laws. ↩︎
- Rachid Belkacem, Cathel Kornig, Le travail intérimaire: de ses origines à son institutionnalisation, 2012 (book chapter: Christophe Lavialle (dir.), Repenser le travail et ses régulations, 2012). ↩︎
- Inégalités d’emploi et de revenu : les années quatre-vingt-dix, Conseil supérieur de l’Emploi, des Revenus et des Coûts, 1996. ↩︎
- European Commission, Directorate-General for Employment, Social Affairs and Inclusion, Barcevičius, E., Gineikytė-Kanclerė, V., Klimavičiūtė, L., et al., Study to support the impact assessment of an EU initiative to improve the working conditions in platform work: final report, Publications Office of the European Union, 2021. ↩︎
- Thomas Philippon, Ariell Reshef, Wages and human capital in the US financial industry: 1909-2006, Quarterly Journal of Economics, 2012; Brian Bell, John Van Reenen, Bankers’ pay and extreme wage inequality in the UK, Center for Economic Performance, 2010; Working Rich: Salaires, bonus et appropriation des profits dans l’industrie financière, Olivier Godechot, La Découverte, 2007. ↩︎
- Davide Furceri, Prakash Loungani, Capital Account Liberalization and Inequality, IMF Working Papers, 2015; Barry Eichengreen et.al, The Liberalization of Capital Movements, Economic Papers 17, IMF, 1999. ↩︎
- The carbon footprint is broken down as follows: a country’s territorial emissions plus emissions from imports minus emissions from exports. To find out more, see our Counting greenhouse gas emissions fact sheet , part 4. ↩︎
- The carbon footprint is broken down as follows: a country’s territorial emissions plus emissions from imports minus emissions from exports. To find out more, see our Counting greenhouse gas emissions fact sheet , part 4. ↩︎
- It is of course possible to attribute GHG emissions to individuals on the basis of their savings. But this is not the approach adopted here: in the consumption approach, invested savings do generate emissions, but to produce goods, and it is the consumers of these goods who are charged with the emissions. To find out more about the importance of imputation conventions, see Counting GHG emissions – Part 5. ↩︎
- Antonin Pottier, et al, Who emits CO2? A critical overview of ecological inequalities in France, OFCE Review, 2020. ↩︎
- Deciles are values that divide the distribution of income (or other data, such as wealth) into ten parts of equal size. Thus, the first decile (generally noted as D1) designates the value below which 10% of income falls. The ninth decile (generally noted as D9) is the wage income value below which 90% of incomes fall. See our detailed definition in our How to measure monetary inequality sheet . ↩︎
- Déplacements domicile-travail : des émissions de gaz à effet de serre très variables selon les territoires, Insee Première nº1975 (07/12/2023). ↩︎
- A household’s standard of living, expressed in euros, corresponds to its disposable income divided by a number that depends on the size and profile of the household (the more individuals in the household, the higher the number). To find out more, see our fact sheet: How do you measure monetary inequality? ↩︎
- Deciles are values that divide the distribution of income (or other data, such as wealth) into ten parts of equal size. Thus, the first decile (generally noted as D1) designates the value below which 10% of income falls. The ninth decile (generally noted as D9) is the wage income value below which 90% of incomes fall. See our detailed definition in our How to measure monetary inequality sheet . ↩︎
- Carbon billionaires, Oxfam, 2022 ↩︎
- For more on neoliberalism, see David Cayla’s books, in particular Can the Left fight neoliberalism? Le Bord de l’Eau, 2024. ↩︎
- In Capital Rules. The Construction of Global Finance (2009), British economist Rawi Abdelal recounts how European (and French in particular) policymakers organized financial globalization in the 1980s. ↩︎
- See Jean-Yves Gerlitz, Rising In-work Poverty in Times of Activation: Changes in the Distributive Performance of Institutions over Three Decades, Germany 1984-2013, Social Indicators Research, 2017. ↩︎
- This is the optimum as defined by the economist Vilfredo Pareto (1848 – 1923): a situation is optimal when it is no longer possible to improve the position of one economic agent without worsening that of another. In other words, it’s a situation in which there are no remaining opportunities for mutually fruitful exchanges. This takes absolutely no account of distributional issues: a situation where agent A has 100% of the cake and agent B 0% is Pareto optimal. ↩︎
- André Barilari, The Laffer curve. Skillful storytelling or scientific truth?“, Public Management and Finance, 2019. ↩︎
- The tax base is the amount used to calculate the tax. For example, a household’s income tax base is the sum of taxable income and profits; for VAT, it is the sales price excluding tax (HT). The amount of tax due is obtained by multiplying the tax base by the tax rate (which may then be reduced by various tax exemptions or reductions known as tax niches). ↩︎
- Economic term for the change in one quantity in response to a small change in another. A price-demand elasticity of -10% for a product means, for example, that if the price of this product increases moderately – say by 5% – the demand for this product will be modified by -10% x 5% = -0.5% (a 0.5% drop in demand). ↩︎
- Peter Diamond, Emmanuel Saez, The Case for a Progressive Tax: From Basic Research to Policy Recommendations, Journal Of Economic Perspectives, 2011. ↩︎
- These are generally small countries: the low corporate tax rate is more than compensated for by the large number of multinationals transferring their profits there. Such a strategy is not feasible for a large country: the drop in tax revenues for all companies in the country cannot be offset by the transfer of profits by a few multinationals. ↩︎
- The tax base is the amount used to calculate the tax. For example, a household’s income tax base is the sum of taxable income and profits; for VAT, it is the sales price excluding tax (HT). The amount of tax due is obtained by multiplying the tax base by the tax rate (which may then be reduced by various tax exemptions or reductions known as tax niches). ↩︎
- Les Français, les actions et la crise, Le cercle de l’épargne, Mensuel N°81, January 2021. ↩︎
- While there is no official, universally-accepted definition of what constitutes a tax haven, we can adopt the four criteria adopted by the OECD: a zero or insignificant tax rate, legislative or administrative provisions preventing the exchange of tax information with other countries, a lack of transparency regarding the country’s tax practices, and finally a high tolerance for shell companies. See Harmful Tax Competition, OECD, 1998. ↩︎
- OECD: why the global agreement on tax evasion is historic, Challenges, 06/10/15 ↩︎
- These manipulations, described by Emmanuel Saez and Gabriel Zucman in The Triumph of Injustice (Seuil, 2020), consist, for example, in exchanging intangible assets (patents, logos, etc.) between the company’s various national subsidiaries, in the knowledge that it is very difficult for a tax authority to assign a value to these objects – especially if its valuation can be contested. ↩︎
- Facundo Alvaredo, Bertrand Garbinti, Thomas Piketty, On the Share of Inheritance in Aggregate Wealth: Europe and the USA, 1900-2010, Economica, 2017. ↩︎
- The tax base is the amount used to calculate the tax. For example, a household’s income tax base is the sum of taxable income and profits; for VAT, it is the sales price excluding tax (HT). The amount of tax due is obtained by multiplying the tax base by the tax rate (which may then be reduced by various tax exemptions or reductions known as tax niches). ↩︎
- Final report of the Comité d’évaluation des réformes de la fiscalité du capital, 2023 ↩︎
- In France, according to ViePublique.fr, “real estate accounts for 62% of household assets, followed by financial assets (21%) and professional assets (11%)”. ↩︎
- Which can differ significantly from nominal rates, since many countries have an abatement mechanism (no inheritance tax is levied below a certain inheritance value). ↩︎
- See for example: Droits de Succession : Comment font les autres, Alternatives Économiques (01/01/2011) ↩︎
- Diana Hourani, Bethany Millar-Powell, Sarah Perret and Antonia Ramm, The taxation of labor vs. capital income, OECD, 2023. ↩︎
- See The Triumph of Injustice: How the Rich Dodge Taxes and How to Make Them Pay – Online Appendix ↩︎
- To find out more about recent developments in international tax cooperation, see our fact sheet on tax evasion and tax havens. ↩︎
- Base Erosion and Profit Shifting ↩︎
- Declaration on a two-pillar solution to the tax challenges raised by the digitization of the economy. Adopted in July 2021, this declaration was supplemented by a detailed implementation plan in October. To find out more about this topic see our factsheet on tax havens part 3.3.3 ↩︎
- Find out more in section 2.3 of our factsheet on tax evasion and tax havens. ↩︎
- Suspension until 2026 of theUnder Tax Payment Rule, an essential pillar of the effectiveness of the global minimum tax; business-friendly calculation of tax credits; possibility for companies with a real business to deduct a certain amount of their profits from the minimum tax base. For further explanations, please refer to our fact sheet on tax evasion and tax havens, section 3.3.3. ↩︎
- See Global tax evasion report 2024, Chapter 3. ↩︎
- Christine Aumayr-Pintar, Minimum wages 2024 – The tide is turning, Eurofund, 2024. ↩︎
- This is also the case in Norway, which is not part of the EU. ↩︎
- Paula Hogéus, Ongoing strikes – Industrial actions on the Swedish labor market, EY, 2023. It should also be noted that the Scandinavian countries have a very strong tradition of negotiation, with a particularly high rate of unionization enabling regular wage negotiations. See for example Line Eldring, Kristin Alsos, European Minimum Wage: A Nordic Outlook, p 71-87, Fafo, 2012. ↩︎
- Living Wages, one of the United Nations Global Compact’s priority areas for action, United Nations Global Compact, 2024. Accessed on 23/08/2024. ↩︎
- Michelin implements a “living wage” for all its employees worldwide, Les Echos (17/04/2024). ↩︎
- To find out more about pay gaps and inequalities, see our module on business in the Anthropocene era. ↩︎
- Compulsory levies (on businesses and households alike) are all taxes, duties and social security contributions collected by public administrations (APU) without any direct and immediate counterpart. ↩︎
- Minima sociaux et prestations sociales – Ménages aux revenus modestes et redistribution – Édition 2020, Direction de la recherche, des études, de l’évaluation et des statistiques (Drees), 2020. ↩︎
- The Gini coefficient is a commonly used indicator for quantifying income inequality. Its value lies between 0 and 1: a value of 0 corresponds to “perfect equality” (each household receives the same fraction of income) and a value of 1 represents “perfect inequality” (the richest fraction of the population receives all income). To find out more, see our fact sheet: How do you measure monetary inequality? ↩︎
- The Gini coefficient is a commonly used indicator for quantifying income inequality. Its value lies between 0 and 1: a value of 0 corresponds to “perfect equality” (each household receives the same fraction of income) and a value of 1 represents “perfect inequality” (the richest fraction of the population receives all income). To find out more, see our fact sheet: How do you measure monetary inequality? ↩︎
- Thomas Piketty, Les inégalités dans le long terme, Conseil d’Analyse Économique, 2001 (report chapter Tony Atkinson, Michel Glaude, Lucile Olier, Thomas Piketty, Inégalités économiques, Conseil d’Analyse Économique, 2001 – see p. 137-205). ↩︎
- Matthew Fisher-Post, Amory Gethin, Government redistribution and development: A global perspective on taxes, transfers, and inequality, Centre for Economic Policy Research, 2023. ↩︎
- Pensions are also included in this broader notion of redistribution. ↩︎
- The inclusion of transfers in kind (health, education) raises important methodological questions. In the case of health expenditure, the study is based on reimbursement data provided by the Assurance Maladie, which enables us to estimate public health expenditure according to standard of living. Education expenditure is estimated on the basis of the average number of children per standard of living and according to the type of education (general high school, university, etc.). To find out more about the methods used by Insee, see : Courrier des statistiques N9 – 2023, Insee. ↩︎
- The Gini coefficient is a commonly used indicator for quantifying income inequality. Its value lies between 0 and 1: a value of 0 corresponds to “perfect equality” (each household receives the same fraction of income) and a value of 1 represents “perfect inequality” (the richest fraction of the population receives all income). To find out more, see our fact sheet: How do you measure monetary inequality? ↩︎
- Is VAT a fair tax?Les Comptes du CPO, Conseil des Prélèvements Obligatoires (Cours des Comptes), 2023. ↩︎
- This is a “regressive” tax, since everyone pays the same tax for a given product. In other words, VAT weighs (in relative terms) more heavily on the budgets of low-income households. ↩︎
- Courrier des statistiques N9 – 2023, Insee. ↩︎
- Le non-recours aux prestations sociales en France et en Europe, Direction de la recherche, des études, de l’évaluation et des statistiques (Drees), 2022. By way of example, 50% of people eligible for the “minimum old age pension” in France did not use it in 2016. ↩︎
- How much tax do billionaires pay?Institute for Public Policy (IPP), 2023. ↩︎
- A threshold effect occurs when a rise in income ultimately results in a fall in disposable income. This can be seen when a household’s income rises slightly, making it ineligible for certain social benefits. See Dominique Lefebvre, François Auvigne, Rapport sur la fiscalité des ménages, 2014. ↩︎
- De la crise covid au choc inflationniste : Une analyse macro/micro du pouvoir d’achat en France, Policy Brief, OFCE, 2024. See also Olivier Passet’s analysis on Xerfi: Pourquoi le sentiment de déclassement social s’accentue, 2024. ↩︎
- To find out more, see our Infosheet How to measure monetary inequalities? ↩︎
- See: Comment évolue la répartition de la richesse en France, Centre d’observation de la société, July 2022; and Début 2021, 92% des avoirs patrimoniaux sont détenus par la moitié des ménages, insee Focus, 2023 ↩︎
- Notes de l’Observatoire des inégalités no. 9, February 2023; and Data from the Observatoire des inégalités based on Crédit Suisse, September 2020. ↩︎
- INSEE study, L’impact du travail salarié des étudiants sur la réussite et la poursuite des études universitaires, Économie et Statistique n° 422, 2009 ↩︎
- INSEE study, Rising inequalities in access to property ownership among young households in France, 1973-2013, Economie et Statistique n°500-501-502, 2018 ↩︎
- Jennifer Sheehy-Skeffington and Jessica Rea, How poverty affects people’s decision-making processes, Joseph Rowntree Foundation report, February 2017 ↩︎
- Robert W. Fairlie and Harry A. Krashinsky, Liquidity constraints, household wealth, and entrepreneurship revisited, Review of Income and Wealth, 2012. ↩︎
- Deciles are values that divide the distribution of income (or other data, such as wealth) into ten parts of equal size. Thus, the first decile (generally noted as D1) designates the value below which 10% of income falls. The ninth decile (generally noted as D9) is the wage income value below which 90% of incomes fall. See our detailed definition in our How to measure monetary inequality sheet . ↩︎
- Guillermo Cruces, Ricardo Perez-Truglia and Martin Tetaz, Biased perceptions of income distribution and preferences for redistribution: Evidence from a survey experiment, Journal of Public Economics, 2013 ↩︎
- Louis Nadau, Bernard Arnault VS Lucy : la doyenne de l’humanité aurait dû travailler 10 millions d’années au Smic pour être aussi riche que le milliardaire, Marianne, Published on 05/12/2019 ↩︎
- See for example: Wealth, shown to scale (mkorostoff.github.io) ↩︎
- More precisely, our innate sense of numbers operates on a logarithmic, non-linear scale (see Véronique Izard et al: Véronique Izard et al. How numbers are distributed in space, Med Sci, 2008). Only education and the daily manipulation of familiar numbers can “rectify” this perception and switch to a linear representation for small numbers – but not for large ones (See: Tristan Roger, Patrick Roger, Alain Schatt, Behavioral bias in number processing: Evidence from analysts’ expectations, Journal of Economic Behavior & Organization, 2018). ↩︎
- Adrian Devitt-Lee, Hongyan Wang, Jie Li, Bruce Boghosian, A Nonstandard Description of Wealth Concentration in Large-Scale Economies, SIAM Journal on Applied Mathematics, 2018 ↩︎
- And, more broadly, philosophies of the struggle for existence; see, for example Nouvelle histoire des idées politiques Pascal Ory (ed.), Fayard, 1987 ↩︎
- Minima sociaux et prestations sociales – Low-income households and redistribution – Edition 2023, DREES ↩︎
- Les Français et la fiscalité sur la transmission de patrimoine, Opinionway-Les Échos survey, January 2022. See also Louis Maurin’s analysis L’impôt sur l’héritage est-il vraiment aussi impopulaire qu’on le dit? on inegalites.fr (27/10/2022). ↩︎
- CREDOC study, L’attachement à l’héritage: une illusion pour protéger ses enfants, Consommation & Modes de Vie N°CMV301, October 2018 ↩︎
- Press kit CNAF, La prévention et la lutte contre la fraude des Caisses d Séverine Burel, InfographieComparatifentre la fraude aux aides sociales et la fraude des entreprises, www.aide-sociale.fr, Updated February 22, 2024. Source: mission d’évaluation et de contrôle des lois de financement de la sécurité sociale sur la lutte contre la fraude sociale, chaired by Dominique Tian, 2011 ‘allocations familiales en 2021, juin 2022 ↩︎
- See, for example, this Alternatives Économiques article Comment la TVA freine les effets de la redistribution on a study published in 2021 by Julien Blasco, Elvire Guillaud and Michaël Zemmour. ↩︎
- At least, that’s the theory. In fact, the data show that the 0.1% of households with the highest incomes pay proportionately less.See for example Les ultrariches contribuent moins à l’impôt, confirme une nouvelle étude, Le Monde (06/06/2023) and See l’Essentiel 5 and l’Essentiel 6 on taxation and redistribution. ↩︎
- For an overview of the lexicon of taxation – and progressive taxation in particular – see Thomas Piketty’s lexicon on the Pour une Révolution Fiscale website, associated with his book of the same name. ↩︎
- John Rawls considers monetary inequalities to be generally unjust except in certain special cases: for example, moderate monetary inequalities can be just as long as they encourage the richest to increase the collective wealth – which can lead, according to him, to investment and redistribution – see his book Theory of Justice Harvard University Press, 1971 ↩︎
- Andrew C. Wicks, Patricia H. Werhane, Heather Elms, John Nolan, Spheres of Influence: A Walzerian Approach to Business Ethics, J Bus Ethics, 2021 ↩︎
- The notion of effort here is simplistic compared to Roemer’s work. Instead, he uses the term “degree of effort” (in Equalities of Opportunity, Harvard University Press, 1998), and later refines this concept to “inter-type-comparable effort measure” (2003). For further details, see in particular John Roemer et al, To what extent do fiscal regimes equalize opportunities for income acquisition among citizens?, Journal of Public Economics, 2003 ↩︎
- See the following article for more information on his vision of markets: John Roemer, The Morality and Efficiency of Market Socialism, Ethics, 1992. ↩︎
- The question of access to long studies / opening the way to well-paid professions is an area of inequality, see Essentiel 1 and Idée reçue 8. ↩︎
- Sorapop Kiatpongsan and Michael I. Norton, How Much (More) Should CEOs Make? A Universal Desire for More Equal Pay, Perspectives on Psychological Science, 2014 ↩︎
- With ratios ranging from 2:1 in Denmark to 20:1 in Taiwan. The ideal ratio between the lowest salaries and the minister’s salary ranged from 2 (in Norway) to 10 (in South Africa). ↩︎
- Corporate Sustainability Accounting: What Can And Should Corporations Be Doing?UNRISD, 2020 ↩︎
- Gaël Giraud, Cécile Renouard, Le facteur 12 : Pourquoi il faut plafonner les revenus, Carnets Nord / Éditions Montparnasse, 2012. See the summary published by Martial Dupaigne in the Revue d’Études en Agriculture et Environnement. ↩︎
- Pay inequality: big companies, big gaps. Oxfam France and Basic, April 20 ↩︎
- For more on the neoclassical school of economics, see for example: Lara Boerger, Neoclassical Economics, Exploring Economics, 2016 ↩︎
- See for example this interview with sociologist Dominique Méda, 20 minutes, March 27, 2020 ↩︎
- An OECD working paper Including unpaid household activities (2018) estimated that for France, this “work” would represent between 10% and 50% of GDP, depending on the method used to estimate its “value”. These tasks fall disproportionately on women ↩︎
- James K. Boyce, Inequality as a cause of environmental degradation, Ecological Economics, 1994 ↩︎
- Global Resources Outlook 2024: Bend the Trend – Pathways to a liveable planet as resource use spikes, United Nations Environment Programme, 2024 ↩︎
- The term “resource curse” was introduced by British economist Richard Auty in the 1990s. See for example: Pourquoi parle-t-on de la “malédiction des ressources”, Radio France, 2022 ↩︎
- Shi Wang, Wen Zhang, Hua Wang, Jue Wang, and Mu-Jun Jiang, How Does Income Inequality Influence Environmental Regulation in the Context of Corruption? A Panel Threshold Analysis Based on Chinese Provincial Data, Int J Environ Res Public Health, 2021 ↩︎
- Income Inequality Trends in Sub-Saharan Africa: Divergence, Determinants and Consequences, United Nations Development Program (UNDP), 2017 ↩︎
- Understanding the new ecological divide: unpublished data, Le Grand Continent (07/11/2023) ↩︎
- Jean Gadrey, Which countries are the most and least unequal, Alternatives Economiques (Blog), 2015 ↩︎
- The Gini coefficient is a commonly used indicator for quantifying income inequality. Its value lies between 0 and 1: a value of 0 corresponds to “perfect equality” (each household receives the same fraction of income) and a value of 1 represents “perfect inequality” (the richest fraction of the population receives all income). To find out more, see our fact sheet: How do you measure monetary inequality? ↩︎
- World Bank, Poverty and Inequality Platform. Accessed on: 22/08/2024 ↩︎
- Brazil: extreme inequality in numbers, Oxfam. Link consulted on 24/02/2024 ↩︎
- Roberto Briceño-León, Andrés Villaveces, Alberto Concha-Eastman, Understanding the uneven distribution of the incidence of homicide in Latin America, International Journal of Epidemiology, 2008 ; Peter Imbusch, Michel Misse, Fernando Carrión, Violence research in Latin America and the Caribbean: A literature review, International Journal of Conflict and Violence, 2011 ; Daniel R. C. Cerqueira, Causas e consequências do crime no Brasil, BNDES, 2014 ↩︎
- See also a more recent work by these two authors: Kate Pickett, Richard Wilkinson, Pour vivre heureux, vivons égaux, Les liens qui libèrent, 2020 ↩︎
- See Karen Poingson, Does Income Inequality Cause Health and Social Problems, Tresseph Rowntree Foundation, 2011 ↩︎
- The Way We Live Now, The Guardian (14/03/2009) ↩︎
- Jan-Emmanuel De Neve, Nattavudh (Nick) Powdthavee, Income Inequality Makes Whole Countries Less Happy, Harvard Business Review, 2016 ↩︎
- See, for example, La répartition géographique des emplois publics en 2017, FIPECO, 2019. ↩︎
- Erzo F. P. Luttmer, Neighbors as Negatives: Relative Earnings and Well-Being, The Quarterly Journal of Economics, 2005 ↩︎
- Simone M. Schneider, Why Income Inequality Is Dissatisfying-Perceptions of Social Status and the Inequality-Satisfaction Link in Europe, European Sociological Review, 201 ↩︎
- Regional Economic Outlook: Sub-Saharan Africa, IMF, 2021 ↩︎
- Hunger in a warming world, Oxfam, 2022 ↩︎
- This term covers the damage caused by the observed impacts of climate change and future risks. This damage may be economic or non-economic ↩︎
- Adelle Thomas, Loss and damage: A moral imperative to act, United Nations website, 2022 ↩︎
- Child Poverty, Unicef, page consulted on April 19, 2024 ↩︎
- Bramka Arga Jafino, Brian Walsh. Julie Rozenberg, Stephane Hallegatte, Revised Estimates of the Impact of Climate Change on Extreme Poverty by 2030, Working Paper World Bank, 2020 ↩︎
- Climate change in developing countries: effects of global warming, transmission mechanisms and adaptation policies, Banque de France Working Paper No. 822, 2021 ↩︎
- Noah S. Diffenbaugh and Marshall Burke, Global warming has increased global economic inequality, Proceedings of the National Academy of Sciences, 2019 ↩︎
- Mr. Serhan Cevik and João Tovar Jalles For Whom the Bell Tolls: Climate Change and Inequality, IMF, 2022 ↩︎
- Climate change and social vulnerability in the United States, EPA, 2021 ↩︎
- See for example this article from Scientific American: Flooding Disproportionately Harms Black Neighborhoods (02/06/2020) ↩︎
- Read the investigation Black communities are last in line for disaster planning in Texas, Washington Post (05/12/2022). Countless articles and surveys have also shown that systemic racial and class discrimination played a major role in the populations affected by Katrina. ↩︎
- Harris Interactive and Toluna study for Agence nationale de la rénovation urbaine (Anru) Les Français dans leur quartier 2022 ( The French in their 2022 neighborhoods ) ↩︎
- QPVs are defined according to a gap in residents’ income compared with the average n See Brodie Ramin and Tomislav Svoboda, Health of the Homeless and Climate Change, J Urban Health, 2009, and Faced with global warming, the homeless are on the front line, Usbek&Rica (12/10/2022) ational and compared with the conurbation. See decree 2014-767 for precise criteria. ↩︎
- Fuel poverty: being cold or spending too much on heating, Insee Première, 2011 ↩︎
- See Brodie Ramin and Tomislav Svoboda, Health of the Homeless and Climate Change, J Urban Health, 2009, and Face au réchauffement climatique, les SDF sont en première ligne, Usbek&Rica (12/10/2022) ↩︎
- Baysa Naran, Jake Connolly, Paul Rosane, Dharshan Wignarajah, Githungo Wakaba and Barbara Buchner, Global Landscape of Climate Finance: A Decade of Data, Climate Policy Initiative, 2022 ↩︎
- Climate change is already making parts of America uninsurable, Vox.com, 12/07/2023 ↩︎
- Nicki Hutley et al. Uninsurable Nation: Australia’s Most Climate-Vulnerable Places, Climate Council, 2022 ↩︎
- Faced with the climate crisis, part of France is already uninsurable, Novethic (15/01/2024) ↩︎
- A world at risk: Closing the insurance gap, Lloyds, 2018 ↩︎
- Closing Climate and Disaster Data Gaps: New challenges, new thinking, United Nations Office for Disaster Risk Reduction, 2023 ↩︎
- See our fact sheet on the notion of cost ↩︎
- See, for example, this article: The Residents of This Louisiana Island Are America’s First “Climate Refugees”, Smithsonian Magazine (06/29/2016) ↩︎
- Environmental inequalities, EEA website, 2024 and report Unequal exposure and unequal impacts: social vulnerability to air pollution, noise and extreme temperatures in Europe, 2018 ↩︎
- Children and digital dumpsites: e-waste exposure and child health, WHO, 2021 ↩︎
- The Global E-waste Monitor 2020: quantities, flows and the circular economy potential, United Nations Institute for training and research, 2020 ↩︎
- In 1989, the International Labour Organization’s Convention 169 on Indigenous and Tribal Peoples already established similar rights, but it has only been ratified by 24 countries. The list of countries that have ratified Convention 169 is available on theInternational Labour Organization website. ↩︎
- Indigenous efforts to save Peru’s Marañon River could spell trouble for big oil, Mong Eric Maskin, Globalization Is Increasing Inequality, World Bank, 2014 abay (17/04/2024) ↩︎
- See the following interview with François Bourguignon, Dans le monde, ” une baisse des inégalités depuis 20 ans “, Observatoire des Inégalités, 2022 ↩︎
- Pascal Saint-Amans, Paradis fiscaux : Comment on a changé le cours de l’histoire, Éd. Seuil, 2023. See also Tax havens: definition and list of countries, Oxfam France. Accessed on: 24/02/2024 ↩︎
- Since this theory is not a theory, there is no definition of the segment of the population that is supposed to generate this trickle-down (the top 1% of income earners? the top 10% of wealth earners?). ↩︎
- Remember that GDP is not a measure of a country’s social well-being (see our module on GDP and planetary limits, and our proposal toadopt alternative indicators to GDP). ↩︎
- Through taxes and duties. Here we find the assertion that ‘too much tax kills tax’, which assumes that a low tax rate yields more than a high rate, which would scare away the most important taxpayers, modelled in the ‘Laffer curve’ and not verified in practice. See our article our trickle down economics ↩︎
- Causes and Consequences of Income Inequality: A Global Perspective, IMF, 2015 ↩︎
- In France, in 2017, the 20% of households with the lowest incomes spent almost all their income, while the 20% with the highest incomes saved almost 30%. Source : Plus d’épargne chez les plus aisés, plus de dépenses contraintes chez les plus modestes, Insee Première nº1815, 2020 ↩︎
- David Hope, Julian Limberg, The Economic Consequences of Major Tax Cuts for the Rich, Socio-Economic Review, 2020 –(Working paper available here) ↩︎
- Thomas Piketty, Emmanuel Saez, and Stefanie Stantcheva, Optimal Taxation of Top Labor Incomes: A Tale of Three Elasticities, American Economic Journal, 2014 ↩︎
- Simon Kuznets, Economic Growth and Income Inequality, American Economic Review, 1955. ↩︎
- Hervé Fayat, “III / Les inégalités en configurations”, Socio-histoire des inégalités, La Découverte, 2022 ↩︎
- Wouter Ryckbosch, Economic inequality and growth before the industrial revolution: the case of the Low Countries (fourteenth to nineteenth centuries), European Review of Economic History, 2016 ↩︎
- Thomas Piketty, The Kuznets’ curve, yesterday and tomorrow, Understanding poverty, Oxford university press, 2005 ↩︎
- Very low-income countries” are the 24 poorest countries in the world, according to OECD data. ↩︎
- Orsetta Causa, Alain de Serres, N. Ruiz, Growth and inequality: A close relationship?, OECD Web Archive, 2014. Link consulted on 24/02/2024 ↩︎
- Juliana Menasce Horowitz, Ruth Igelnik, Rakesh Kochhar, Trends in income and wealth inequality, Pew research center, 2020. Link consulted 08/03/2024 ↩︎
- Average standard of living by decile, Annual data from 1996 to 2022, Insee ↩︎
- Income, standard of living and poverty in 2019, Insee Résultats, 2021 (Figure 1b) ↩︎
- Mikkel Hermansen, Nicolas Ruiz, Orsetta Causa, The distribution of the growth dividends, OECD Economics Department Working Papers, 2016 ↩︎
- Oresetta Causa, Alain de Serres, Nicolas Ruiz, Can Pro-growth Policies Lift all Boats?: An Analysis Based on Household Disposable Income, OECD Economics Department Working Papers, 2015 ↩︎
- Focus – Inequality and growth, OECD, 2014 ↩︎
- Agnar Sandmo, The Principal Problem in Political Economy: Income Distribution in the History of Economic Thought, Norwegian School of Economics, 2013 ↩︎
- Francesco Saraceno, Does Inequality Harm Economic Performance, OFCE LE BLOG, 2012 ↩︎
- John Rawls, Theory of Justice Harvard University Press, 1971 ↩︎
- Les Econoclastes, Petit bréviaire des idées reçues en économie, La Découverte, 2004 ↩︎
- Doing your bit?Carbone 4, 2019. NB: Alain Grandjean, founder and chairman of The Other Economy, is also a founding partner of Carbone 4. ↩︎
- Relying on the rich to reduce our greenhouse gas emissions will not be enough, article by Alain Grandjean, Simon Yaspo, Antonin Pottier, Le Monde, 2022 ↩︎
- Net zero”, also known as carbon neutrality, is the balance between anthropogenic emissions of greenhouse gases on the one hand, and their absorption by “carbon sinks” on the other. ↩︎
- Born a slave in 1818, Frederick Douglass rebelled, moved to the northern United States and became an activist and lecturer in the abolitionist movement. After the Civil War, he held positions of responsibility in government and prestigious institutions. To find out more about Frederick Douglass, visit Wikipedia or the Frederick Douglass National Historical Park in Washington DC. ↩︎
- Frederick Douglass then describes what he considers to be self-made men: men who have succeeded in life, without having benefited from privileges at birth, well-placed connections or a good education. He analyzes the arguments generally given at the time to explain these trajectories: intellectual superiority, luck, and effort. It is this last factor to which he attaches the most importance, and which leads him to call for equal rights and opportunities for blacks. ↩︎
- See the original on the Carlisle Indian Industrial School website, where Douglass gave this speech. ↩︎
- “Success” otherwise relative, as several media outlets have revealed. Read, for example, As a Businessman, Trump Was the Biggest Loser of All, The New Yorker, (08/05/2019) ↩︎
- See, for example, Trump Engaged in Suspect Tax Schemes as He Reaped Riches From His Father, New York Times (02/10/2018). The three journalists were awarded the 2019 Pulitzer Prize for their investigations into Trump’s tax manipulations. ↩︎
- It should be noted here that migratory ancestry is defined as “having at least one foreign-born parent in ↩︎
- Note d’analyse Inégalité des chances : ce qui compte le plus, France Stratégie, 2023. Please note that, as is often the case in French statistical studies, the population of DROM-COM is excluded. ↩︎
- Repenser l’héritage, Les notes du Conseil d’Analyse Économique, 2021 ↩︎
- Deciles are values that divide the distribution of income (or other data, such as wealth) into ten parts of equal size. Thus, the first decile (generally noted as D1) designates the value below which 10% of income falls. The ninth decile (generally noted as D9) is the wage income value below which 90% of incomes fall. See our detailed definition in our How to measure monetary inequality sheet . ↩︎
- Anandi Mani, Sendhil Mullainathan, Eldar Shafir, Jiaying Zhao, Poverty Impedes Cognitive Function, Science, 2013. Read also the Princeton press release describing the study. ↩︎
- Anuj K. Shah, Eldar Shafir, Sendhil Mullainathan, Scarcity Frames Value, Psychological Science, 2015 ↩︎
- Cash transfers: what does the evidence say? ODI, 2016 ↩︎
- Fábio Veras Soares, Rafael Perez Ribas, Rafael Guerreiro Osório, Evaluating the impact of Brazil’s Bolsa Familia – Cash Transfer programs in comparative perspective, Cambridge University Press, 2010. ↩︎
- Dennis Egger, Johannes Haushofer, Edward Miguel, Paul Niehaus, Michael Walker, General Equilibrium Effects of Cash Transfers: Experimental Evidence from Kenya, Econometrica, 2022 ↩︎
- Où va l’argent des pauvres, Denis Colombi, ed. Payot, 2020. ↩︎
- “Les ménages pauvres gèrent leur argent avec beaucoup de rigueur”, interview published in Alternatives Économiques, 2020 ↩︎
- Merry Christmas (means-tested), Denis Colombi, post published on his blog Une heure de peine, in 2015 ↩︎
- Savings inequalities fuel wealth inequalities, Observatoire des Inégalités, 2022 ↩︎
- In 2017, according to LocService.fr’s Observatoire de l’offre et de la demande locatives dans le parc privé, the average rent in France was €631 per month, including charges. Of course, this figure masks considerable disparities. In Paris, for example, the average rent was €1054/month. ↩︎
- Ronald U. Mendoza, Why Do The Poor Pay More? Exploring The Poverty Penalty Concept, Journal of international development, 2008 ↩︎
- This may seem counter-intuitive, but it’s easily explained: take the example of a tuk-tuk driver. In order to meet a large unforeseen expense (a family health bill, for example), he may have to sell his work tool. See for example Michael H. Morris The Liability of Poverty: Why the Playing Field is Not Level for Poverty Entrepreneurs, Poverty & Public policy, 2020. ↩︎
- A phenomenon that particularly affects girls. See, for example, this article by Alessia Mortara, Primrose Adjepong, Onyinye Oguntoye Want to get girls to school in sub-Saharan Africa? Tackle poverty on the J-Pal website, 2022. ↩︎
- 3rd edition of the study of the double poverty penalty in France 2023, Action Tank Entreprise & Pauvreté and la Banque Postale, 2024 ↩︎
- Economic Well-Being of U.S. Households in 2020, Federal Reserve, 2021 ↩︎
- Michael S. Barr An Inclusive, Progressive National Savings and Financial Services Policy, Harvard Law & Policy Review, 2007 ↩︎
- État de l’Enseignement supérieur, de la Recherche et de l’Innovation en France n°17, Ministry of Higher Education and Research, 2024 ↩︎
- Les milieux populaires largement sous-représentés dans l’enseignement supérieur, Observatoire des inégalités, 2021 (data 2019-20) ↩︎
- Des classes préparatoires et des grandes écoles toujours aussi fermées, Observatoire des inégalités, 2021 ↩︎
- Segpa classes (for “Section d’enseignement général et professionnel adapté”) are designed for students in grades 6 to 3e with significant academic difficulties. Source: French Ministry of Education. ↩︎
- As we explained in Essentiel 1, equality under the law does not guarantee real equality or fairness in treatment and access to rights. ↩︎
- A 1961 decree signed by John F. Kennedy already included the term “affirmative action”, but its scope was extremely limited. ↩︎
- The Executive Order 11246, signed by Lyndon B. Johnson ↩︎
- This decree has been amended several times since, notably in 1967 to add “sex” to the list of characteristics that must not be discriminated against. ↩︎
- It was the Regents of the University of California v. Bakke decision that confirmed the legality of affirmative action but invalidated quotas, as ‘race’ could be one of the selection factors, but not the only one. ↩︎
- Because of the way powers are organized in the United States, affirmative action has largely been defined, limited or reinforced by judges. ↩︎
- Students For Fair Admissions, Inc. V. President And Fellows Of Harvard College, June 29, 2023 ↩︎
- See Harry J. Holzer, The economic impact of affirmative action in the US, Swedish Economic Policy Review, 2007. ↩︎
- Jonathan S. Leonard, The Impact of Affirmative Action Regulation and Equal Employment Law on Black Employment, Journal of Economic Perspectives, 1990 ↩︎
- Conrad Miller, The Persistent Effect of Temporary Affirmative Action, American Economic Journal: Applied Economics, 2017 ↩︎
- See Conrad Miller, The Persistent Effect of Temporary Affirmative Action, American Economic Journal: Applied Economics, 2017. ↩︎
- Conventions éducation prioritaire : Sciences Po reinforces its system, article dated 22/06/2022 on the Sciences Po website ↩︎
- Source : Vie Publique ↩︎
- The term “glass-ceiling” first appeared in the USA in the 70s and 80s, and embodies the invisible but very real barriers that prevent women from gaining access to the most important positions in terms of responsibility, power and salary. ↩︎
- SBF: Société des bourses françaises, a stock market index comprising the 120 largest French market capitalizations. ↩︎
- Rapport 10 ans de la loi COPE-ZIMMERMANN 2011-2021, HCE, 2021 ↩︎
- Management bodies are generally executive committees and management boards, which the Haut Conseil pour l’Égalité entre les Femmes et les Hommes (High Council for Equality between Women and Men) report describes as “real places of power within companies”, although boards of directors and supervisory boards are also important places of power and decision-making. ↩︎
- See for example Vanessa Di Paola and Dominique Epiphane, L’accès des femmes au top management, Socio-économie du travail, 2021; as well as the work of economist Dominique Meurs, for example this review of her book Les Entreprises et l’égalité femmes-hommes in Le Monde (19/12/2023). ↩︎
- See, for example, the inter-union letter sent to the Minister at the time of the presentation of the law’s application decree (2018). See also Oxfam France’s Gender Equality Report 2023. ↩︎
- This ratio is set to rise to 40% by 2030. ↩︎
- Rapport 10 ans de la loi COPE-ZIMMERMANN 2011-2021, HCE, 2021 ↩︎
- According to the national union of nursing professionals, “a nurse starts at 1,500 euros net (without weekend and night bonuses), i.e. 1.2 times the SMIC”: Grilles salaires infirmiers à l’hôpital en 2021, SNPI website. ↩︎