
This text has been translated by a machine and has not been reviewed by a human yet. Apologies for any errors or approximations – do not hesitate to send us a message if you spot some!
Introduction
” It will soon be too late “. This ” cry of alarm from 15,000 scientists to save the planet ” was on the front page of the Le Monde edition at the end of 2017 1. The ecological crisis is nothing new. In 1972, the report The Limits to Growth ” commissioned by the Club of Rome, concluded that infinite economic growth was impossible in a world of limited natural resources and increasing pollution. Since then, there have been numerous reports warning of the state of the planet, as well as last-chance summits.
At issue is the economic development model born in Europe at the end of the 18th century. At the input end of the system, we consume ever more natural resources, and at the output end we produce ever more waste and pollution, all of which generates global imbalances such as climate disruption, the collapse of biodiversity and a rise in the general toxicity level of our planet.
In less than 200 years, humanity has become a geological force capable of profoundly transforming living conditions on Earth. That’s why some scientists, following in the footsteps of Nobel laureate Paul Crutzen, are proposing to identify a new geological era and call it the Anthropocene2.
In this module, you will find information to help you understand :
- the dual dimension of the ecological crisis: global imbalances and the increasing scarcity of resources;
- the absence of any real consideration of ecological issues by the majority of the economic discpline;
- preconceived ideas: both those that deny the existence of environmental damage and those that bet on an autonomous regulation of our economic model to resolve the ecological crisis: the dematerialization of the economy, economic development that reduces pollution, technological progress that saves the day.
The essentials
Climate, biodiversity: many global imbalances at work
All these imbalances have already been studied and explained in numerous reports, books, articles and videos. So we’re only giving you a brief overview here, as well as a few ideas on how to go further.
Some elements common to global imbalances
- Their consequences for human living conditions are serious. The natural imbalances at work increase and amplify destructive and deadly natural events (floods, landslides, fires, etc.), deteriorate access to vital resources and services such as drinking water, food and air quality, and render uninhabitable regions that are now populated (desertification, rising sea levels). Competition for dwindling resources and migration (within and between countries) are sources of social destabilization and conflict.
- Global analyses must be complemented by local analyses. While the causes of climate disruption are global, the consequences are unevenly distributed, and are more marked in today’s poorest areas, which also have less capacity to adapt. The challenges of biodiversity erosion, air and water pollution vary according to their location: reasoning about these impacts on average at global level sometimes makes no sense at all.
- These are dynamic phenomena taking place over a wide range of time scales, and can be highly inertial. A forest takes 300 years to mature, while a fish stock can be replenished in 15 years. Because of the inertia of the climate system, global warming would continue for decades if we stopped emitting greenhouse gases today. Rising sea levels, on the other hand, have a much longer inertia, and will continue for thousands of years.
- The multiple manifestations of the ecological crisis are linked and interdependent. Each crisis feeds and aggravates the others. For example, forests play a key role in filtering water and storing it in the soil. Deforestation therefore degrades water availability and quality. Forests mitigate climate change (through their capacity to store carbon). The latter exacerbates deforestation, which in turn increases global warming. Resilience to the consequences of each crisis also depends on the others: deforestation and soil erosion greatly aggravate the consequences of intense rainfall, resulting in major floods or deadly mudslides.
- The effects are not progressive and linear: there are tipping points, thresholds which, once crossed, trigger a runaway effect. A process is said to have a “threshold effect” when there is a certain level of disturbance (called a threshold, or tipping point) below which the consequence is proportional to the disturbance, and beyond which things start to evolve in a totally different way. Our climate is full of such processes: the cessation of ocean currents, the maximum temperature that corals can withstand, or the maximum temperature rise that Greenland can withstand without melting. 3. In the same way, biodiversity balances are complex, and relatively greater pressure can lead to a sudden collapse in a species’ population.
Climate change and its many repercussions
Since the start of the industrial revolution, the planet’s climate has been warming.
Today, there is no longer any debate on this point, as physical evidence abounds. Visit sixth report of IPCC Group 1 4 published in 2021, highlights a rise in average global surface temperature of around 1.1°C between 1850 and 2020; a 20 cm rise in average sea level since 1901; a 40% reduction in Arctic sea ice since 1979; a global retreat of continental glaciers since the 1990s; destabilization of polar ice caps; an increase in the frequency of heat waves in Europe, Asia and Australia; disruption of the precipitation system, etc.
Global surface temperature trends
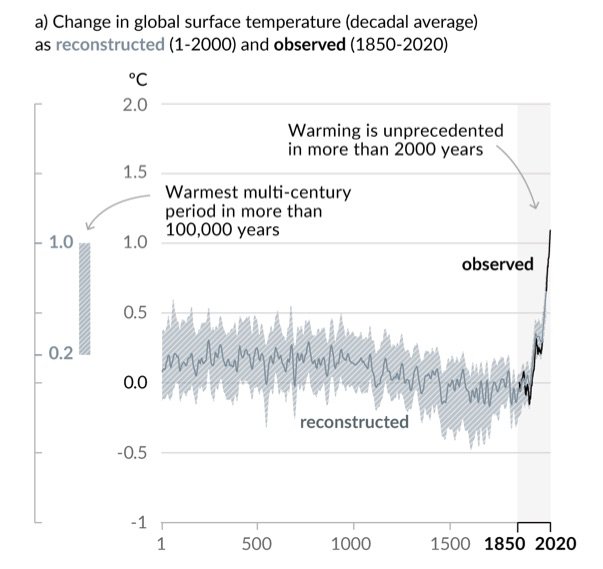
Source Climate Change 2021 – The physical science Basis – Summary for decision-makers of the IPCC Working Group 1 report (Figure SPM1)
Average global surface temperature in the 2010 decade was 1.1°C higher than in the 1850-1900 period.
It should be noted that these are average global changes for the planet as a whole. In reality, temperature changes, rising sea levels and changes in precipitation patterns are obviously different from one region of the globe to another.
Temperature rises vary from one region of the globe to another.
Climatologist Ed Hawkins has devised a graph in which the stripes running from blue (the coldest) to red make it easy to visualize the evolution of temperatures from the end of the 19th century to the present day at the level of the planet, a region or a country. The following graphs illustrate the reality of global warming, and in particular the fact that it is much more pronounced in the Arctic.
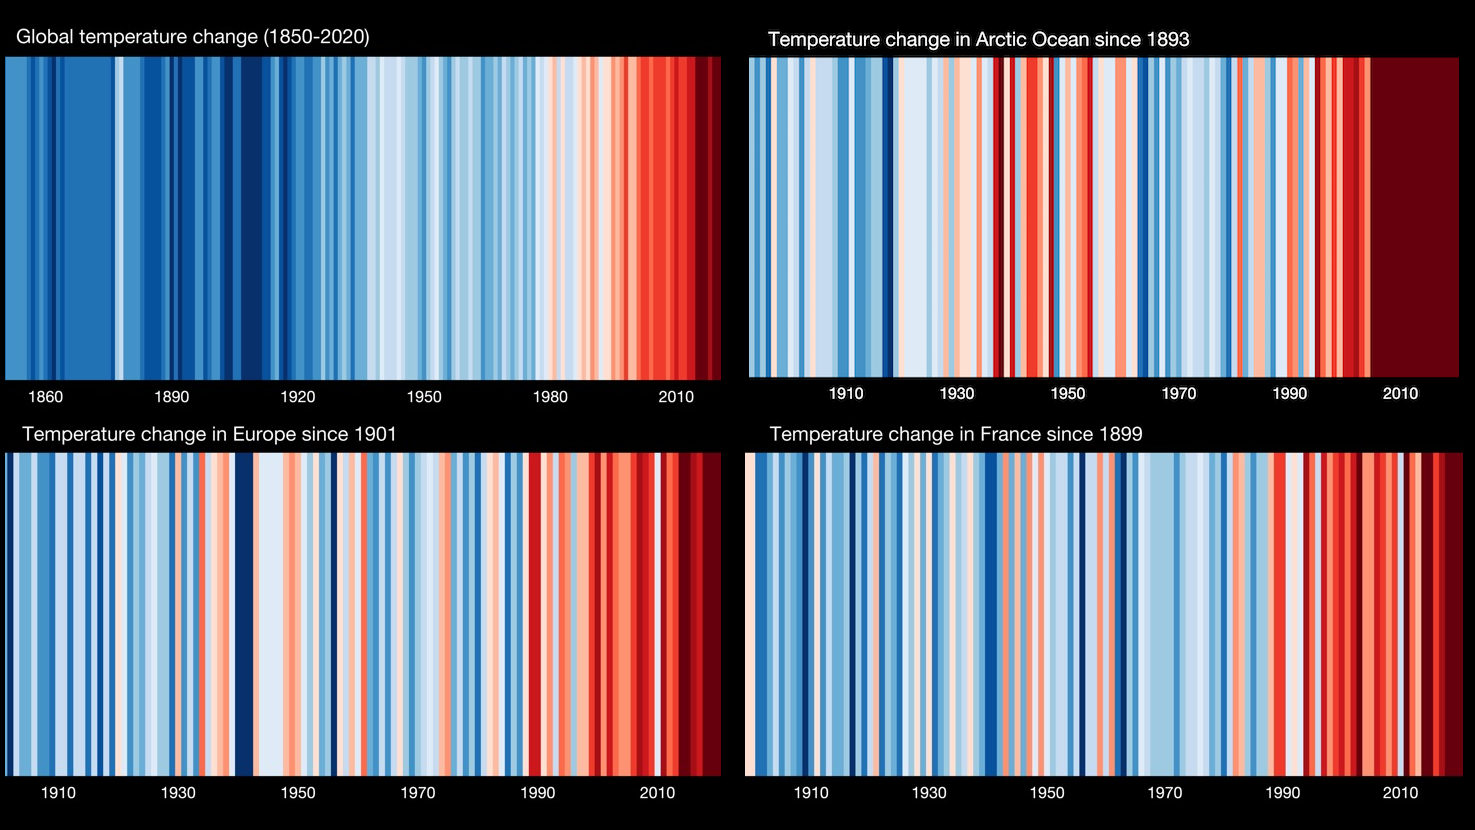
Source On the #ShowYourStripes website you can generate the graph for every country in the world.
The causes of climate change are now well established
It is caused by anthropogenic greenhouse gas (GHG) emissions, i.e. those linked to human activities. The greenhouse effect is a natural phenomenon that makes life on Earth possible: without it, the average temperature at the planet’s surface would be -18°C, not +15°C! The GHGs responsible for this phenomenon are naturally present in the atmosphere in very small quantities.
However, as can be seen from the following graph, since the end of the 19th century, human activities have resulted in increasing GHG emissions, leading to a rapid rise in their atmospheric concentration.
Global greenhouse gas emissions 1850-2019
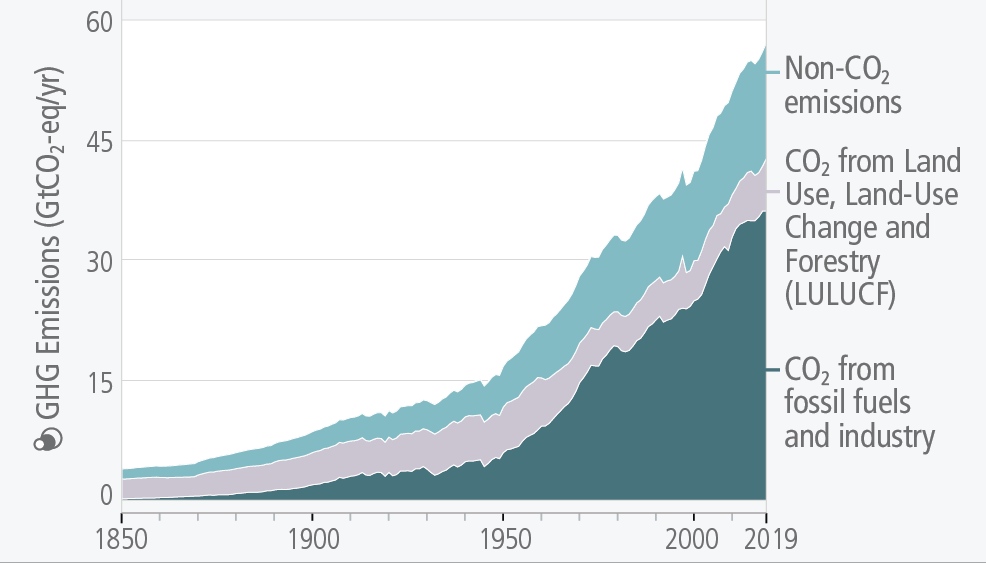
Source AR6 Synthesis Report – Climate Change 2023 – IPCC (Longer report p.43)
Global greenhouse gas emissions in 2019 will be close to 59 GtCO2-eq(to find out more about this unit, please refer to our fact sheet Counting greenhouse gas emissions).
What are the effects of global warming?
If we don’t succeed in drastically reducing GHG emissions, the impacts already observed will only increase throughout the 21st century.
This will be reflected in a global rise in temperatures 5 and an increase in heat waves. For example, according to a recent study, for an emissions scenario leading to more than +4°C in 2100, around 74% of the world’s population would face more than 20 days a year of potentially lethal temperature and humidity conditions, as they exceed the human body’s physiological capacity to adapt.
By 2100, sea levels could rise by more than 1 metre compared with the period 1995-2014 (according to the 6th IPCC report), directly affecting almost one in 10 people worldwide.
Another concern is the spread of diseases carried by certain insects, such as the mosquitoes that transmit dengue fever, yellow fever, Rift Valley fever and malaria.
The power and number of storms (cyclones, hurricanes, typhoons, etc.) will increase, as will the large-scale fires we are already seeing today. Water shortages will increase, while agricultural productivity will decline. All this will lead to massive population migrations. 6 within and between countries, a major source of political instability.
A fundamental point highlighted in the latest IPCC report is that every half-degree counts. This was also shown in the IPCC report Global warming of 1.5°C (2018). 7. The greater the warming, the greater the impact on humanity.
The frequency and intensity of extreme events will increase with each additional half-degree of warming.
The graphs below show how extreme phenomena (extreme temperatures, heavy precipitation, droughts) that occurred on average once a decade in a climate without human influence (reference period 1850-1900) increase in frequency and intensity at different levels of warming (+1°C i.e. today, +1.5°C, +2°C and +4°C compared to 1850-1900).
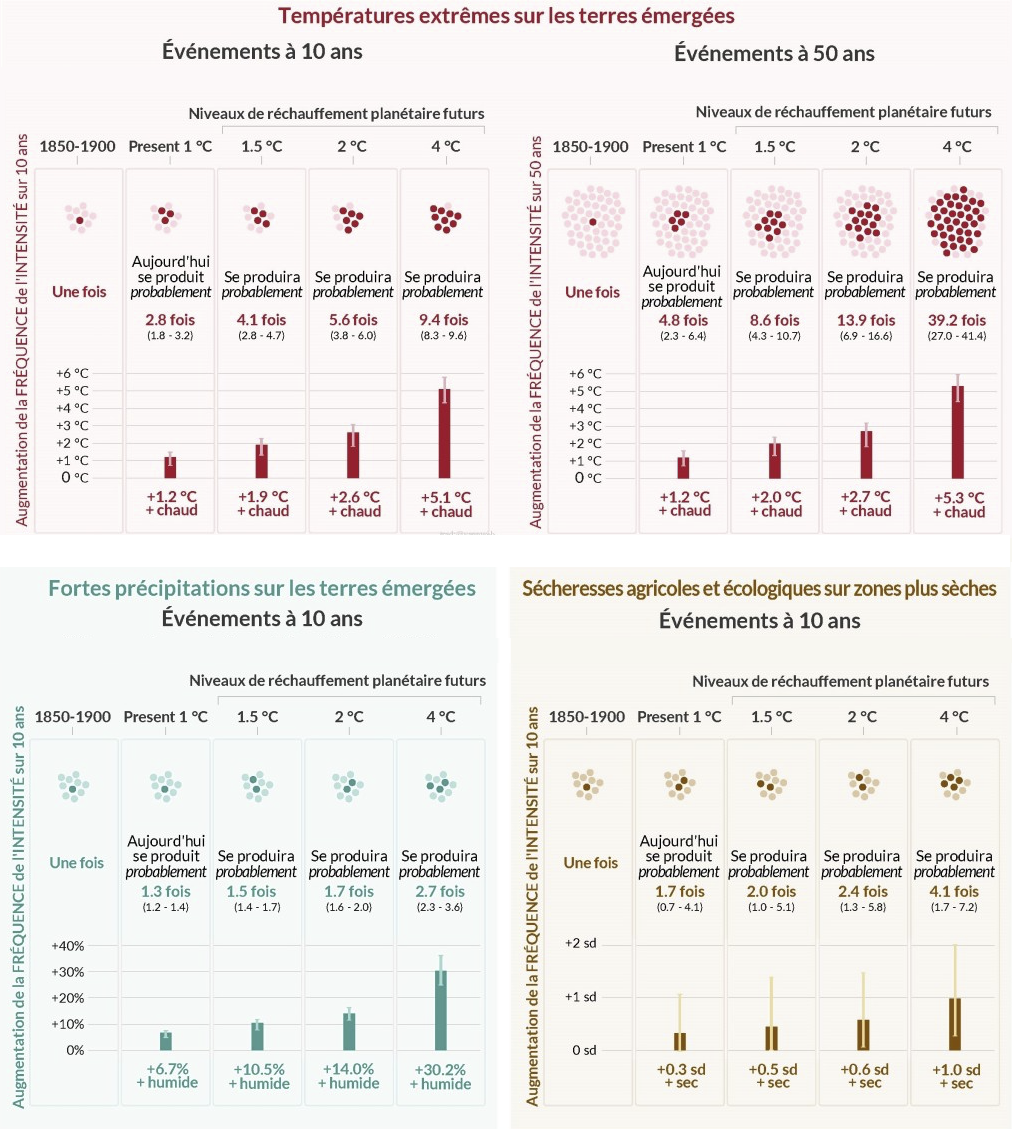
Source Climate Change 2021 – The physical science Basis – Summary for decision-makers of the IPCC Working Group 1 report (Figure SPM6).
Reading: the graph at top left shows that daily maximum temperatures, which were reached once a decade in the period 1850-1900, are reached 2.8 times a decade with a global warming of 1°C (which corresponds to today’s climate) and will probably be reached 9.4 times a decade with a warming of 4°C. In addition to this increase in frequency, these phenomena are also increasing in intensity (they are 1.2°C warmer with a global warming of 1°C, and 5.1°C warmer with a warming of +4°C).
Where are we now?
In the Paris Agreement adopted at COP21 at the end of 2015, the world’s states set out the goal of limiting“the rise in global average temperature to well below 2°C above pre-industrial levels“, a threshold beyond which scientists fear a runaway effect on the climate system 3.
To achieve this, global greenhouse gas emissions will have to be drastically reduced. As shown in the graph below, to limit global warming to + 1.5°C or +2°C,CO2 emissions need to be reduced to zero (around 2050 for 1.5°C and between 2050 and 2100 for 2°C), and then to negative levels (i.e., we need to implement technologies that removeCO2 from the atmosphere _ see here). The reductions required are also very substantial for other greenhouse gases (a threefold reduction by 2100 for methane).
Annual global emissions of carbon dioxide (CO2), methane (CH4) and nitrous oxide (N2O) by 2100 according to 5 IPCC scenarios.
The IPCC is working on five emissions scenarios: very high or high emissions, medium emissions, and low or very low emissions. Each of these scenarios corresponds to different levels of future warming. Scenarios SSP1-1.9 and SSP1-2.6 correspond to a temperature rise of +1.5°C and +2°C respectively. Scenario SSP5-8.5 has an increase of over 4°C.
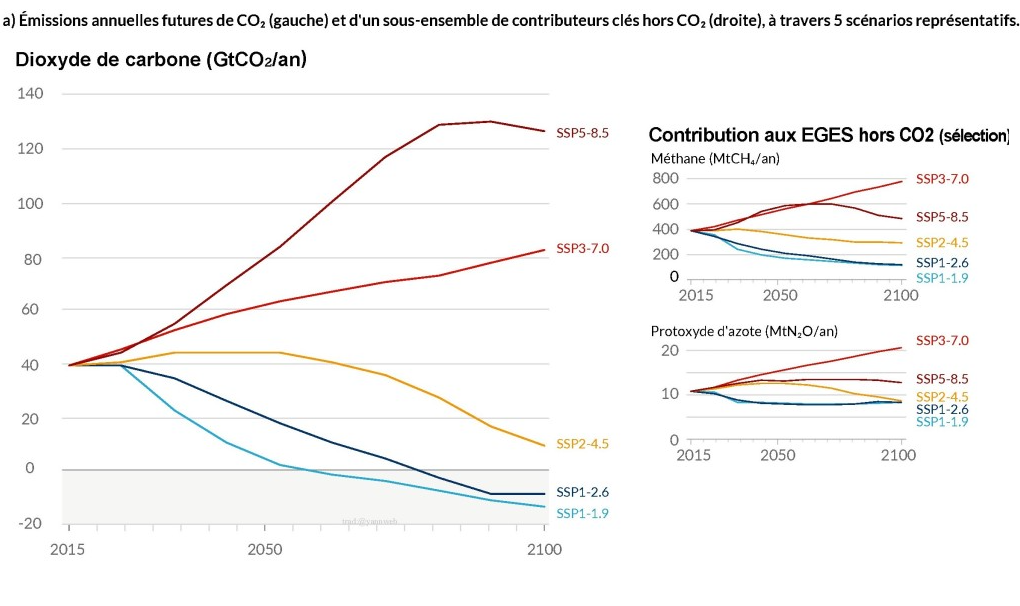
Source Climate Change 2021 – The physical science Basis – Summary for decision-makers of the IPCC Working Group 1 report (Figure SPM4).
Reducing GHG emissions in this way is a major challenge, because not only have emissions never stopped growing, but they are also linked to all human activities: energy production, agriculture and livestock farming, transport, industrial processes, waste management and so on.
Unfortunately, we’re not on the right track. Already, at COP21, the voluntary emission reduction commitments made by individual countries were insufficient to achieve the global objective of +2°C maximum. Current trends are taking us well beyond this target, as illustrated by the following image from the United Nations Environment Programme’sEmission gap report 2024.
Projection of global GHG emissions according to different scenarios and deviation from emission reduction requirements in 2030 and 2035
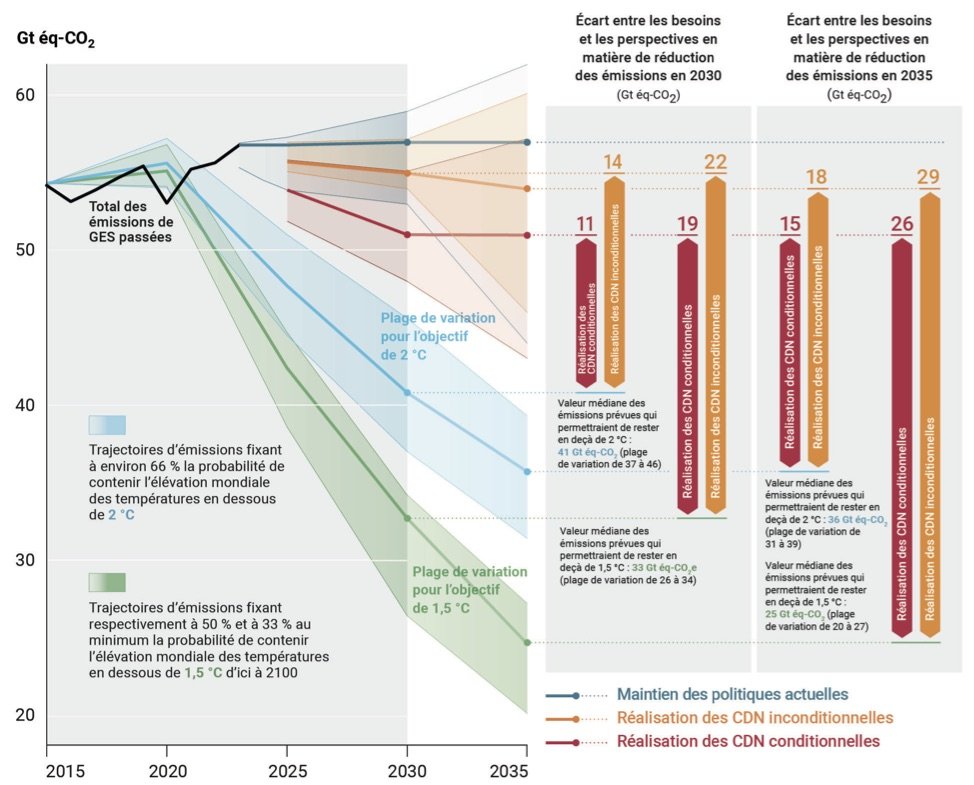
Source Emission gap report 2024 of the United Nations Environment Programme (Executive Summary in French). CDN = Contribution Déterminée au niveau National (i.e. voluntary commitments by States).
According to scenarios that assume a continuation of current climate policies, by 2030 humanity will have reached emission levels some 25 GtCO2ehigher than those needed to limit warming to 1.5°C.
Find out more
Resources for understanding the climate and global warming
- A highly educational course to help you understand how the climate works, how it is changing, and the links with other environmental challenges.
- Many articles on the website of engineer Jean-Marc Jancovici
- Podcast – Climate issues
Educational resources on the 6th IPCC Synthesis Report
- Popularized summary of the 6th IPCC report by think tank The Shift Project
- A summary of the GT1 report on the “Bon pote” educational blog
- The IPCC interactive atlas: regional temperature and precipitation trends at different levels of warming
The consequences of global warming
- An interview with climatologist Christophe Cassou, who reviews the latest scientific knowledge on the impact of global warming.
- The impacts of a 2°C warming well above those of a 1.5°C warming – World ressource institute
- Impacts of global warming on human health – Encyclopedia of the Environment website
- Maps from the European Environment Agency showing certain impacts in Europe
- Dataviz and maps showing some of the impacts of global warming in the United States
Responding to climate skeptics
The collapse of biodiversity
What is biodiversity?
The Convention on Biological Diversity, adopted at the Rio Earth Summit in 1992, defines biodiversity as ” the variability among living organisms from all sources including, inter alia, terrestrial, marine and other aquatic ecosystems and the ecological complexes of which they are part; this includes diversity within species, between species and of ecosystems”. It is therefore a broad concept, not limited to the number of living species. It encompasses both the diversity of living things (from genes to ecosystems, including individual species), and the diversity of interactions between living beings and their environment. In the words of ecologist Robert Barbault, it’s ” life in all its diversity “.
Video of ecologist Pierre-Henri Gouyon explaining biodiversity in Les Ernest
A sixth mass extinction
According to scientists, human activities are the cause of a 6th mass extinction 9. This manifests itself not only in the disappearance of species and the drastic fall in the numbers of animal or plant populations within species, but also in the destruction and disruption of large ecosystems such as forests on the continents 10 or coral reefs in the oceans 11
Yet the collapse of biodiversity is far from being the sole concern of bird and butterfly lovers. Humans are closely linked to other living beings: we are interdependent, as illustrated by the notion of ecosystem services presented below. As Robert Watson, Chairman of IPBES, puts it 12the health of the ecosystems on which we, like all other species, depend is deteriorating faster than ever. We are eroding the very foundations of our economies, livelihoods, food security, health and quality of life worldwide “.
Ecosystem services
Developed at the end of the 20th century, the notion of ecosystem services reflects the multiplicity of goods and services that humans derive from the proper functioning of the living world and ecosystems.
This is the report of the Millennium Ecosystem Assessment 13 (2005) report, which anchored the notion in public debate and drew up a typology of these services: provisioning services (food, drinking water, wood, etc.), cultural services (spiritual, recreational, cultural and educational benefits), regulating services (plant pollination, water purification by plants and micro-organisms, seed dispersal, climate regulation, protection against erosion or flooding) and life-support services (nutrient recycling, soil retention and formation, atmospheric oxygen production, water cycle).
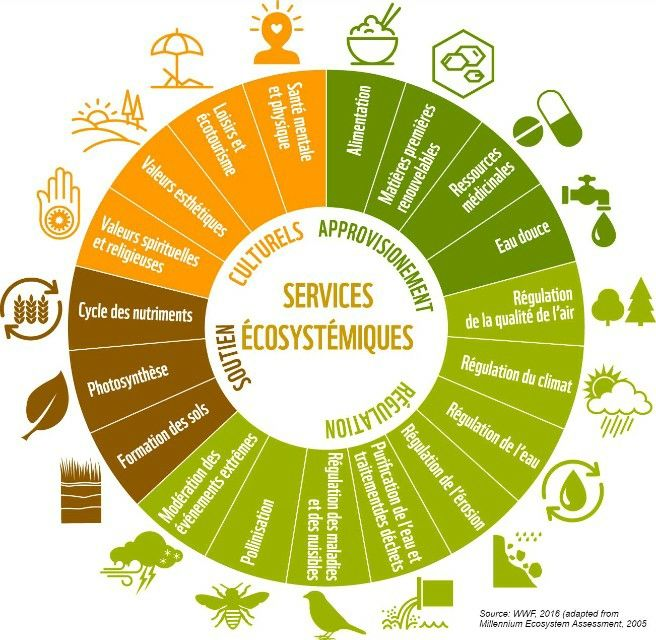
Source Living Planet Report 2016, WWF
Already in 2005, the Millennium Ecosystem Assessment report highlighted the serious degradation of ecosystem services: ” Around 60% (15 out of 24) of the ecosystem services assessed in this study (including 70% of regulating and cultural services) are degraded or used unsustainably “.
The causes of biodiversity collapse
In its first Global Biodiversity Assessment Report (2019), IPBES 12 identifies the main causes of biodiversity loss:
- habitat destruction and fragmentation: land use change, in particular deforestation for agriculture and livestock farming, but also mining, road building and urban sprawl;
- overexploitation of natural resources: fishing, hunting, logging ;
- climate change
- water and soil pollution (from pesticides, industrial waste and plastics);
- and finally, invasive alien species, i.e. species deliberately or inadvertently introduced into an area from which they are not native and which threaten ecosystems, natural habitats or native species (e.g. tiger mosquitoes, Asian hornets, coypu, etc.). See a list for France and the EU here).
The causes of biodiversity collapse
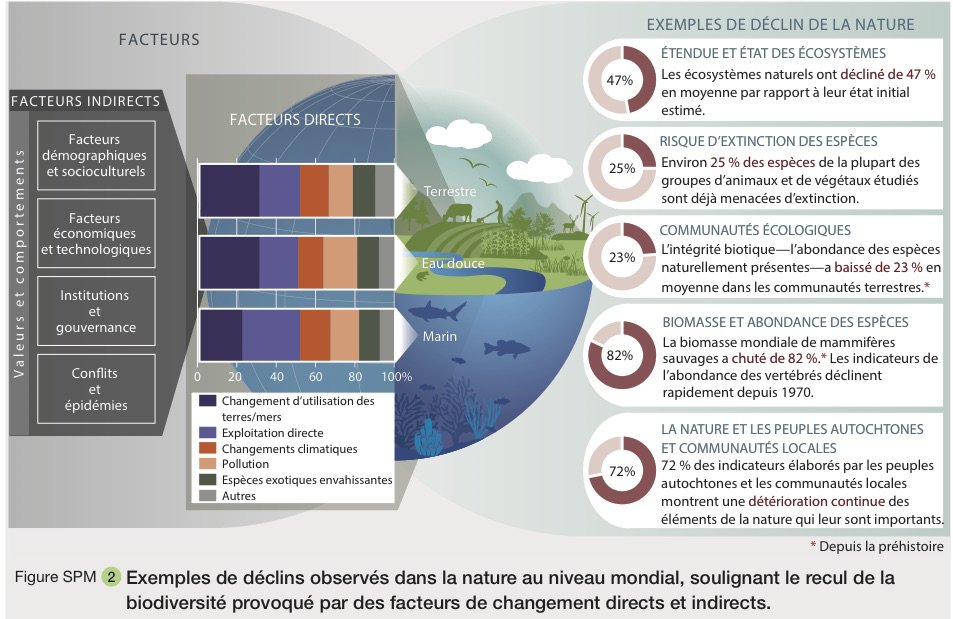
Source Report of the Global Assessment of Biodiversity and Ecosystem Services (IPBES 2019) – Summary for decision-makers (p25).
Where do we stand?
At COP10 of the Convention on Biological Diversity (CBD), held in Japan in 2010, the Parties to the Convention adopted the “Strategic Plan 2011-2020” and the 20 “Aichi Biodiversity Targets”(COP10 decision X/2) to halt the collapse of biodiversity. Ten years on, the CBD secretariat has published its fifth report on the Global Biodiversity Outlook: the vast majority of the Aichi Targets have not been met. In view of this, the report calls for an urgent change of course. The report describes the transitions required in eight areas: land and forests, sustainable agriculture, sustainable food systems, fishing practices and oceans, cities and infrastructure, freshwater, and the “one world, one health” approach. Once again, all human activities and lifestyles are affected.
Find out more
General biodiversity resources
- What is biodiversity? Encyclopedia of the Environment article
- Un éléphant dans un jeu de quilles (Seuil – 2008), a highly educational book on biodiversity by Robert Barbault
- IPBES website: reports reflecting the international scientific consensus on biodiversity
- The Global Biodiversity Outlook report – CBD
Resources for specific fields
Our ever-increasing demands on natural resources can only lead to their depletion.
The exponential growth of our consumption of natural resources
The global production-consumption volumes of raw materials are staggering. First comes fresh water, with 4,000 billion tonnes per year, followed by sand and gravel, estimated at between 40 and 50 billion tonnes per year. In terms of fossil fuels, coal leads the way (8 billion tonnes a year, or around one tonne per capita), followed by oil with over 93 million barrels a day (or over 4.4 billion tonnes by 2022). To feed ourselves, we produced nearly 3 billion tonnes of cereals in 2018. We mined around 2.5 billion tonnes of iron ore in 2019. 15.
These volumes have risen sharply in recent decades. The “Great Acceleration” graphs, originally published in 2004 and updated in 2015, provide a striking illustration of the acceleration in global consumption of natural resources since the 18th century.
The great acceleration
In 2015, a team of researchers from the IGBP (International Geosphere-Biosphere Programme) and Stockholm University led by Will Stephen published in The Anthropocene Review a dashboard of 24 planetary indicators for the period 1750-2010 : 12 physical indicators illustrating the degradation of our planet and 12 socio-economic indicators reflecting human activities.
From the 1950s onwards, all these indicators grew exponentially. This is what researchers call the “Great Acceleration”.
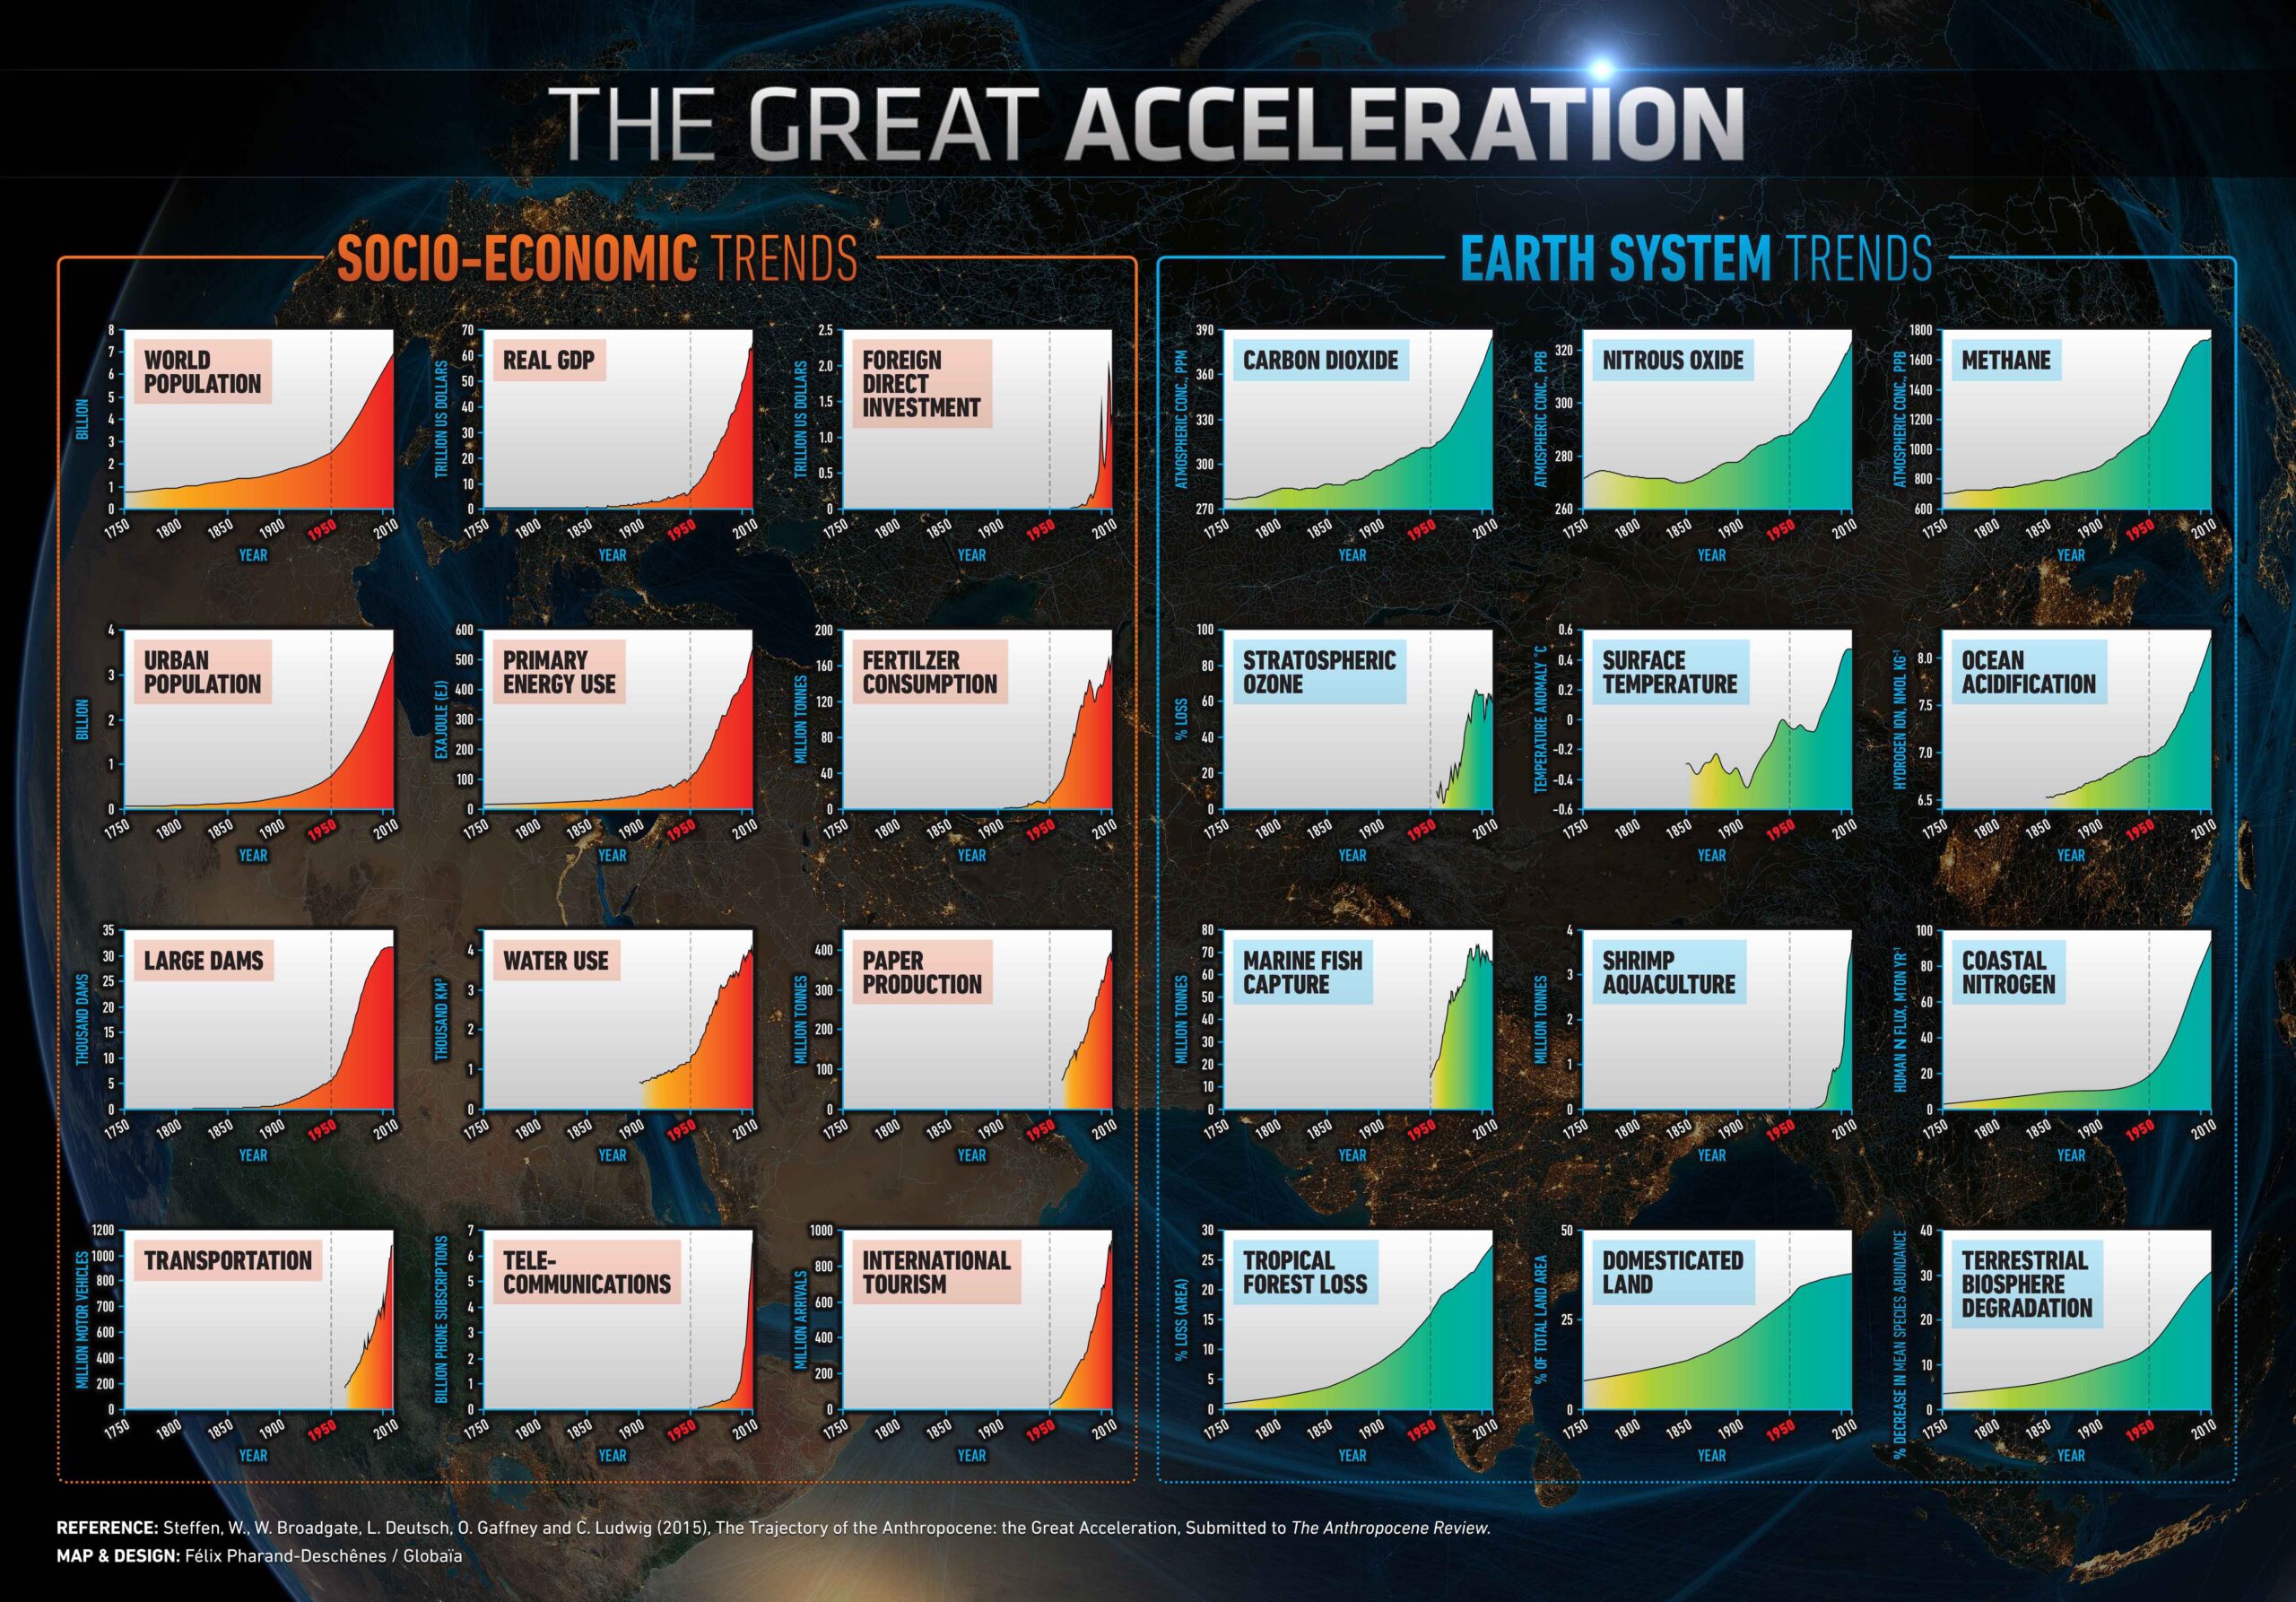
Source Find graphs and data on the IGPB website.
Consumption of energy, fertilizers, water, paper…. curves are exponential. Other economic indicators such as those for transport (number of vehicle sales) or telecommunications (number of telephone subscriptions) also reflect the exponential consumption of the underlying raw materials.
However, although the volumes already achieved are impressive, they may seem low in a few years’ time if the increase continues at an exponential rate.
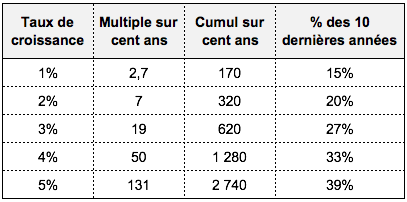
The mathematical properties of exponentials
If production grows exponentially at 5% per year, it will be multiplied by 131 after 100 years. In a century, cumulative production will be equal to 2,740 times the initial amount, and 39% of total production will have been achieved in the last ten years.
For example, the average annual growth rate of Lithium mine production over the period 1985-2015 was 6.4%; for copper it was 2.8%. 16.
For more on exponentials, see the article Crise écologique : notre cerveau n’est pas programmé pour la représenter !
The figures are even more incredible if we look at cumulative rather than annual production.
In a study published in the journal Nature 17researchers at the Weizmann Institute have calculated the “anthropogenic mass”, i.e. the mass of inert materials used for human construction and production (buildings, infrastructure, vehicles, various products) since 1900.
In 2020, it will reach 1154 billion tonnes, exceeding the mass of all living beings on the planet. Half of this is concrete and a third is aggregates (particulate materials used in construction: sand, gravel, crushed stone, etc.).
Anthropogenic mass trends from 1900 to 2020
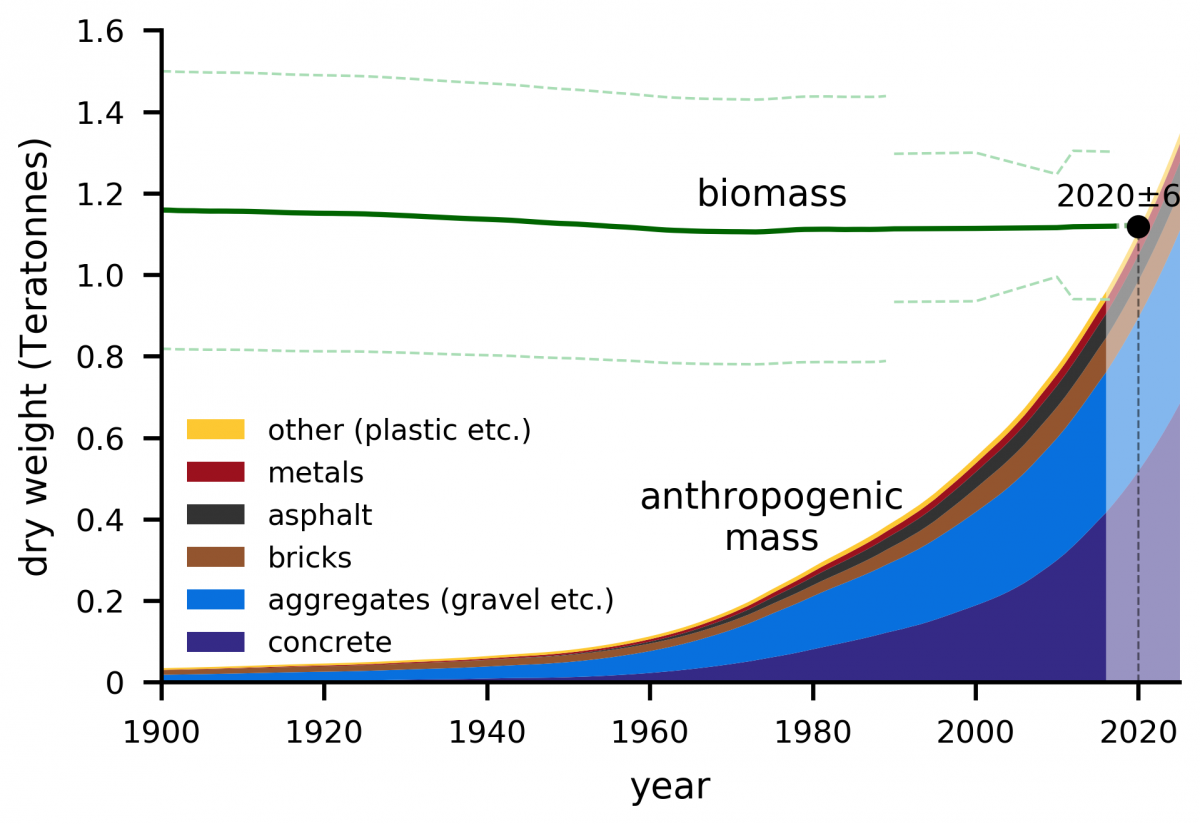
Source Graphic taken from the press release issued to coincide with the publication.
See also visualcapitalist.com for a well-done infographic showing anthropogenic mass in 2020 (and the different materials that make it up).
Here, too, we can see an acceleration since the 1950s: anthropogenic mass has increased tenfold, from just under 100 billion tonnes to over 1,100 billion. According to the authors, the continuation of these trends would lead to a “concrete jungle” exceeding two thousand billion tonnes by 2040, i.e. more than twice the mass of living beings on earth.
The distinction between exhaustible and renewable resources is not always obvious
To study the dynamics of exceeding natural resource production limits, we need to distinguish between two main categories.
- Exhaustible” resources: there are fixed quantities of these on the planet, if we think in terms of human timescales. Examples include fossil fuels and mineral resources;
- Renewable” resources: withdrawals can be made without exhausting the resource, because it renews itself (plant growth, animal reproduction, water cycle) or because it is not destroyed by use (solar energy flows, wind).
Beware, however, of being misled by terminology: some so-called “renewable” resources can also disappear if the level of harvesting exceeds their capacity to reproduce. This is what is happening to fish stocks.
Overexploited marine fish stocks have risen from 10% in 1974 to nearly 38% in 2021
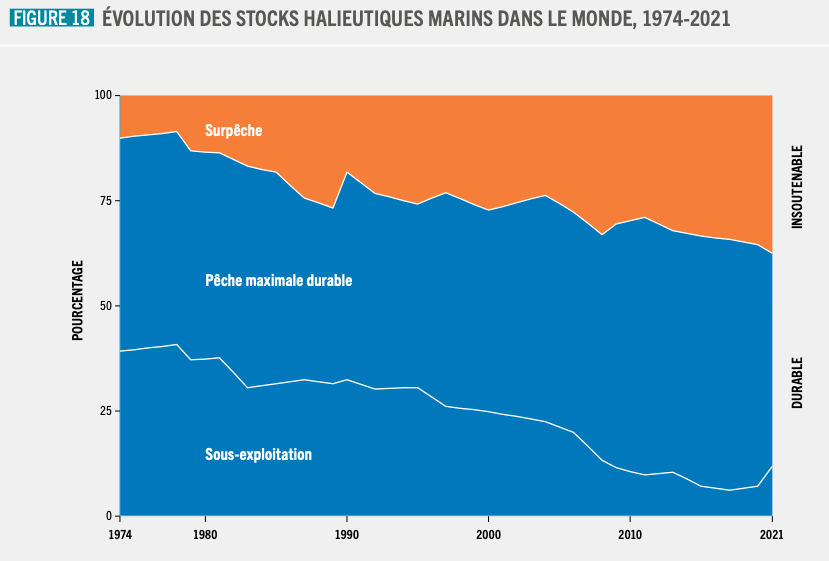
Source The State of World Fisheries and Aquaculture – 2024 Report – FAO
It’s not always easy to describe a natural resource as exhaustible or renewable.
Wood, for example, is a renewable resource, as long as it is replanted or given time to regenerate after cutting. However, primary forests – very old-growth forests little or undisturbed by human activity – are extremely productive and rich in biodiversity. They cannot be considered renewable in the sense that it will be impossible to regain such richness after cutting them down, even with replanting.
Freshwater resources are partly renewable – the water in rivers and underground aquifers used by man (for irrigation, domestic and industrial purposes) is renewed through the water cycle – and partly non-renewable, if we consider the water in aquifers that were formed long before the era of human civilization, and whose renewal can take centuries or even millennia: this is known as“fossil water”.
Whether resources are “exhaustible” or “renewable”, their exponential consumption can only lead to their exhaustion.
It’s a simple mathematical reality. The end of phosphate on the island of Nauru and of cod in Newfoundland, Canada, are two well-known examples of resource depletion of both types. However, some economists question this mathematical evidence by invoking the argument of technological progress or the substitutability of resources with each other or with artificial capital. These are discussed in Misconceptions 3 and 4.
Exhaustible resources are by definition limited on the planet.
Whether they result from a fixed initial stock (e.g. mineral substances present on Earth since its formation or from meteorite deposits) or from processes taking place over geological time that are imperceptible on a human timescale (fossil fuels), so-called “exhaustible” resources are in short supply on our planet. Coal, for example, is the result of the fossilization of immense Carboniferous forests over several hundred million years (find out more about the formation of oil, gas and coal).
Consequently, a non-decreasing, let alone exponential, withdrawal of this resource necessarily leads to its depletion. It’s a simple mathematical fact.
For example, steel production has risen from 189 million tonnes in 1950 to 1.8 billion tonnes in 2019, a tenfold increase in 70 years. Average annual growth over this period will have been around 3.4%. If we were to continue this trend, annual production would multiply by 100 every 135 years. In 270 years’ time, we’d be producing 10,000 times more steel than we do today! You don’t need to be very precise in estimating iron ore reserves to understand that such a pace is impossible to maintain, even for such an abundant ore.
Before the physical exhaustion of a given resource, we are confronted with a more economically relevant practical limit: the total quantity we are able to exploit may fall short of the desired demand, whether for technical, economic or geopolitical reasons. This can lead to high price pressures, supply difficulties and even shortages of varying degrees of severity.
In a 2017 report, Ademe provides a clear summary of the issues surrounding metals and minerals.
- Most of the large, easily exploitable deposits have already been discovered. Potential new deposits have lower concentrations or extreme mining conditions: under a layer of ice in Greenland, on the ocean floor, several km underground (such as the Tau Tona gold mine at a depth of 3.9 km in South Africa) etc.
- In addition to the challenge of depleting exploitable resources, we need to be able to satisfy demand in real time, to produce the necessary flow of resources. In particular, we need to anticipate demand, as the time between the discovery of a deposit and its exploitation at full capacity can take up to several decades.
- Global analysis is not enough: we also need to understand regional differences. Some resources are unevenly distributed across the globe. The issue of their use by all must take account of geopolitical balances or tensions. This is a point often made about rare earths, more than 80% of which are produced in China.
- Mining requires considerable amounts of water and energy. Mining development in water-poor areas and, more generally, the scarcity of water resources (through overexploitation and the effects of climate change) may limit the exploitation of certain deposits. In 2012, global metal production accounted for around 10% of the world’s final energy consumption. 18. Energy requirements per unit produced are set to rise as the metal content of deposits declines, requiring a greater volume of rock to be extracted and processed to obtain the same tonnage of metal.
Last but not least, mining is an extremely polluting activity: it can run up against problems of social acceptability (particularly in wealthy countries). 19 or be shut down following accidents causing massive water and soil pollution, as was the case in Brazil’s Rio Doce river valley in 2015.
Limits to the exploitation of renewable resources
Renewable resources include
- Primary energy flows (sun, wind, gravity for hydropower): these energy sources can appear inexhaustible because they are not destroyed by use.
However, capturing them and transforming them into energy that can be used by humans (electricity, for example) requires the use of other natural resources, which are themselves limited (mineral materials to manufacture wind turbines, dams, solar panels). What’s more, like all energy production methods, renewable energies are not without impact (on biodiversity for wind turbines or dams, need for land to install production plants, etc.).
- Goods and services of biological origin, i.e. everything we draw from other living beings to feed, clothe, care for and heat ourselves, and to produce various objects.
The main characterization of renewable resources for their management is the “maximum sustainable withdrawal rate”: this is the maximum withdrawal over a period (usually one year) that does not reduce the stock of the resource for the following period.
For example, if we are interested in the stock of a fish species, the maximum harvest rate will be that which ensures a stable number of adult fish from one year to the next, taking into account all the natural dynamics of the population’s evolution: newborns, non-fishing mortality, number of fish reaching the adult stage, etc. This indicator has become a worldwide reference in fishing. This indicator has become a worldwide benchmark in the fishing industry. Today, however, it is considered insufficient from an ecological and social point of view. For sustainable fishing, it needs to be supplemented by other restrictive criteria (such as the minimum size of fish caught, which depends on the species and fishing grounds).
Exponential energy consumption is our engine for transforming nature
In developed countries, energy is ubiquitous. No economic activity can do without it. It is used to extract and transform all other raw materials, to transport people and goods, and to provide light, heating and cooking. Energy makes it possible to manufacture and operate all our machines (including those of the digital economy, which is far from dematerialized), as well as to construct buildings and infrastructures. It is also the basis of our food (agricultural machinery, fertilizers and pesticides via petrochemicals) and our health (raw materials for medicines, medical equipment).
Since the start of the thermo-industrial revolution, energy consumption has risen steadily.
This is the case for primary energy consumption, which has risen from almost nothing to over 14 tep today.
There has been a sharp acceleration since the middle of the 20th century: from the end of the Second World War to the present day, global primary energy consumption has increased tenfold.
The only pauses or slight reductions in consumption are caused by major crises (wars, economic crises, pandemics).
World primary energy consumption (1860-2019)
MISSING DATAVIZ: bee2c47e-bcc2-437e-b980-a46080901902Source Schilling & al + Observatoire énergie + AIE + BP Statistical review 2020
Energy consumption was initially based on coal, to which oil was added in the mid-20th century, followed by gas in the 60s and 70s.
Initially, North America and Europe accounted for almost 60% of the world’s primary energy consumption in 1975. From the 1980s onwards, the Asia-Pacific region entered the race: it now accounts for over 40% of global energy consumption.
Primary energy, final energy – what are we talking about?
The energy we consume on a daily basis (gasoline at the pump, electricity to power our light bulbs, household appliances or computers, heat produced by our radiators, gas to power our stoves) is not directly available in nature. Before they reach us, so-called primary energy sources have to be extracted from the ground (oil, gas, coal, uranium) or captured from nature (the energy of the wind, sun or tides), transformed into usable energy and then transported to end users.
Primary energy is the energy available in nature before any transformation (oil, gas, coal or uranium, wood, wind or sun, etc.).
Final energy is that which is available to the user. Extracting/capturing primary energy, transforming it and transporting it all require energy consumption. The final energy consumed by users therefore represents only a fraction of the initial primary energy.
When we look at final energy consumption, the findings are the same.
World final energy consumption by source (Mtoe)
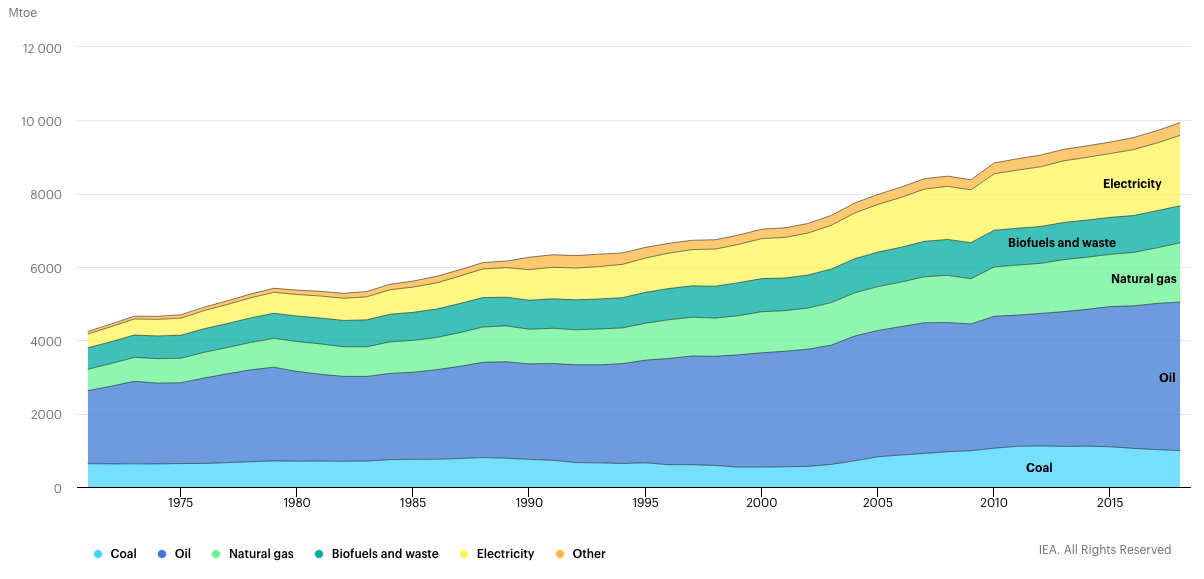
Source Key World Energy Statistics 2020 – IEA
It has increased by a factor of 2.5 since the 1970s and is 80% fossil fuel-based. 20.
Despite this growing consumption, inequalities in terms of access to energy remain considerable.
While the average final energy consumption per capita in 2022 will be around 1.8 toe worldwide, there are huge disparities between countries: less than 0.4 toe per capita in Africa, compared with more than 3 toe/capita in Europe and more than 7 in the United States.
In 2021, nearly 10% of the world’s population still had no access to the services provided by electricity. 21.
Primary energy consumption per capita (toe – tonne of oil equivalent)
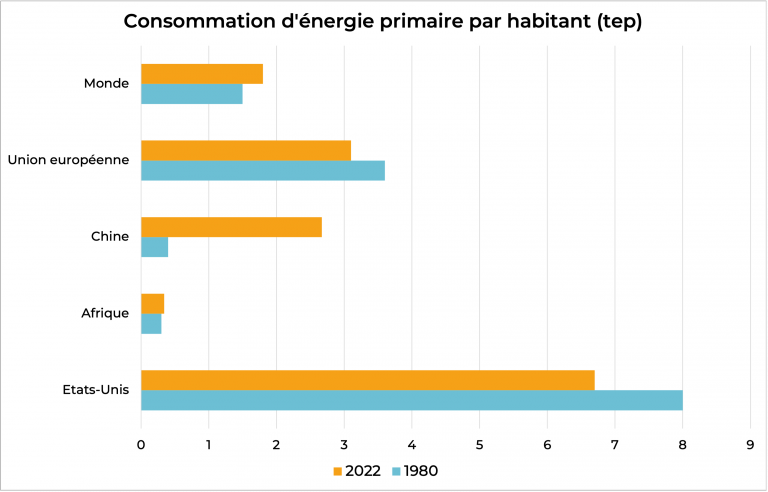
Source Statistical Review of World Energy (Energy Institute – 2023)
There has never been an energy transition
There’s a lot of ambiguity in the way we talk about the history of energy, suggesting that oil (and cars) and gas have taken over from coal at the start of the industrial revolution, and that the beginning of the 21st century will be marked by the advent of renewable energies.
Such a narrative is simply not true: over the last two centuries, there has never been a substitution of one energy source for another, but rather the addition of new energy sources to existing ones. Today, fossil fuels still account for over 80% of total primary energy consumption.
That’s why it’s important to give full meaning to the term “energy transition”, now widely used to designate public policy objectives in this area. Today’s low-carbon energies (nuclear and renewable) are no solution to the climate crisis if they simply add to carbon-based energies without replacing them.
Find out more
Some statistical sources on energy
- Statistical Review of World Energy – Published by the Energy Institute since 2023
- Statistical Review of World Energy – Released by BP before 2023
- Statistics from the International Energy Agency
On the fact that there has never yet been an energy transition
Fossil fuels are not inexhaustible
Oil, gas and coal are called “fossil” energies because they result from the natural process of fossilization of living organisms over millions of years. On the human timescale, these energies are therefore present in limited quantities on the planet: continued exploitation will inevitably lead to their exhaustion.
This question, which is important for all exhaustible resources, is fundamental for energy because, on the one hand, energy is an essential component of all human activities and, on the other, fossil fuels account for 80% of the primary energy consumed worldwide(see Essentiel 3) and almost 2/3 of greenhouse gas emissions. Among these energies, oil occupies an essential place. It’s a liquid that’s easy to transport, not very dangerous in its current state, and very dense in terms of energy. It’s the “lifeblood” of the economy, which would quickly grind to a halt without the transport of goods. It’s not without reason that governments the world over fear conflict with truckers! Lastly, while in theory it can be replaced by fuel oils derived from coal, gas (CTL and GTL) or synthetic fuel oils, production capacity is still limited. 22 are considerable and would require very heavy investment, implying long lead times.
Definition: resources, ultimate reserves, proved reserves
The term “Resources” refers to the totality of deposits: this is a physical fact, but it may not be known. Moreover, resources are not necessarily fully exploitable.
The term “Ultimate reserves” refers to the total resource that will eventually be extracted from a deposit (or an area, or the planet as a whole). They therefore take into account all deposits (existing and yet-to-be-discovered), as well as technical and economic conditions that are more favorable than those prevailing at present.
The term “Proved reserves” refers, in theory, to the quantity of resources that the operator can guarantee will be extracted in the future from producing fields under current technical and economic conditions. They therefore do not include undiscovered deposits, deposits discovered but not yet exploited, or technical (new processes) and economic (higher market prices for resources) developments that would enable existing deposits to be better exploited.
However, the validity of figures disclosed by operators or governments on a declarative and unaudited basis can be questioned. For example, OPEC countries’ oil export quotas are set according to the volume of proved reserves they declare, which may lead them to inflate the figures. For instance, Venezuela’s reserves (the largest in the world according to OPEC figures) rose from 99 to 296 billion barrels between 2007 and 201023 following the Chavez government’s decision to add the Orinoco’s extra-heavy and difficult-to-exploit oil to the amount of reserves.
This is one of the reasons why, since 2020, proved reserves are no longer published in the Statistical Review of World Energy, the annual reference publication on the energy sector.
The important concept when considering the economic impact of fossil fuel depletion is not so much the point at which there will be no fossil fuels left, but rather the point at which there will be a “production ceiling” (also known as peak production). This term refers to the point at which production stagnates and then begins to decline. There is much debate among specialists about the shape of the production curve (which is not necessarily symmetrical around the maximum, and can have a fairly long corrugated plateau), but the existence of a ceiling is a mathematical fact. 24.
Oil production in Europe from 1965 to 2019 (Million tonnes): example of a territory that has exceeded its production ceiling
MISSING DATAVIZ: 5d42b5d3-dbf6-4c39-9790-a4421b61ec7dSource BP Statistical Review of World Energy (2020) – Production figures include conventional and unconventional oil (shale oil, tar sand) as well as natural gas liquids.
Problems relating to energy availability do not arise when an energy source runs out, but from the tension between supply and demand. The first question is therefore not so much the stock remaining underground, but rather the flow available at any given moment (although the two questions are of course linked).
- Against a backdrop of ever-increasing production, these flows can be impacted by multiple factors, whether economic-technical (investments in transport and processing sufficiently upstream), financial (volatility of the price per barrel due to the financialization of oil markets, misleading investment needs – see Nicolas Bouleau) or political. The oil shocks of the 1970s, whose causes were essentially geopolitical, clearly demonstrated the extent to which a sudden rise in the cost of energy (and therefore in its availability at any given time) could have an impact on the global economy. The collapse in oil prices in the wake of the COVID19 pandemic is likely to have a major impact on investments by oil, gas and coal companies.
- Reaching the “production ceiling”, in a context where desired demand continues to grow, introduces a structural tension, since supply can only decrease. We are entering a new resource exploitation regime marked by structurally declining world production and increasingly difficult access conditions: a geopolitical context that remains uncertain due to the location of the main deposits, heavier investments to exploit deposits that are more difficult to access, and increasingly significant ecological risks (exploitation at very great depths, in fragile and difficult regions such as the Arctic, high-impact technical processes for shale gas….).
Much has been written on the question of the ceiling or “peak” of oil production (the most studied case to date). Despite the many debates surrounding this subject, analyses tend to converge on a range for reaching peak conventional oil between 2015 and 2030. However, there is still considerable debate about shale oil and ultra-heavy oil, and most experts do not see a decline in “all-oil” production before 2040. 25.
In the case of other fossil fuels, most experts believe that the production cap will come into effect later than for unconventional oil. Here too, uncertainties are high, and estimates of both exploitable resources and the production ceiling vary widely. Nevertheless, mankind is going to have to progressively do without fossil fuels, primarily because of their impact on the climate, and in the longer term because production will be able to grow ad infinitum.
Find out more
- Association pour l’étude des pics pétroliers et gaziers (ASPO) website
- Jean-Marc Jancovici’s website: understand how fossil fuels are formed, what the “reserves” are, the notion of peak production, etc.
- Book – Raw materials and energy: tomorrow’s challenges, Olivier Vidal, Iste Group (2018)
- Book: Or noir, la grande histoire du pétrole, Mathieu Auzanneau, La Découverte, 2015
There are still enough fossil fuels left to disrupt the climate
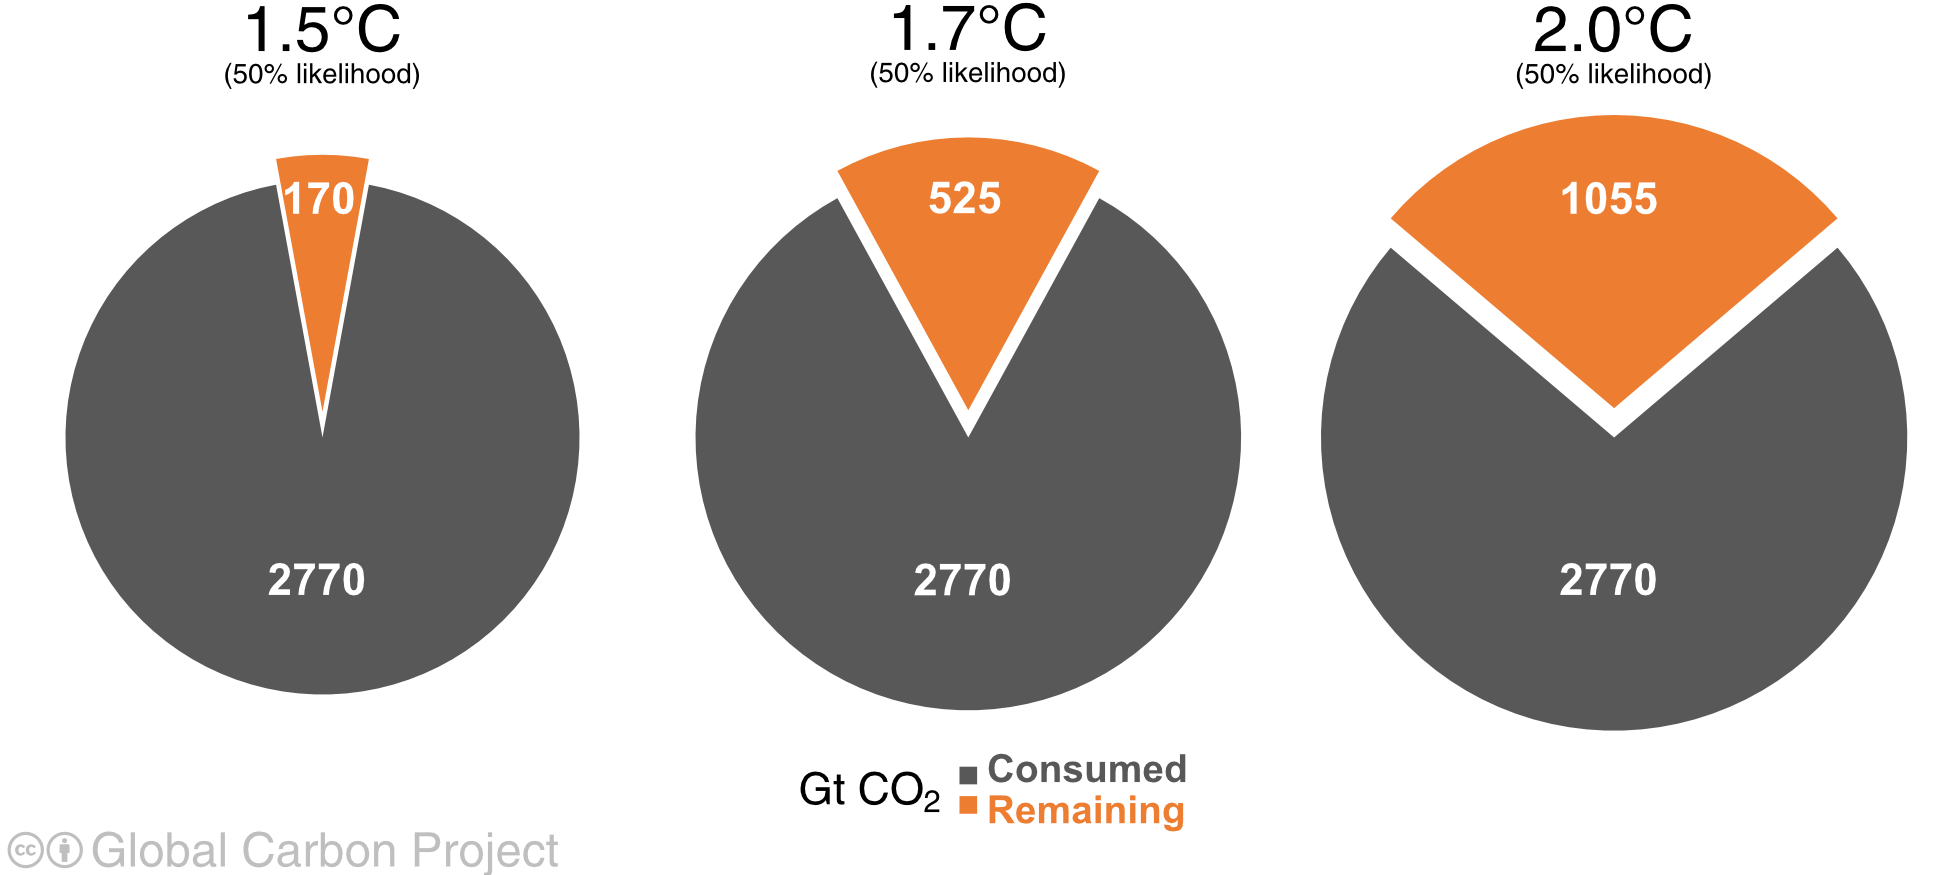
The term “carbon budget” refers to the cumulative quantity of CO2 we can still emit to stay below a certain level of warming compared with the pre-industrial period (generally that corresponding to the international targets of +2°C or +1.5°C). 26
According to the Global Carbon Budget 2025 report, humanity’s cumulative historical CO2 emissions amounted to 2,770 Gt CO2 at the end of 2024. To have a 50% chance of limiting global warming to +2°C compared to the pre-industrial period, we could only emit around 1,055 GtCO2, or 26 years of emissions at the current rate (around 40 Gt CO2 per year).
Let’s take a look at fossil fuel “reserves”.
As we saw in the box on the definition of resources and reserves, “proven reserves” represent only a small fraction of the fossil resources present in the planet’s soils and under its oceans. Very roughly speaking, these are the deposits currently in production.
Proved reserves and annual CO2 emissions from fossil fuels
The table below clearly shows that proved reserves are more than sufficient to exceed our carbon budget (regardless of the uncertainties surrounding these reserves, see box on this subject).
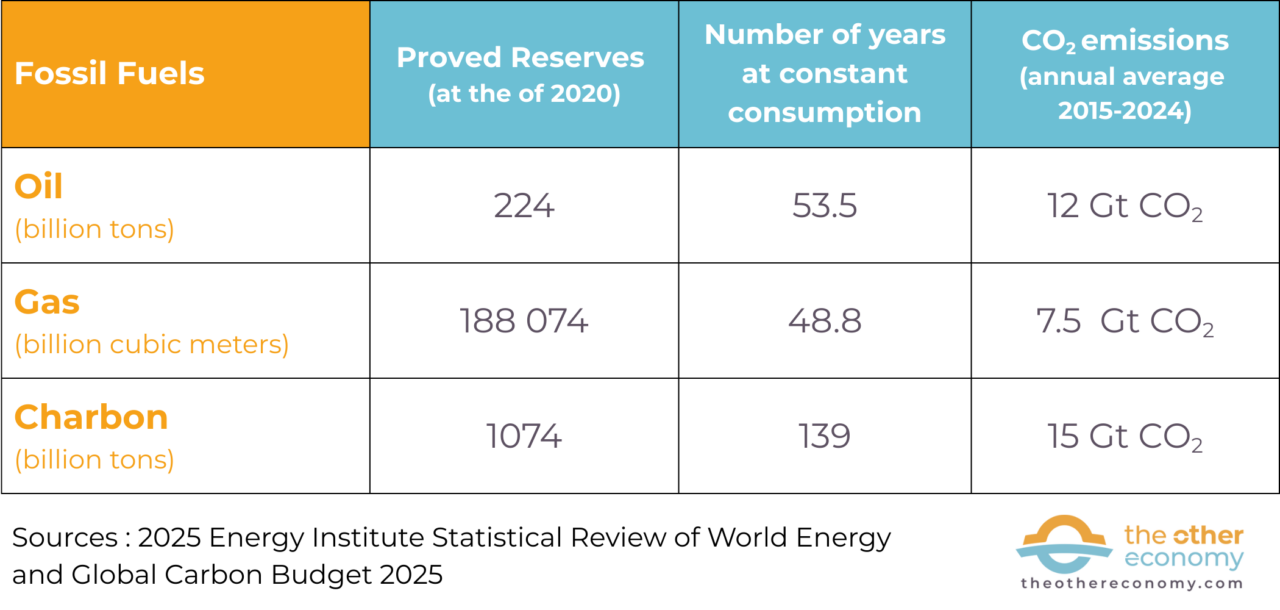
Sources: Proved reserves and nomber of years at constant consumption: Statistical Review of World Energy 2025 ; CO2 emissions: Global carbon budget 2025.
There is a debate about the credibility of the scenarios leading to the highest temperature increase (RCP 8.5 scenarios). 27). Some experts 28 believe that there won’t be enough fossil energy underground to reach it; others that the world will have become chaotic long before then, and that we won’t be able to produce the necessary fossil fuels. Others29 still indicate that higher emission scenarios are possible. These debates about very high emission trajectories are unhelpful and confusing. The real issue is how to leave the resources we already know under our feet and stop looking for new ones!
Two additional points are worth highlighting.
- We have seen that oil plays a specific role in our economies. Uncertainty about “non-conventional” resources is such that we cannot rule out an economic crisis like the one that followed the oil shocks of the 1970s, which would have a significant effect on global oil consumption and related emissions.
- Global abundance does not mean regional abundance. In particular, Europe is the region of the world least endowed with fossil fuels, and its dependence is growing. The war in Ukraine has clearly highlighted the risks of higher energy prices (or even shortages) linked to a geopolitical crisis affecting the decisions of exporting countries.
In conclusion, the fact that the global shortage of fossil fuels does not in itself enable us to limit climate drift quickly and sufficiently does not immunize us against the economic risks associated with tensions over our energy supply.
These two arguments lead to the conclusion that it is imperative to rapidly reduce our consumption of fossil fuels, by reducing our energy consumption and developing low-carbon energies.
The environment is not a structuring theme for most economists
For anyone interested in ecology, it seems obvious that the productive system rests on a physical and living foundation: the natural resources (including energy) from which we draw to feed, clothe, heat, house and transport ourselves, build our homes and infrastructures and all our everyday objects. Perhaps less obvious but just as essential, production also depends on maintaining the major planetary balances that determine the conditions in which economic activity takes place. 30. These balances are themselves based on the good condition of ecosystems and our planet’s capacity to absorb and neutralize the waste and pollution generated by production.
Yet, as we shall see, nature is far from being a major subject of study within the discipline of economics. While a number of economists have addressed ecological issues, the natural environment does not occupy a structuring place at the heart of the discipline, in the same way as, for example, the study of growth and its determinants.
Ecological issues belong to specialized fields of study within “standard economics”.
Despite the wide variety of schools of thought and the many controversies that animate the economics community, for several decades now the discipline has been marked by a dominant trend, based on the economic analysis of the neo-classical school, marked by the figure of homo-oeconomicus (a rational, calculating individual seeking to maximize his personal interest – see our fact sheet ) and by the predominance of markets as the institution that regulates society through prices. Hereafter, we will refer to this as “standard economics”. It is this type of analysis that is most common among researchers and teachers on American campuses and in French universities. 31 this type of analysis is also found in the most highly-regarded academic journals 32 or in economics textbooks.
Within this mainstream, environmental issues are addressed by specialized branches: energy economics, for the management of the energy system; natural resource economics, for the study of the efficient allocation of a scarce resource (see our fact sheet on Hotelling’s rule ); environmental economics, for the study of pollution (including climate change), considered as external effects of economic activity that need to be reintegrated by putting a price on them (see received idea 1).
Natural resources and pollution are therefore studied by those who specialize in these subjects. For the most part, economists carry out their work while ignoring the physical and living foundations on which the real economy rests. For example, economists specializing in growth do not take into account the natural resources on which it feeds, or the pollution it generates.
What’s more, the division of fields of study implies the absence of any systemic vision. It therefore fails to recognize that pollution, waste and environmental degradation are the result of production processes based on the increasing extraction of natural resources. As we shall see later, this highly compartmentalized approach to the links between economics and ecology, combined with the founding postulates of the standard analytical framework (market, price, rationality, return to equilibrium), can lead to particularly unfavorable or even dangerous analyses and conclusions in terms of how economics takes the environment into account (see preconceived notion 2).
Find out more
Explore the historical links between economics and ecology
- Economists and ecology: from physiocrats to Stiglitz, A. Lalucq – L’Économie politique (2013)
- Une histoire asynchrone de l’économie et de l’écologie, et de leurs “passeurs”, S. Boutillier and P. Matagne, Vertigo (2016)
- L’économie dans l’impasse climatique, PhD thesis by Antonin Pottier (chapter 2), EHESS (2014)
“Nobel prizes, academic journals, teaching: the absence of ecology
Without claiming to be exhaustive, here are a few emblematic examples of the extent to which ecology remains a peripheral subject. Whether we look at the major areas of recognition of the discipline (most influential journals, Nobel prizes) or at teaching: ecology is dealt with in a marginal way, if not totally absent.
50 years of “Nobel Prizes” in economics without an environment
Created in 1969 in memory of Alfred Nobel, the Sveriges Riksbank Prize honors economists who have ” brought the greatest benefit to mankind “. 33. It was precisely at this time that awareness of humanity’s impact on the planet really began to grow. However, it was not until almost 50 years later that the prize was awarded to an economist for his or her work on a specifically ecological theme: climate change. 34This was despite the fact that a number of economists who have been awarded the Nobel Prize for their non-ecological contributions, such as Joseph Stiglitz, Robert Solow and Ronald Coase, have made significant contributions to environmental and natural resource economics (which, let’s not forget, are branches of standard economics).
The environment absent from major general-interest magazines
In a literature review published in 2019 35Nicholas Stern and Andrew Oswald studied the occurrence of the words “climate”, “carbon” or “warming” in some 77,000 articles published by the 10 most influential economics journals in the discipline. Their methodology aims to ” provide a picture of what might be considered standard, representative economics as described in the leading journals of our profession “. Their conclusion is clear: ” academic economics (…) has produced remarkably few articles on one of the most important scientific, economic and political issues of our time “, namely global warming. In fact, according to their study, only around sixty articles, or less than 0.1%, deal with climate.
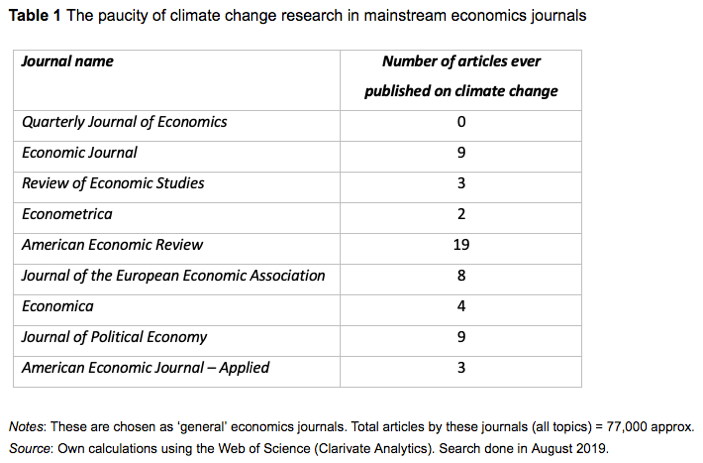
As the authors point out, the Quaterly Journal of Economics (QJE), the premier economics journal, has never published any. ” This is less than the QJE has published on baseball or basketball. So sports economics is better represented than climate economics in this leading economics journal!
For the authors, this lack of publications on climate is mainly due to a form of self-reproduction of the themes studied by economists: ” the climate change research deficit in economics stems, to a large extent, from the risk aversion of young economists (and some older ones) who focus primarily, for career reasons, on how to produce articles published in prestigious journals. Many economists seem to believe that the way to proceed is to send to mainstream journals the type of article that reviewers will consider satisfactory from the conventional and standard perspectives of mainstream analysis. “. In short, ” few economists publish on global warming, because other economists don’t write about climate “.
In his doctoral thesis, Antonin Pottier undertook a less exhaustive but nonetheless instructive exercise. He studied the titles and abstracts of articles published in the Journal of Economic Growth, one of the leading economic journals studying growth. Of the 240 or so articles published between its creation in 1996 and March 2014, not one examines the role of energy and natural resources in the growth process. 36. Following our request, the author continued his research until September 2020: the finding remains the same.
What do we learn in economics textbooks?
The question of training in economics is fundamental not only to the academic world, but even more so to understanding how the business world perceives ecological risks. In fact, it doesn’t necessarily lead to becoming a researcher – quite the contrary! What have the thousands of economists who populate international economic organizations (IMF, World Bank, multilateral or national development banks, OECD), central banks and financial regulatory bodies, ministries of the economy and finance (and their equivalent in the European Commission) or banks and other financial institutions learned? What is the perception of the links between natural resources, global pollution and production systems among members of government, civil servants, business leaders and their top management who, although they may not have followed a complete economic curriculum, have nonetheless received introductory courses in economics?
Introductory economics textbooks are a good place to start, as they not only form the cornerstone of an economics syllabus, but also form part of more general courses such as “Social Analysis 10: introduction to economics” at Harvard’s economics department, or the Master’s Philosophy, Politics and Economics in the UK, which train future political and economic decision-makers and administrative staff. They provide a basic understanding of the economic knowledge that students are expected to acquire.
Samuel Bowles and Wendy Carlin have studied the importance given to 100 themes in various introductory economics textbooks that have occupied a major place in teaching since the 1950s 37. Both authors were involved in the CORE project, Curriculum Open-access Resources in Economics. Launched in England in November 2013, this project aims to design a new textbook responding to student criticism to bring more pluralism and connection with reality. Launched in 2017, the first online version of the textbook is now used by numerous universities and schools of economics. The purpose of this article is to show just how much better this textbook responds to the challenges of this century than its predecessors. A welcome initiative, but what is it really?
Whatever the textbook considered (including CORE), the space dedicated to the environment reaches a maximum of 2.5% of content. Since the publication of Samuelson’s textbook in 1948, and despite the increase in ecological problems, the amount of space devoted to the interaction between economics and ecology has remained virtually unchanged. The subject is thus reduced to the smallest possible portion for all students who will only have an introduction to economics in their curriculum, as well as for economics students who will not choose to specialize in the environment.
This lack of emphasis on ecological issues is not confined to the introductory economics course. For example, in the eighth edition of their Macroeconomics textbook (2020)38 Olivier Blanchard and Daniel Cohen define GDP and its short- and long-term growth as the main macroeconomic variable. The book devotes ten pages (out of 676) to the COVID19 pandemic and completely ignores the question of natural resources, except for three pages on climate change. Two of these three pages recall the physics of global warming. The third merely states the solution traditionally put forward by economists, namely a uniform global carbon price, and lists the reasons why this has not yet been done. No mention is made of alternative solutions. The neglect with which climate change is treated is all the more paradoxical given that the authors acknowledge that the latter ” is perhaps the most important challenge to growth ” (P. 312), the “main variable” analyzed in their book. The authors are silent on the implications for the validity of the macroeconomic theories and models that are the subject of the textbook.
Economists who place ecology at the heart of their analysis are not at the center of the discipline.
The birth of a new paradigm in economics
At the turn of the 1960s-1970s, as the ecological question emerged as an issue of international public debate, certain economists forged a totally new paradigm placing nature at the heart of the economic system and linking the issue of natural resources to that of pollution.
In 1966, at the sixth Resources for the Future the economist Kenneth E. Boulding outlined the beginnings of this new paradigm. As Antonin Pottier explains in his thesis (p114), he ” describes the realization of a closed world, which does not exchange matter with the outside world. Matter taken in the form of resources enters the economic process and exits in the form of waste. (…) He compares the Earth to a spaceship, in which all used materials must be recycled in order to become available again“.
This concept has given rise to numerous works 39 aimed in particular at quantifying the flows of materials that pass through the economy to be transformed into solid or gaseous waste, and their interactions with natural systems. The economist Nicholas Georgescu-Roegen takes it a step further by applying the second principle of thermodynamics, which asserts the degradation of energy from concentrated to increasingly diffuse forms, to economic thinking.
Works studied at the heart of the discipline for a brief period
Initially, this work was relatively well accepted by the economists at the heart of the discipline. A 1971 article by Robert Solow, a growth theorist recognized by his peers, is emblematic of this period. In this article, Solow takes a much more systemic approach to the question of pollution than is found in the literature on externalities (seepreconception 1, which explains the concept of externality).
As the economy expands, even air and water become scarce. Air and water have only a limited capacity to assimilate waste or to evacuate it. These external or environmental effects used to be thought of as exceptions, but in modern industrial society they can become the rule. Every modern industrial economy apparently generates so much waste _ in the form of matter and energy _ that its disposal strains the capacity of the atmosphere, rivers and possibly even the ocean.
He clearly establishes a link between waste, pollution and resource availability, and asserts that externalities are the rule rather than the exception. Further on, in the chapter entitled ” The universal problem of material disposal “, he transcribes the systemic vision of an economy that takes materials and transforms them into waste:
We talk about the “consumption” of goods as if there’s nothing left of them once they’ve been consumed. But of course, everything remains. Every ton of material removed from the earth and transformed into goods still has to be disposed of when the goods in question are finally used.
Ecological economics was institutionalized in the 1980s, outside the mainstream of economic analysis.
The publication of The Limits to Growth in 1972 put an end to this brief period when the systemic vision of the economy as a process of material transformation, feeding on a flow of resources and rejecting a flow of waste, could have gradually become part of the body of recognized and taught economic knowledge.
Commissioned by the Club of Rome from a team of MIT scientists led by Dennis Meadows, the report asserts the impossibility of endless growth in a world limited in terms of resource availability and capacity to absorb waste. Despite (or because of) its high public profile, the report was roundly criticized by standard economists for not being based on empirical data, for not incorporating prices into the model used, and for not taking technical progress into account (see misconception 3 on the refutation of the Limits to growth report).
This brings to a close a brief period in which the interactions between growth, resources and pollution were studied together at the very heart of the discipline.
The economists behind the systemic vision of the economy, such as Robert Ayres and Hermann Daly, were gradually marginalized, and no longer found an interlocutor among standard economists. Ecological economics is therefore emerging from the sidelines. The creation of the ISEE(International Society for Ecological Economics) in 1988 and the journal Ecological Economics the following year gave visibility to this school of thought, which is now an integral part of the academic field, even if it lacks the weight and recognition of standard economists.
Find out more
- Handbook of ecological economics. A European perspective, De Boeck Supérieur (2022)
- What can we learn from ecological economics? – La vie des idées (2012)
- What is ecological economics? – Political Economy n°069 (2016)
- Articles on the Limits to Growth report: origins, method and content, reception, legacy.
Who are the economists studying ecology today?
While the vast majority of economists still ignore ecology, the subject has nonetheless become a growing object of study since the beginning of the 21st century.
Some renowned economists working within the standard analytical framework, such as Nicholas Stern and Joseph Stiglitz, have made significant contributions to the public debate on the need for economics to take ecology into account, but more often than not they have distanced themselves from, or even taken methodological liberties with, their analytical tools (as demonstrated, for example, by the controversy surrounding Nicholas Stern’s choice of a very low discount rate).
Among economists who refute the neoclassical analytical framework, the environment has long remained a blind spot in their field of study, which has focused much more on the revival of activity, macroeconomic balancing, growth, income distribution, the labor “market” and social justice… and rarely on resources or pollution. Since the beginning of the 21st century, however, there has been a growing interest in ecology among economists who did not initially specialize in this area. This is the case, for example, of Steve Keen or Gaël Giraud, of the Pocfin network and of many contributors to The Other Economy.
Finally, ecological economics is not a homogeneous school of thought. It is criss-crossed by a wide variety of currents, a typology of which economist Clive Spash has attempted to draw up. In an article published in 2013, he distinguishes between“new resource economists”, who adopt the analytical framework of standard economics to deal with new ecological issues;“new environmental pragmatists“, who aim above all to convince decision-makers to take effective measures to protect the environment; and“social ecological economics“, which clearly opposes the dominant economic approaches and gives priority to issues of social equity and the intrinsic value of nature.
The economic system is blind to the destruction of nature because it is invisible in our accounting tools.
As we saw in Essentiel 6, most economists represent the economic system in complete isolation from nature. Yet the state of the world that presided over the birth of economic discipline has been reversed. The labor “factor” has become abundant, as evidenced by the masses of inactive population. This is the result of demographic growth (and therefore of available manpower) and, above all, of the development of artificial capital and technical progress, i.e. the replacement in many fields of human labor by machines (and therefore, ultimately, by materials and energy – see module on labor and unemployment).
The natural “factor” of production, meanwhile, has become increasingly scarce, as we reach the limits of natural resource stocks (including their capacity to renew themselves, in the case of so-called renewable resources), or of the planet’s capacity to absorb our waste (physical and invisible, such as greenhouse gases, chemical pollution, etc.) (see Essentials 1, 2, 3 and 4).
Even today, for most economists, nature is still not a subject for economic study. This is also true of the macroeconomic models used by governments and major international institutions (IMF, World Banks), which do not take into account the natural resources required for production, global warming or the collapse of biodiversity.
Nature is a factor of production
We need arable land to grow food, wood and minerals to construct buildings and machines, heat and so on. The economy thus involves the extraction, transformation and disposal (or recycling) of natural resources. As these processes consume or degrade energy, any representation of the economy should respect the laws of physics, and in particular the first two principles of thermodynamics 40.
The economy also functions thanks to the services we derive from the functioning of ecosystems: water and air purification, protection against flooding, pollination of agricultural plants, gene reserves for medicines, support for tourism, etc.
More generally, economic life unfolds on a planet whose ecological balances can be impacted by economic activities, and conversely, natural disasters can in turn impact the economy. Put another way, the economic system is part of a physical reality and a set of ecosystems that the “serious” economist should take into account.
This fundamental flaw in economic thinking is reflected in our accounting tools, whether at macro-economic level, with the flagship GDP indicator, or at company level. Far from being neutral, accounting systems reflect a representation of reality that structures economic organization. In this management universe, nature does not exist. Consequently, it doesn’t count.
GDP measures the flow of money and trade between people. It measures neither the (re)constitution nor the destruction of capital, whether human, artificial or natural.
The destruction of resources and major attacks on the great natural balances, such as climate stability, are not the subject of provisions for asset depreciation in company accounts. What we account for is always an estimate (usually the result of a monetary exchange) of the contribution made by people in the production chain: accounting costs consist of a pile of human income, either in the form of wages or “profits” (dividends and other non-wage income, including annuities). We use water, soil, metals and energy, but the price of the constitution (by nature) of these resources never appears on our bills. We only pay for the labor and rents involved in extracting, transporting, processing, marketing and advertising them, but never the price of the quantity of resources used, i.e., in fine, the price of their scarcity, which our use accentuates. In the same way, we pay nothing for the water cycle, climate stability, the existence of an ocean conducive to life, or for the action of bees and other pollinators essential to the reproduction of many plants, the basis of our food.
This major flaw in our accounting system is fairly well identified at the macroeconomic level. For more than two decades, numerous reports and books have highlighted the limitations of GDP as an indicator of the health of an economy and, more generally, of a society. 41. Yet the growth of this indicator continues to be a major objective of public policy and economic discourse.
At the microeconomic level, work highlighting the impact of corporate accounting on resource consumption and pollution generation, as well as on alternative proposals, is still in its infancy, although promising. 42.
Because we lack the necessary tools, we continue to ignore the fact that we are destroying the natural foundation on which we depend. Without nature, there is no GDP and no viable business.
Preconceived notions
To solve the problem of pollution, all you have to do is put a price on it.
Let’s be clear beforehand: this is not to call into question the value of mobilizing the price tool (whether through taxes or quota markets) to raise the price of pollution and thus contribute to its reduction. The preconceived notion we wish to denounce here is that this tool is the alpha and omega of climate and ecological policies.
The concept of “externality” in economics
The term “externality” refers to the positive or negative repercussions of an economic agent’s activity on other agents without any “spontaneous” monetary market counterpart. 43. A famous example in economic literature is that of the positive cross-externalities between farmers and beekeepers 44. The beekeeper’s bees pollinate the flowers of the trees in the adjoining orchard free of charge, thus making a positive contribution to the farmer’s production; in return, the trees provide the bees with pollen, a major ingredient in the honey that the beekeeper will produce. 45.
In another classic example, discharges from a factory polluting a river have negative effects on water users downstream from the factory, without the company having to pay anything for it. The costs associated with these negative effects (health costs, decontamination, deterioration of a tourist site, etc.) are passed on to the community: they are “externalized” by the company.
Negative environmental externalities are not just pollution; they can also be the consequence of the over-exploitation of natural resources or spaces that have no price in themselves (air quality, for example), or whose price reflects only part of the services rendered to human societies. For example, the market value of a forest generally does not reflect the fact that it stores carbon, is home to a wide variety of living creatures, protects against soil erosion and flooding, etc.
At the beginning of the 20th century, Arthur C. Pigou 46 developed the idea that externalities are market failures because the price no longer represents all the costs and benefits generated by economic activity. To take the example of a factory polluting a river, the private cost of operating the factory (borne by the owner) is lower than the social cost (borne by society as a whole), because the factory does not include the pollution it generates in its costs. The result is a sub-optimal situation that will lead the plant to overproduce.
“Internalizing negative externalities: putting a price on pollution
One of the major characteristics of these externalities is that they are outside the market, and therefore outside the price system on which economic agents base their decisions.
To remedy this market failure, it is therefore necessary to “internalize externalities”, i.e. to introduce external costs or benefits into private arbitration. This can take the form of standards and regulations (e.g. prohibiting or limiting the level of pollutant discharges into the river) or the introduction of a price signal, a solution favored by economists. 47. The price materializes the externality and enables social costs to be shared between the agents who cause them and those who suffer them.
Pigou recommends the use of taxes equivalent to the cost of the damage caused to others. By the same token, the state should subsidize those who create positive externalities, in proportion to what they bring to others. In the 60s, John Dales 48 proposed a market-based approach, paving the way for quota markets such as the European carbon market. The public authorities set the maximum amount of pollution and distribute the “pollution rights” quotas among economic agents. These can then be traded on a market, where supply and demand meet to set the price. This solution would enable more effective management of externalities than taxes, since it would offer economic agents greater flexibility. Each company would be able to choose between paying the cost of pollution control or buying allowances. This would optimize the total cost of pollution abatement, which would be carried out where it is cheapest. However, two conditions must be met for this to be effective: property rights must be well defined, and transaction costs must be very low.
Whatever the tool used (tax or market), the price is supposed to lead to an “optimal” level of pollution or degradation of nature, in the sense that it balances the costs borne by the economic agent (for example, its investments to reduce or eliminate pollution) and the damage suffered by the community.
The aim is therefore not to eliminate pollution per se, but to reflect the cost of present and future damage, so that economic agents can take this into account in their consumption and investment decisions.
The idea may seem simple, but in practice it poses a whole host of difficulties.
How can we put a value on what is priceless?
How can we assess what pollution (or overexploitation) degrades or destroys, given that, by definition, the majority of natural capital is non-marketable? Let’s take the example of the river polluted by the factory. It will degrade the quality of the water for those who consume it, but it will also make the area unbathable, kill off some of the flora and fauna that inhabit the river, possibly make navigation more difficult, and so on. The river thus provides numerous services (see box on ecosystem services) to society.
How can its value be determined? And, more generally, should we put a price on nature?
Some of the methods used by economists to try and value the priceless
-Estimation of replacement costs: for example, if you cut down a forest, how much would it cost to replace it with an identical one?
-Estimate the cost of the damage that the service makes it possible to avoid, or that the pollution generates: for example, what would be the cost of the damage that erosion or avalanches would cause in a mountain whose forest would be cut down?
– The hedonic pricing method consists in deducing the value of an ecosystem service by observing the prices of nearby market goods: for example, the value of the recreational service of an exceptional natural site is deduced by measuring the difference between the price of properties with a view of the site in question and the price of those without.
-Methods based on surveys, such as contingent valuation, which involves asking a sample of people the following question: “How much would you be prepared to pay to preserve a particular piece of nature or a particular feature?
Each of these methods poses specific problems: the ability to recreate a natural area identically, to assess damage beyond that which is directly observable, to take into account the irreversibility of certain natural phenomena; in the case of surveys, the results are biased according to the income of the people questioned (a forest located near a rich area will be valued more highly than one near a poor area) or their lack of knowledge of the services rendered by the natural area in question. Finally, in general, these methods do not allow us to take into account all ecological services, and in particular regulating and life-support services.
Source Read more in the article What are nature’s monetary valuation methods worth? Aurore Lalucq and Jean Gadrey, L’Economie Politique n°069, 2016
Intergenerational equity: the discount rate tool
In addition to the question of valuing destroyed or degraded natural capital, there is a temporal dimension. The damage caused by the destruction of a natural area or the pollution of a river extends over time. They can have an impact not only on the present generation, but also on future generations. To take account of this intertemporal dimension, economists use the discount rate, which is a tool used to convert an amount spent or received in the future into today’s value. A zero discount rate means that these values are equivalent, while a high discount rate crushes the future and gives more value to the present. Behind this technical indicator lies a profoundly ethical debate: what place should we give to future generations?
Cost-benefit analysis: a highly questionable tool
Finally, there is the question of how to take into account the respective valuation of positive and negative externalities of the same project. Take public investment, for example. When deciding whether to invest, public authorities are supposed to consider not only the economic impact, but also the environmental and social impacts, i.e. the added value of the investment in terms of general interest. How do you decide between a new road and a railroad line? How can we take into account time savings, safety gains and environmental impacts? Economists have developed cost-benefit analysis for this purpose. This consists in comparing, in a monetized balance sheet, the costs of an action with the benefits it brings. For example, the costs of building a road will be compared with the benefits it will bring in terms of increased mobility or fewer accidents. Negative externalities also need to be taken into account: GHG emissions during road construction and use, fragmentation of natural areas, soil artificialisation, etc. As we can see, the problems of valuing the priceless are multiplied. The intergenerational dimension of the investment also needs to be taken into account, and a more or less significant discount rate needs to be decided. Finally, it should be noted that reducing everything to a single monetized calculation leads to the various elements of the calculation becoming substitutable for one another: valuing the increased ability to travel can counterbalance the loss of value linked to GHG emissions or impacts on natural areas.
As we can see, behind an apparently simple theory lies a multiplicity of methodological problems, ethical choices and approximations. This raises the question of whether it is reasonable to continue to focus research on price alone.
The myth of a single global carbon price as a solution to global warming
The treatment of global warming is fairly emblematic of the errors to which the theory of externalities, taken at face value, can lead; and this, even without taking into account the difficulty of setting a price on carbon, questions of intergenerational equity or the methodological problems of cost-benefit analysis.
First of all, it’s not our intention to question the value of carbon pricing tools (and, more generally, pollution pricing tools), which are essential to mobilize. However, it is highly problematic to make them the alpha and omega of climate policies.
This is recognized by many economists, such as those who participated in the High Level Commission on Carbon Pricing chaired by Nicholas Stern and Joseph Stiglitz.
Carbon pricing alone may not be sufficient to induce emissions reductions at the speed and scale required to achieve the Paris Agreement objective (…). A combination of climate policy instruments is likely to be more efficient and attractive than the use of a single instrument. These may include investment in public transport infrastructure and urban planning, support for renewable electricity generation, energy efficiency standards, land and forest management, investment in innovation and the discovery of new processes and technologies, and financial instruments to reduce the risks, and therefore the cost, of capital invested in low-carbon technologies and projects.
But there are still some renowned economists out there today. 49 for whom carbon pricing remains the major tool to be mobilized. They go even further, recommending the introduction of a single global price. This is the case, for example, of William Nordhaus, winner of the Nobel Prize 50 for Economics 2018 “for the integration of climate change into long-term macroeconomic analysis.”
According to Nordhaus’ research, the most effective solution to the problems caused by greenhouse gas emissions would be a global system of carbon taxes imposed uniformly on all countries. This recommendation is based on a result formulated in the 1920s by British economist A.C. Pigou, namely that each emitter should pay the social cost of the damage caused by its emissions via an appropriate price. A global emissions trading system can do the same job, provided that emissions limits are set low enough to ensure a sufficiently high carbon price.
On the one hand, such a recommendation ignores the practical difficulties of implementation. Climate negotiations have always stumbled on this subject, not least because of the redistributive impact and social costs that such a policy would entail, both within and between countries. Questions of social acceptability and justice are decisive for the implementation of a tax, as witnessed for example by the yellow vest protests in France. Many experts stress the importance of considering the use of tax revenues and social support for the most vulnerable economic players dependent on fossil fuels. When pricing is carried out via allowance markets, the power of lobbying by major corporations with their governments leads to over-allocation of allowances, as demonstrated by the ridiculously low price of CO2 on the European EU-ETS market since its inception.
So, even if a single global carbon price really were an effective solution, recommending its implementation despite its unfeasibility simply amounts to advocating inaction.
On the other hand, a single price is far from being such an effective solution. It’s obvious that the price level at which consumption and investment can evolve can vary from one country to another (depending on economic development) or from one sector to another (energy production, or the textile sector, for example).
Global warming is not an economic problem for the 21st century
That’s what climate economist Richard Tol said in 2016 in an interview for Books magazine.
Such a statement may seem surprising! And yet the idea that global warming, whatever its scale, would have a negligible impact on economic growth has long been prevalent among economists working on the links between macroeconomics and climate.
Unfortunately, it still applies today. William Nordhaus, winner of the Nobel Prize in Economics 50 in 2018 for his work on this subject, wrote as recently as 2023 “the damage is estimated at around 3.12% of GDP in the case of global warming of 3°C compared with pre-industrial temperatures, and 12.5% of GDP in the case of warming of 6°C.” 52
We have devoted an entire fact sheet to this subject, in which we explain the methods used by economists to arrive at such results, why they are deeply questionable and, above all, why this work is dangerous: Taking all these adjustments into account, the damage is estimated at around 3.12% of GDP in the case of global warming of 3°C compared with pre-industrial temperatures, and 12.5% of GDP in the case of warming of 6°C.
To find out more, see our Global warming: what impact on growth?
Infinite economic growth is possible
The international success of the Limits to Growth report, published in 1972, brought a new question to the forefront of public debate: is continued economic growth possible despite the scarcity of natural resources and global pollution?
The economists critical of the report answer in the affirmative (on the subject of natural resources). When a resource becomes scarce, its price rises and corrective mechanisms are put in place: demand falls, substitutes are found, technical progress makes it possible to do without them, reduce consumption, recycle them better or replace them with physical capital.
Forty years on, the arguments have not changed, as illustrated by the brief passage “Are natural resources a limit to growth?”, in one of the leading textbooks on Introduction to Economics. 53.
What does the report “The Limits to Growth” commissioned by the Club of Rome have to say?
In 1970, the Club of Rome, a fledgling think tank focused on planetary crises, commissioned a study from a team led by Dennis Meadows of the Massachusetts Institute of Technology on the possibility of maintaining population and economic growth in a finite world. Meadows’ team used the World3 model designed by Jay Forrester, the first attempt to integrate the economic functioning of societies with their physical environment.
Published in 1972, the report The Limits to growth concluded that continued economic growth was impossible in a world limited in terms of resource availability and capacity to absorb waste and pollution. All scenarios tested 54 show the same trend towards the collapse of production (agricultural and industrial) and population. The natural resources used by the production system (energy, arable land, forests, fish, minerals, etc.) cannot grow indefinitely, nor can the space available to store or assimilate our waste (solid waste, but also greenhouse gases, chemical substances, etc.). The only way to stabilize the global system is to limit population and production. Several researchers have since compared the report’s curves with historical data, which prove to be very close to the “Business as usual” scenario. 55.
The reasoning of economists who reject the report
Robert Solow’s speech at the Symposium on the Limits to Growth, transcribes the reasoning of economists who reject the report. What he calls the “doomsday model 56 suffers from a major flaw: it does not incorporate a pricing system leading to the implementation of corrective mechanisms.
Financial markets help anticipate future scarcity
While asserting that he is not one to believe that the market is always right, Solow nevertheless points out that “the price system is, after all, the principal social institution developed by capitalist economies (…) to detect and react to scarcity.”
It’s the evaluation of future prices by the financial markets that makes it possible to detect this scarcity. “If experienced and expert market participants now believed that resource prices would be significantly higher at some foreseeable time, prices would already be rising (…). The historical stability of resource prices suggests that buyers and sellers in the market have not acted as if they anticipated their depletion in the absence of a substitute, and therefore significantly higher prices.”
It’s worth noting that this first part of the argument is based on the belief in the ability of financial markets to anticipate future scarcity of the resources in question and to reflect this in current prices. This is an essential condition for the rest of the argument, as it is necessary for the corrective mechanisms induced by rising prices to be put in place BEFORE problems arise. This is far from self-evident.
Solow goes on to explain the various mechanisms that come into play as a result of rising prices.
When resources become more expensive, they will account for a larger share of costs, leading producers to save them or substitute other resources (e.g., replacing oil with coal or nuclear power). The prices of resource-intensive products will rise relative to those that use few resources, leading consumers to buy fewer resource-intensive products and more of other things. “All these effects automatically translate into an increase in natural resource productivity, i.e. a reduction in resource requirements per unit of GNP.”””
At first glance, this argument seems logical, but it is itself underpinned by an assumption that is more difficult to accept. Solow asserts that resource productivity can increase ad infinitum. ” There is therefore no reason why we should not believe that the productivity of resources cannot grow more or less exponentially over time.
A few examples that cast doubt on the effectiveness of price-induced mechanisms
The Newfoundland cod and phosphate on the island of Nauru are two well-known and well-documented examples of local economic collapses, linked to the depletion of exploited natural resources, not anticipated by prices.
Natural resources cannot be substituted for one another indefinitely.
- The capacity to exploit a resource depends on the availability of other resources (energy and water in particular), the mastery of technical processes that enable it to be extracted in ever lower concentrations and in areas that are difficult to access, and the environmental and social consequences that society is prepared to accept.
- If animals and plants can be considered substitutes for a time as food resources, there will no longer be any food substitutes in the event of a generalized collapse of the living world (as seems to be the outcome of current dynamics _ see beginning of module). In the same way, it’s possible to replace one metal with another for a time, but Mendeleiev ‘s table is finite. So we can’t indefinitely find new substitutes for minerals in short supply.
It ‘s not because supply falls and price rises that economic agents can immediately reduce their demand(the elasticity of demand to energy price can be more or less significant). For example, beyond a certain threshold, households and businesses will not be able to reduce their energy consumption because they are too dependent on it (car to get to work, poorly insulated housing, excessive consumption of unamortized industrial production tools, etc.). To achieve this, they have to invest, which requires financing (not always available) and time.
The mathematical “demonstration
In 1974, the Review of Economic Studies published an issue(n°41 – issue 5) devoted to the question of exhaustible resources.
In his article, Solow uses mathematical modeling to prove that consumption can continue despite a limited stock of natural resources. In his model, the production function integrates the flows of labor and physical capital 57as is traditionally the case, but also flows of resources extracted from a pre-existing, limited stock. In this model, natural resources are therefore assumed to be exhaustible.
However, he then notes that “if the average productivity of resources is bounded, then only a finite amount of production can be produced with the limited stock of resources; and the level of aggregate consumption that can be maintained indefinitely is zero”. He then dismisses this option as “uninteresting” to focus on the case where average resource productivity is infinite. His unsurprising conclusion is that constant consumption can be maintained by substituting capital for resources.
In his article, Joseph Stiglitz 58 also starts from a growth model in which production depends on flows of labor, physical capital and exhaustible natural resources. He then studies different growth regimes. Some do not allow consumption to keep growing steadily. Others do, but only if one of two conditions is met:
- either capital and natural resources are substitutable and the share of capital in production is greater than the share of resources
- or technical progress is constantly increasing.
This mathematical demonstration does not say which growth regime best describes reality. Yet, in his conclusion, Stiglitz states “If we consider the simple model presented as a reasonable first approximation, not only is sustained growth in per capita consumption possible, but the optimal rate of resource utilization for reasonable parameter values is of the order of magnitude observed for many natural resources.” No further mention is made of the essential conditions under which this “continuous” growth is possible.
As Antonin Pottier writes in his thesis (p131):
For consumption to remain constant, technical progress or substitutability must be such that the average product of resources tends towards infinity as the resource dwindles. (…) Economists can evade the question of limits to growth, not thanks to a certain amount of technical progress, but thanks to exponentially increasing technical progress. Economists theoretically save consumption growth by appealing to another form of growth, technical progress.
The method chosen to present the argument is important. The abstraction of mathematical models lends a “scientific”, “serious” dimension to the conclusions. However, these models only describe possibilities, from which economists choose those that conform to the conclusions they wish to reach, and not those that are closest to reality.
Economics can theoretically escape the finiteness of resources thanks to a vision of production that is totally disembodied, and ultimately disconnected from reality. Economists’ reasoning on technical progress such that the average product of resources is infinite is only possible in an ideal world, which retains nothing of the real characteristics of production.
Put another way, belief in the ability of technology to solve the ecological crisis is precisely a matter of belief, not of scientific demonstration, even when it takes on the appearance of such.
Find out more
- The Limits to Growth report – 1972
- A summary of this report on the website of engineer Jean-Marc Jancovici
- some twenty articles on the Limits to growth report: origins, content and methodology, reception by the public and economists, impact, legacy
For a detailed analysis of economists’ refutation of the Limits to Growth report (and the ensuing debate with proponents of ecological economics), see chapter 2.2 of Antonin Pottier’s dissertation
It would be enough to replace natural resources with artificial capital (machines).
In 1987, the Brundtland Report Our common future 59 brought the concept of sustainable development to the forefront of the international stage: ” development that meets the needs of the present without compromising the ability of future generations to meet their own needs“. This report gave rise to numerous debates on the concept of sustainability 60 among which emerged the opposition between strong and weak sustainability, one of the dividing lines between standard economics(see Essentials 6) and ecological economics(see Essentials 7).
At the heart of the notion of sustainable development is the idea that present generations must bequeath to future generations the ability to experience a level of well-being at least equivalent to that which they have inherited, based on several “capitals 61 :
- human capital: not only labor, but also skills, the level of training of the workforce and the institutions that contribute to maintaining it (education, health, training systems, etc.);
- productive (or artificial) capital: the durable means of production used to produce goods and services (machinery, buildings, transport infrastructure, etc.);
- natural capital: the planet’s natural resources and purification capacity.
The concepts of weak and strong sustainability 62 oppose each other on the question of substitutability between these different types of capital.
- The concept of weak sustainability focuses on the substitutability of different types of capital: it is always possible to compensate for the destruction of natural capital by increasing the human capital (labor) or physical capital (machines in particular) created by man, thanks to technical progress. In this, he is in line with the work of economists who have challenged the conclusions of the Limits to Growth report that economic growth cannot continue in a world of limited natural resources (see preconceived notion 2).J.M. Hartwick’s 1977article, following on from Solow’s work, is one of the leading references in this field. In it, he sets out a rule of intergenerational compensation, since called Hartwick’s rule, according to which in order to keep consumption constant over time, it is necessary for the rents collected as natural resources are depleted to be reinvested to produce capital (machines) capable of replacing the depleted natural resources.
- The concept of strong sustainability rejects this assumption of unlimited substitutability. Production always requires natural resources, which are available in limited quantities. What’s more, human societies derive benefits simply from the proper functioning of ecosystems (see box), yet these benefits are not necessarily identified and understood (except when it’s too late). Lastly, the disappearance of natural capital is subject to irreversibilities that compromise the choices available to future generations.
Italian economist Mauro Bonaïuti sums up the problem as follows: to think that different forms of capital are substitutable is to think that we could obtain the same number of pizzas by reducing the quantity of flour but increasing the number of ovens or cooks. Even more simply, the air we breathe will never be replaced by an artificial compound in a bottle…
Can we replace bees?
Faced with a reduction in the number of natural pollinators, starting with bees, farmers may resort to hand-pollinating (as is the case in China, for example), or could use drones to pollinate their crops. 63 It’s all about replacing natural capital with human or artificial capital. However, to replace them in agriculture, we would need to mobilize even more natural resources, whether to feed the workers or to build and supply the drones with energy. Moreover, pollinators cannot be reduced to their agricultural role alone: they also pollinate natural environments, play a major role in ecosystems and are part of food chains. Their disappearance would mean the disappearance of many irreplaceable wild plants, which could have formed the basis of new medicines, for example.
While ecological economists agree on the limits to substitutability between capitals, their proposals for dealing with them differ. For some, sustainable development requires at least the maintenance of a critical stock of natural capital. For others, such as Herman Daly, it is necessary to keep the stock of natural capital constant and to raise the question of the size of the economy. To this end, he proposes a set of operational principles to be respected in order to move towards sustainable development: moderate use of non-renewable resources, use of renewable resources that respects their capacity to reproduce, and strict limitation of waste to what can be recycled by natural processes.
Technology will save us!
The argument of saving technology feeds on a belief in human genius and the inevitability of progress. However, when confronted with reality, it is difficult to sustain: never has humanity mobilized technology to such an extent as today, yet ecological problems have only increased; they are, moreover, mainly due to machines and equipment. 64 that science and technology have enabled us to develop.
That said, it could be argued that technology resolutely placed at the service of the ecological transition would be the major solution to the problems of our time.
From a theoretical point of view, as we saw inpreconceived notion 3, relying on technical progress to maintain growth despite limited natural resources is tantamount to assuming that this technical progress will lead to an infinite increase in the productivity of natural resources (i.e. an infinite reduction in the quantity of resources required for a given point of production).
On an empirical level, the following examples cast doubt on the omnipotence of technology to solve our problems.
The rebound effect: energy (or material) efficiency is not enough to reduce consumption.
To reduce energy consumption, certain public policies 65 promote energy efficiency, which consists in harnessing technology to produce goods that consume less energy per unit. Unfortunately, this unitary reduction in energy consumption is generally offset by the “rebound effect”, theorized as early as 1865 by the economist William Stanley Jevons in his book The Coal Question 66. In it, he explains how the increased efficiency of steam engines enabled the use of more machines, leading to a rise in total coal consumption.
History has proved him right. More often than not, increasing the energy efficiency of our equipment does not lead to a reduction in total energy consumption, but rather to the development of new uses for energy. As engineer Philippe Bihouix explains, “Undeniably, the energy consumption of vehicles, aircraft, data centers and industrial processes is falling steadily. But the growth in the number of vehicles, kilometers traveled and data exchanged and stored is far greater than the unit gains. Between 2000 and 2010, Internet traffic increased a hundredfold. What then is an improvement of a few dozen points in energy efficiency per byte worth? This effect can be direct (a drop in the price of a resource increases consumption) or indirect (the increase in purchasing power resulting from efficiency gains is passed on to other energy-intensive products or services).
While energy efficiency remains an important tool for achieving the ecological transition, it is not sufficient on its own. It is important to combine it with energy sobriety, i.e. a voluntary approach to reducing consumption through changes in behavior, lifestyle and collective organization: less car use, less heating, consumption of local and seasonal produce, public transport infrastructure, etc.
To find out more, take a look at our “detailed fact sheet on the rebound effect”.
Technologies aimed at extracting CO2 from the atmosphere (from reforestation to direct extraction of CO2 from the atmosphere) have only “limited potential.”
This is the conclusion reached by the European Academies of Science Advisory Council (EASAC) in its report Negative emission technologies – what role for achieving the Paris Agreement targets? published in early 2018 67. Many scenarios aimed at meeting the Paris Agreement’s objective of limiting global warming to well below 2°C compared with the pre-industrial era involve the massive use of technologies that remove CO2 from the atmosphere. These include reforestation, farming practices that increase carbon storage in soils, bioenergies, CO2 capture and storage directly from the atmosphere or at the source of emissions (e.g. from coal-fired power plants), and ocean fertilization. In the foreword to the report, the President of AESAC warns:
Thinking that technology will save us if we fail to reduce GHG emissions sufficiently can be a seductive vision. If these technologies are seen as a potential fallback solution, this could influence the priorities of mitigation strategies in the short term, as the promise of future cost-effective technologies is politically more attractive than adopting rapid and ambitious mitigation policies now. Placing unrealistic expectations on these technologies could therefore have irreversible and damaging consequences for future generations should they fail to deliver on their promise.
In short, betting on technology presents a risk: that of wasting time by postponing action to reduce CO2 emissions today, in the name of uncertain promises. In this respect, EASAC’s conclusions are clear:
These technologies offer only limited realistic potential for removing carbon from the atmosphere, and not on the scale envisaged in some climate scenarios (up to a few gigatons of carbon each year after 2050). Negative-emissions technologies may have a useful role to play but, on current evidence, not at the levels required to compensate for the inadequacy of mitigation measures. (…) Furthermore, attempts to deploy these technologies on a larger scale would entail significant uncertainties as to the extent of CO2 removal that could be achieved, as well as high economic costs and likely major impacts on terrestrial or marine ecosystems.
The authors of the report are not calling for research in this field to be abandoned, or for the deployment of these technologies to be halted when they are operational (particularly those aimed at biological storage via reforestation and cultivation practices), but for them to stop being seen as a “miracle solution”.
Find out more
- Rethinking Climate and Energy Policies: New Perspectives on the Rebound Phenomenon – T. Santarius, H.J. Walnum, C. Aall (Springer 2016)
- Negative emission technologies – What role in meeting Paris Agreement targets? (EASAC 2018)
- The challenges of carbon capture and storage technologies, Nourritures Terrestres blog (2021)
- The myth of saving technology – Philippe Bihouix – Revue Esprit (2017)
The digital revolution could be the ally of the ecological transition
The digital revolution is often presented as the ally of ecology: teleworking, collaborative platforms, e-commerce, “dematerialized” uses (books, films, music), transport and connected objects, “intelligent” networks, buildings and cities will come to our rescue to optimize and reduce our consumption of resources and consequent pollution. This preconceived notion is in fact a variation on the previous one, as technological progress is now equated with digital technology.
Here are a few examples of how the digital revolution, in its current form, is more of a hindrance than a help to the ecological transition.
The digital revolution is very material
Although the literature on the material impacts of the digital revolution is still emerging, it already serves to refute arguments about the supposed “dematerialization” of the economy that it would enable.
-Digital technology would allow us to dematerialize many of our uses. Instead of filling our homes with books, CDs and DVDs, we could make do with a tablet. In a literature review analyzing some thirty articles on the effects of the digitization of goods (replacement of material goods _ books, newspapers, music, films, video games_ by their digital equivalent), two researchers showed that not only was this substitution not always favorable in energy terms, but that none of the studies reviewed took account of the rebound effect.
-The digitization of the economy is very energy-intensive, both for production and for the use of equipment: servers, WiFi hotspots, relay antennas, routers, terrestrial and submarine cables, satellites, data centers, and multiple terminals (computers, smartphones, tablets). According to the think tank The Shift project, the digital sector is now responsible for 4% of the world’s greenhouse gas emissions, and its energy consumption is growing by 9% a year. The ever-accelerating pace of renewal, and the race to increase data rates, suggest that these emissions and consumption will accelerate, even though the social utility of more and more digital technology is never questioned. As Hugues Ferreboeuf and Jean-Marc Jancovici put it so clearly in an article warning of the energy and economic impacts of 5G deployment in France: “aren’t we confusing, like an excited kid on Christmas Eve, what’s new with what’s useful, what seems urgent with what’s important?”
Breakdown of digital energy consumption by item
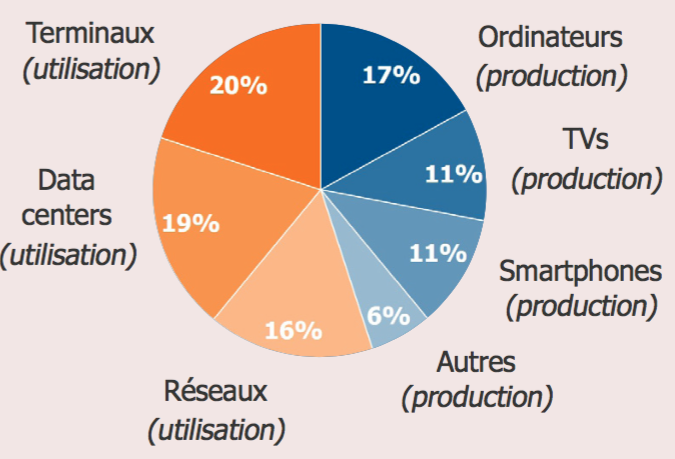
Source Lean ICT Project, The Shift Project 2018
Energy consumption in the digital sector is 45% linked to production (in blue) and 55% caused by the use of equipment (80% of which is for video use).
The production of telecoms networks, data centers and billions of terminals (computers, smartphones, TVs and connected objects) also requires increasing quantities of rare and/or critical metals, the extraction and processing of which have major impacts in terms of pollution and disruption of ecosystems. What’s more, these metals are often present in very small quantities in the many different types of digital equipment, and are mixed together, making them very complex, if not impossible, to recycle.
The digital industry, which claims to be “disruptive”, thus continues to be part of the productivist, environmentally predatory culture typical of the last century.
The digital economy competes with the ecological transition
Another less obvious but very real reason is that the digital revolution is often more a competitor than an ally of the ecological transition.
First of all, many of the metals used in digital equipment are also required for energy transition technologies (renewable energies, electric cars, LEDs, batteries, etc.). Their growing consumption may therefore give rise to conflicts of use.
When it comes to public policy objectives, and therefore regulations designed to guide economic activity, the digital revolution is often placed on the same level as the ecological transition. This can be seen when reading the European Commission’s 2019-2024 strategic priorities, the French government’s proposed 2019 Productive Pact, or the objectives put forward for recovery plans following the COVID19 crisis. Maintaining the habitability of our planet is therefore placed on the same level as the pursuit of technological progress, now equated with digital technology.
If we consider the financial and human resources mobilized to drive these two revolutions, digital technology is far ahead of ecology. Silicon Valley is an almost caricatural example of this, as Jacques Attali aptly notes in an article for Les Echos: “In California, you can make a much better living developing the latest video game than designing software capable of reducing energy consumption, saving water or improving education and health. And even more so than building bridges, roads, waste management plants, dams or power plants.”
Symbolic, psychological and social obstacles to the ecological transition
In an enlightening article, economist Eloi Laurent shows that, in addition to its highly material dimension, the all-digital world also brings with it more symbolic, psychological and social obstacles to the ecological transition. Without wishing to retrace the whole of the author’s thinking here, here are a few highlights. Characterized by instantaneity and the hypertrophy of the virtual sphere, the digital transition is distancing us from the reconnection with reality and the ability to think in the long term that are so necessary to the ecological transition. By gradually colonizing non-work time (family, friends, love), monopolizing people’s attention and inducing permanent diversions, the multiplication of our connected screens limits and slows down the capacity for social cooperation over the long term.
The digital transition thus locks individuals into high-frequency, low-intensity societies of intermittence and diversion, whereas the social and ecological challenges of the early 21st century demand maximum, continuous social energy. It encourages the hypertrophy of the virtual world (video games, digital photographs, social networks) in proportion to the atrophy of the real world.
Find out more
- Publications on the environmental impacts of digital technology – The shift Project
- L’Enfer numérique. Voyage au bout d’un like, Guillaume Pitron, (2021)
- What if we’re making the wrong transition? For an ecological Luddite – Eloi Laurent
- L’impasse collaborative – Pour une véritable économie de la coopération, Eloi Laurent (Les Liens qui Libèrent, 2018)
The myth of the dematerialization of the economy
The dematerialization of the economy would mean that, as a country’s economy develops, it would use fewer and fewer natural resources and generate less and less waste and pollution. This vision is underpinned by the predominance of the service sector in high-income economies, and by talk of the benefits of digital technology, which would enable us to dematerialize many uses (books, music, films), reduce travel (telecommuting, online shopping, videoconferencing) and optimize energy and resource consumption (smart grids). To what extent is this vision based on an analysis of reality?
There is no global dematerialization. On the contrary!
In concrete terms, dematerialization implies a decoupling of economic growth, resource consumption and pollution. This can take two forms.
- Relative” decoupling: the quantity of matter or pollution concerned grows less quickly than GDP.
- Absolute” decoupling: economic growth is accompanied by an absolute decrease in the consumption of natural resources and pollution from one year to the next.
At the global level, we can see a relative decoupling in certain areas.
- Energy intensity fell from 0.166 toe per $1,000 of GDP in 1990 to 0.12 toe in 2014.(Source)
- Material intensity rose from 1.7 kg per $ of GDP in 1970 to 1.47 in 2015.(Source)
- GHG intensity (excluding land-use change) from 613 gCO2eq per unit of GDP (in USD) in 1990 to 423 in 2015(Source).
Unfortunately, this relative decoupling, far from sufficient to counterbalance global economic growth, has not translated into absolute decoupling. At global level, the curves of energy consumption, material extraction and GHG emissions have only increased.
Focus on the material extraction indicator: the re-materialization of the economy from the 2000s onwards
The physical quantity of materials extracted is a global indicator of mankind’s pressure on the planet. It aggregates biomass (crops, crop residues, grazed biomass, wood and fishing), fossil fuels, metals and non-metallic minerals (sand, gravel, clay).
Resource extraction has increased more than 3.5-fold in 50 years, from 30 billion tonnes in 1970 to 106 billion tonnes in 2024.
The momentum accelerated in the early 2000s, with growth in resource extraction rising from an average of 2.1% per year between 1970 and 2000 to 3.5% between 2000 and 2012. This is largely due to major investment in infrastructure and improvements in material living standards in middle-income countries, particularly in Asia. After a slowdown (1% growth) in the 2010s following the economic consequences of the financial crisis and the pandemic, the trend is now up again (2.9% per year).
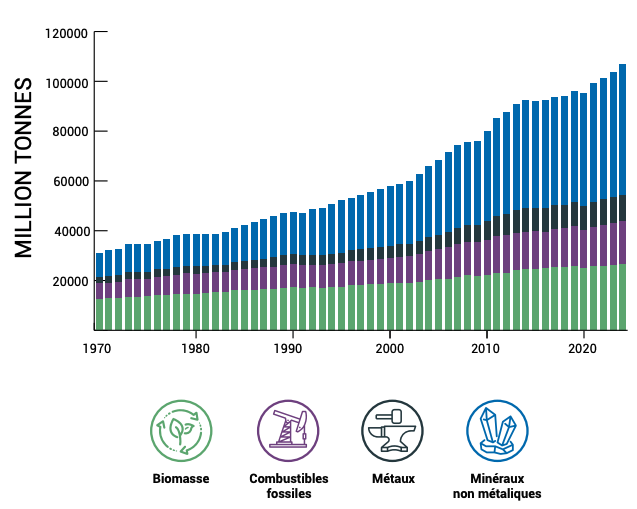
Source Global Resources Outlook 2024 Executive Summary (Figure 2a)
As the authors of the Global Ressources Outlook 2024 note, “The acceleration in global raw materials extraction since 2000 has coincided with a slowdown in GDP and population growth. One of the factors behind this phenomenon is probably the disproportionate concentration of GDP growth in economies that are moving from an agricultural to an urban and industrial economic mode, which is particularly intensive in the use of raw materials and energy.”
What is the situation in developed countries, which are characterized by a service economy?
In The Conditions of Economic Progress (1940), English economist Colin Clark devised a typology separating economic activities into three main sectors: the primary sector (agriculture, fishing, forestry), the secondary sector (extraction, processing, construction, water, energy, waste management) and the tertiary sector, which includes everything else and is often equated with the service sector.
Almost everywhere, economic development has been accompanied by a growing share of the tertiary sector to the detriment of the other two, both in terms of employment (see the INSEE website for European Union countries) and GDP: in high-income countries, the tertiary sector accounts for almost 70% of GDP. This shift to a service economy would be concomitant with dematerialization, since the service sector, unlike industrial and agricultural activities, is not based on the extraction and subsequent transformation (which consumes natural resources and generates pollution) of raw materials into products.
First of all, in many high-income countries, there is an absolute decoupling between economic growth and certain environmental impacts.
For example, the European Union’s GHG emissions peaked at 6.3 GtCO2eq in the late 1970s, then fell to 4.5 GtCO2eq in 2015 (see here). This is also the case in the USA, where emissions fell between 2007 and 2015 from 7.1 to 6.4 GtCO2eq (however, this trend is too recent to conclude that there is a permanent decoupling between GDP and GHGs in the USA, particularly in the context of the Trump presidency).
However, this is not the case in all high-income countries. Above all, it remains largely insufficient. While there is little room for progress through the tertiarization of the economy 68emissions per capita are still well above what would be required to keep global warming below 2°C.
The authors of a recent meta-analysis have highlighted the clear inadequacy of these results. After studying 835 research articles on the subject of decoupling GDP from various ecological variables (GHG emissions, final energy, material consumption), they conclude:
rapid and significant absolute reductions in resource use and GHG emissions cannot be achieved through the observed decoupling rates; decoupling must therefore be complemented by sobriety-oriented strategies and strict enforcement of absolute emission reduction targets.
There are several reasons why the advent of the service company has not led to dematerialization.
- The tertiary sector encompasses a wide range of activities, some of which, such as transport, consume a great deal of energy and generate pollution. Moreover, the classification of different sectors is based on conventions that can be misleading. For example, whatever the occupation, workers are classified according to their employer’s main activity. For example, temporary work is classified in the tertiary sector, even when employees work in industry or construction. The same applies when an industry outsources guarding, cleaning or security activities to service providers. Read more in this article.
- Just because the share of industry and agriculture in global production has declined in value terms, this does not mean that the volumes produced and the raw materials used have also fallen. This is particularly evident on a global scale. The share of the primary sector (agriculture, forestry) in value added has fallen from 7.5% to 4% since the 1990s(see here), yet the production of cereals and meat has only increased. Clearly, a reduction in value does not mean that less land is being farmed, or that fewer quantities are being produced, or that fewer inputs (water, fertilizers, pesticides) are being used. The same reasoning applies to the secondary sector (industry and manufactured goods), whose share of value added has risen from (see here).
- Service economies rely heavily on agricultural and industrial production, whether domestic or imported.
The materiality of service savings is even greater when we consider consumption and not just national production.
While the share of industrial and agricultural activities has actually declined in developed countries in favor of services, this is not the case for consumption, which has continued to grow. As a complement to the approach based on national production alone, it is therefore interesting to analyze cross-border flows: we buy raw materials, manufactured products or industrial machinery from abroad, whose environmental impact can be seen outside our territory. The notion of footprint is the key to understanding this phenomenon. It consists in calculating the pressure of a country’s domestic consumption on a specific environmental datum. The best-known and best-documented isthe “carbon footprint“. 69.
The carbon footprint represents the quantity of greenhouse gases (GHG) induced by a country’s domestic final demand (household consumption, public administration, non-profit organizations, investment), whether these goods or services are produced domestically or imported. The carbon footprint is therefore made up of: i/ direct GHG emissions from households (mainly linked to the combustion of fuel for private vehicles and the burning of fossil fuels for home heating); ii/ GHG emissions from the domestic production of goods and services for domestic demand (i.e. excluding exports); and iii/ GHG emissions associated with imported goods and services, for intermediate consumption by companies or for final use by households. By taking into account the greenhouse gas content of imports, the carbon footprint makes it possible to assess the pressure on the climate of French domestic demand, whatever the geographical origin of the products consumed.
Comparison of France’s carbon footprint and direct emissions from the national territory
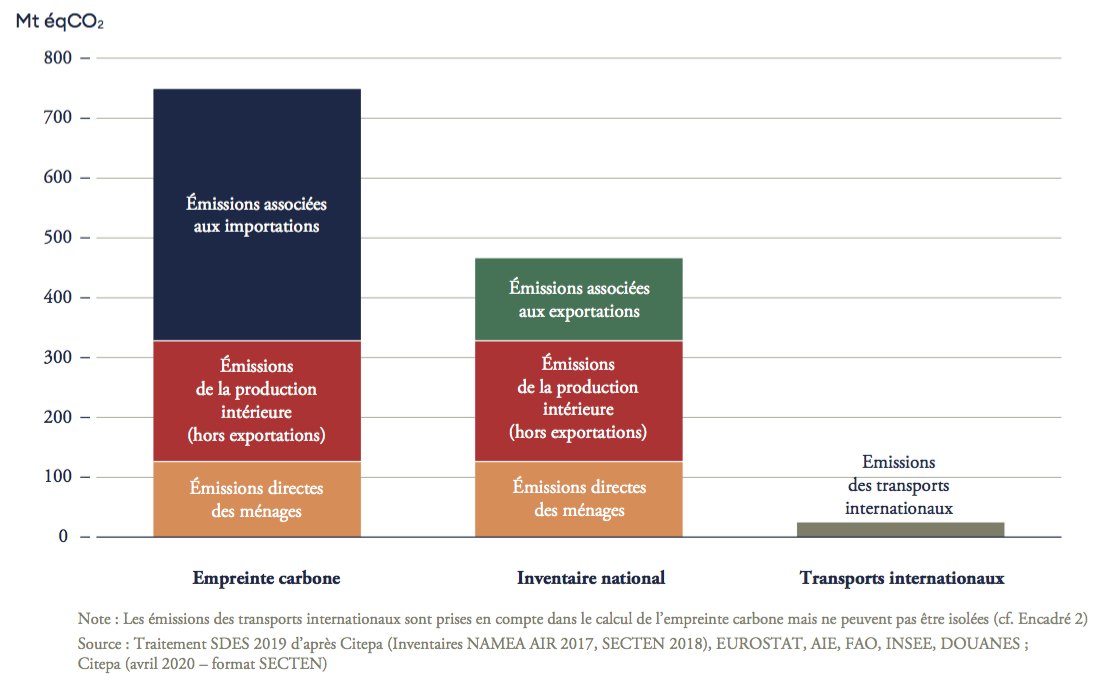
Source Maitriser l’empreinte carbone de la France (Figure 3), Rapport du Haut Conseil pour le Climat (2020)
France’s carbon footprint is around 70% higher than its territorial emissions (which correspond to those on which the country has made international climate commitments).
Footprint calculations are also available for other types of environmental impact. For example, thewater footprint (also known as virtual water) or the material footprint, which represents the total quantity of raw materials extracted to satisfy end-consumer demands.
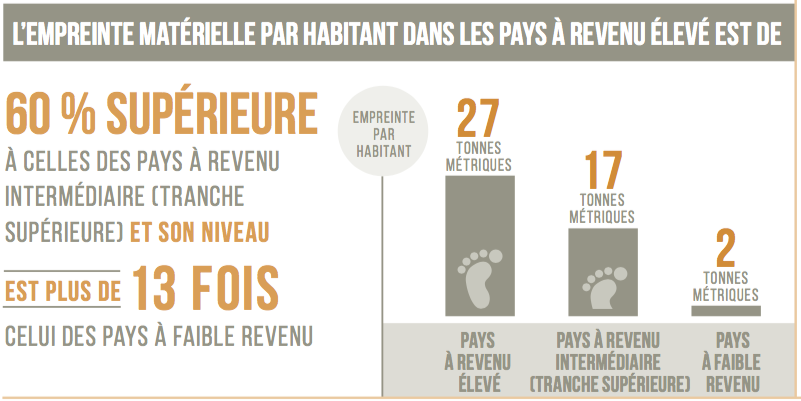
Source Report on Sustainable Development Goals – UN (2019)
Above a certain income level, the state of the environment improves
A common misconception is that, beyond a certain stage of economic development, the state of the environment improves with economic growth. As basic needs are met, social demand for a healthy environment increases, leading to public regulations that limit pollution and promote environmental technological innovation. As the regions concerned are wealthier, they have the financial resources to allocate to improving environmental quality.
This assertion was popularized by the work of Grossman and Krueger (1994), who demonstrated the phenomenon for four environmental indicators in the USA (one on urban air quality and three on river pollution): pollution would increase with per capita income, then decrease above an income of $8000/year. The curve of their result is called the “Kuznets environmental curve” because its ∩ shape is similar to that of Simon Kuznets ‘ work 40 years earlier on the link between inequality and per capita income.
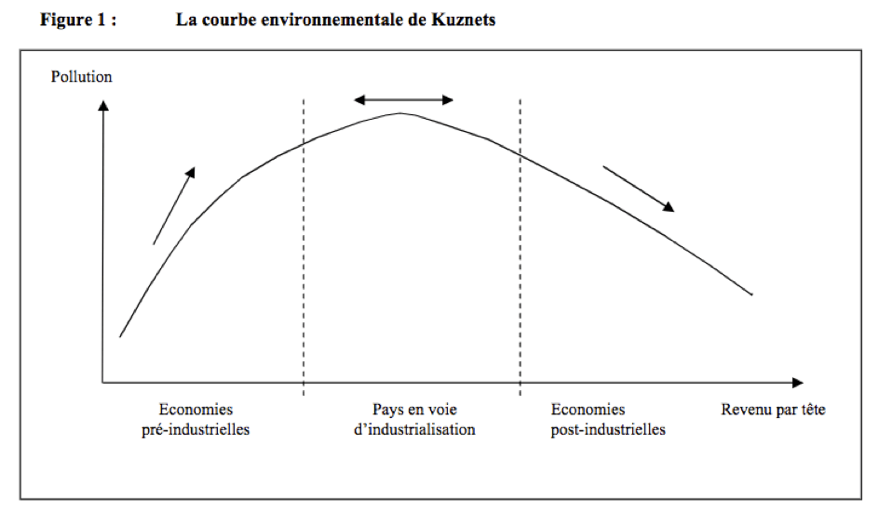
Source Meunié A. (2004). Controversies surrounding the Kuznets environmental curve
This theory is attractive because it explains that growth becomes self-sustainable: there’s no need to fundamentally change our model of economic development; at most, we need to redirect investment towards green innovations. Its proponents often present it as an “optimistic” theory, as can be seen in the article Sortir du pessimisme écologique (in which other preconceived ideas are also found: the importance of technological solutions, the ability of the price system to prevent resource shortages).
The strength of this argument lies in the fact that it is based on empirical evidence: indeed, as a country becomes wealthier, social demand for a healthier environment increases; a number of studies clearly demonstrate a correlation between pollution reduction and GDP levels. This is shown, for example, by the meta-analysis carried out by Bishwa Koirala, Hui Li and Robert Berrens in 2011, which includes 878 observations drawn from 103 empirical studies on the Kuznets curve carried out between 1992 and 2009.
There are, however, several fundamental counter-arguments.
- While reductions in certain types of pollution can be observed at local or national level, this is clearly not the case at global level: the volume of waste (particularly plastic), greenhouse gas emissions and nitrogen concentrations in coastal areas are just a few examples of ever-increasing pollution curves. Assuming that the Kuznets curve really is true, if we wait until humanity as a whole reaches a sufficiently high standard of living for the trend to reverse itself, it will be far too late to preserve the planet’s habitability for the human species.
- It’s undeniable that in developed countries, environmental standards and regulations help to reduce the pollution emitted by agricultural, industrial and mining activities. The same is true of health regulations concerning the quality of drinking water, waste and wastewater treatment. However, this move to regulate local economic players has gone hand in hand with numerous relocations to low-wage countries with few (or no) environmental regulations, as well as the massive export of waste (and the pollution that goes with it).
- The Kuznets curve is not observed for global pollution, and in particular for greenhouse gas emissions. This is one of the major conclusions of the 2011 meta-analysis cited above:“the literature on the environmental Kuznets curve provides no basis for predicting that continued economic growth will lead to a significant reduction in CO2 emissions, in the absence of specific policy measures to that effect.”
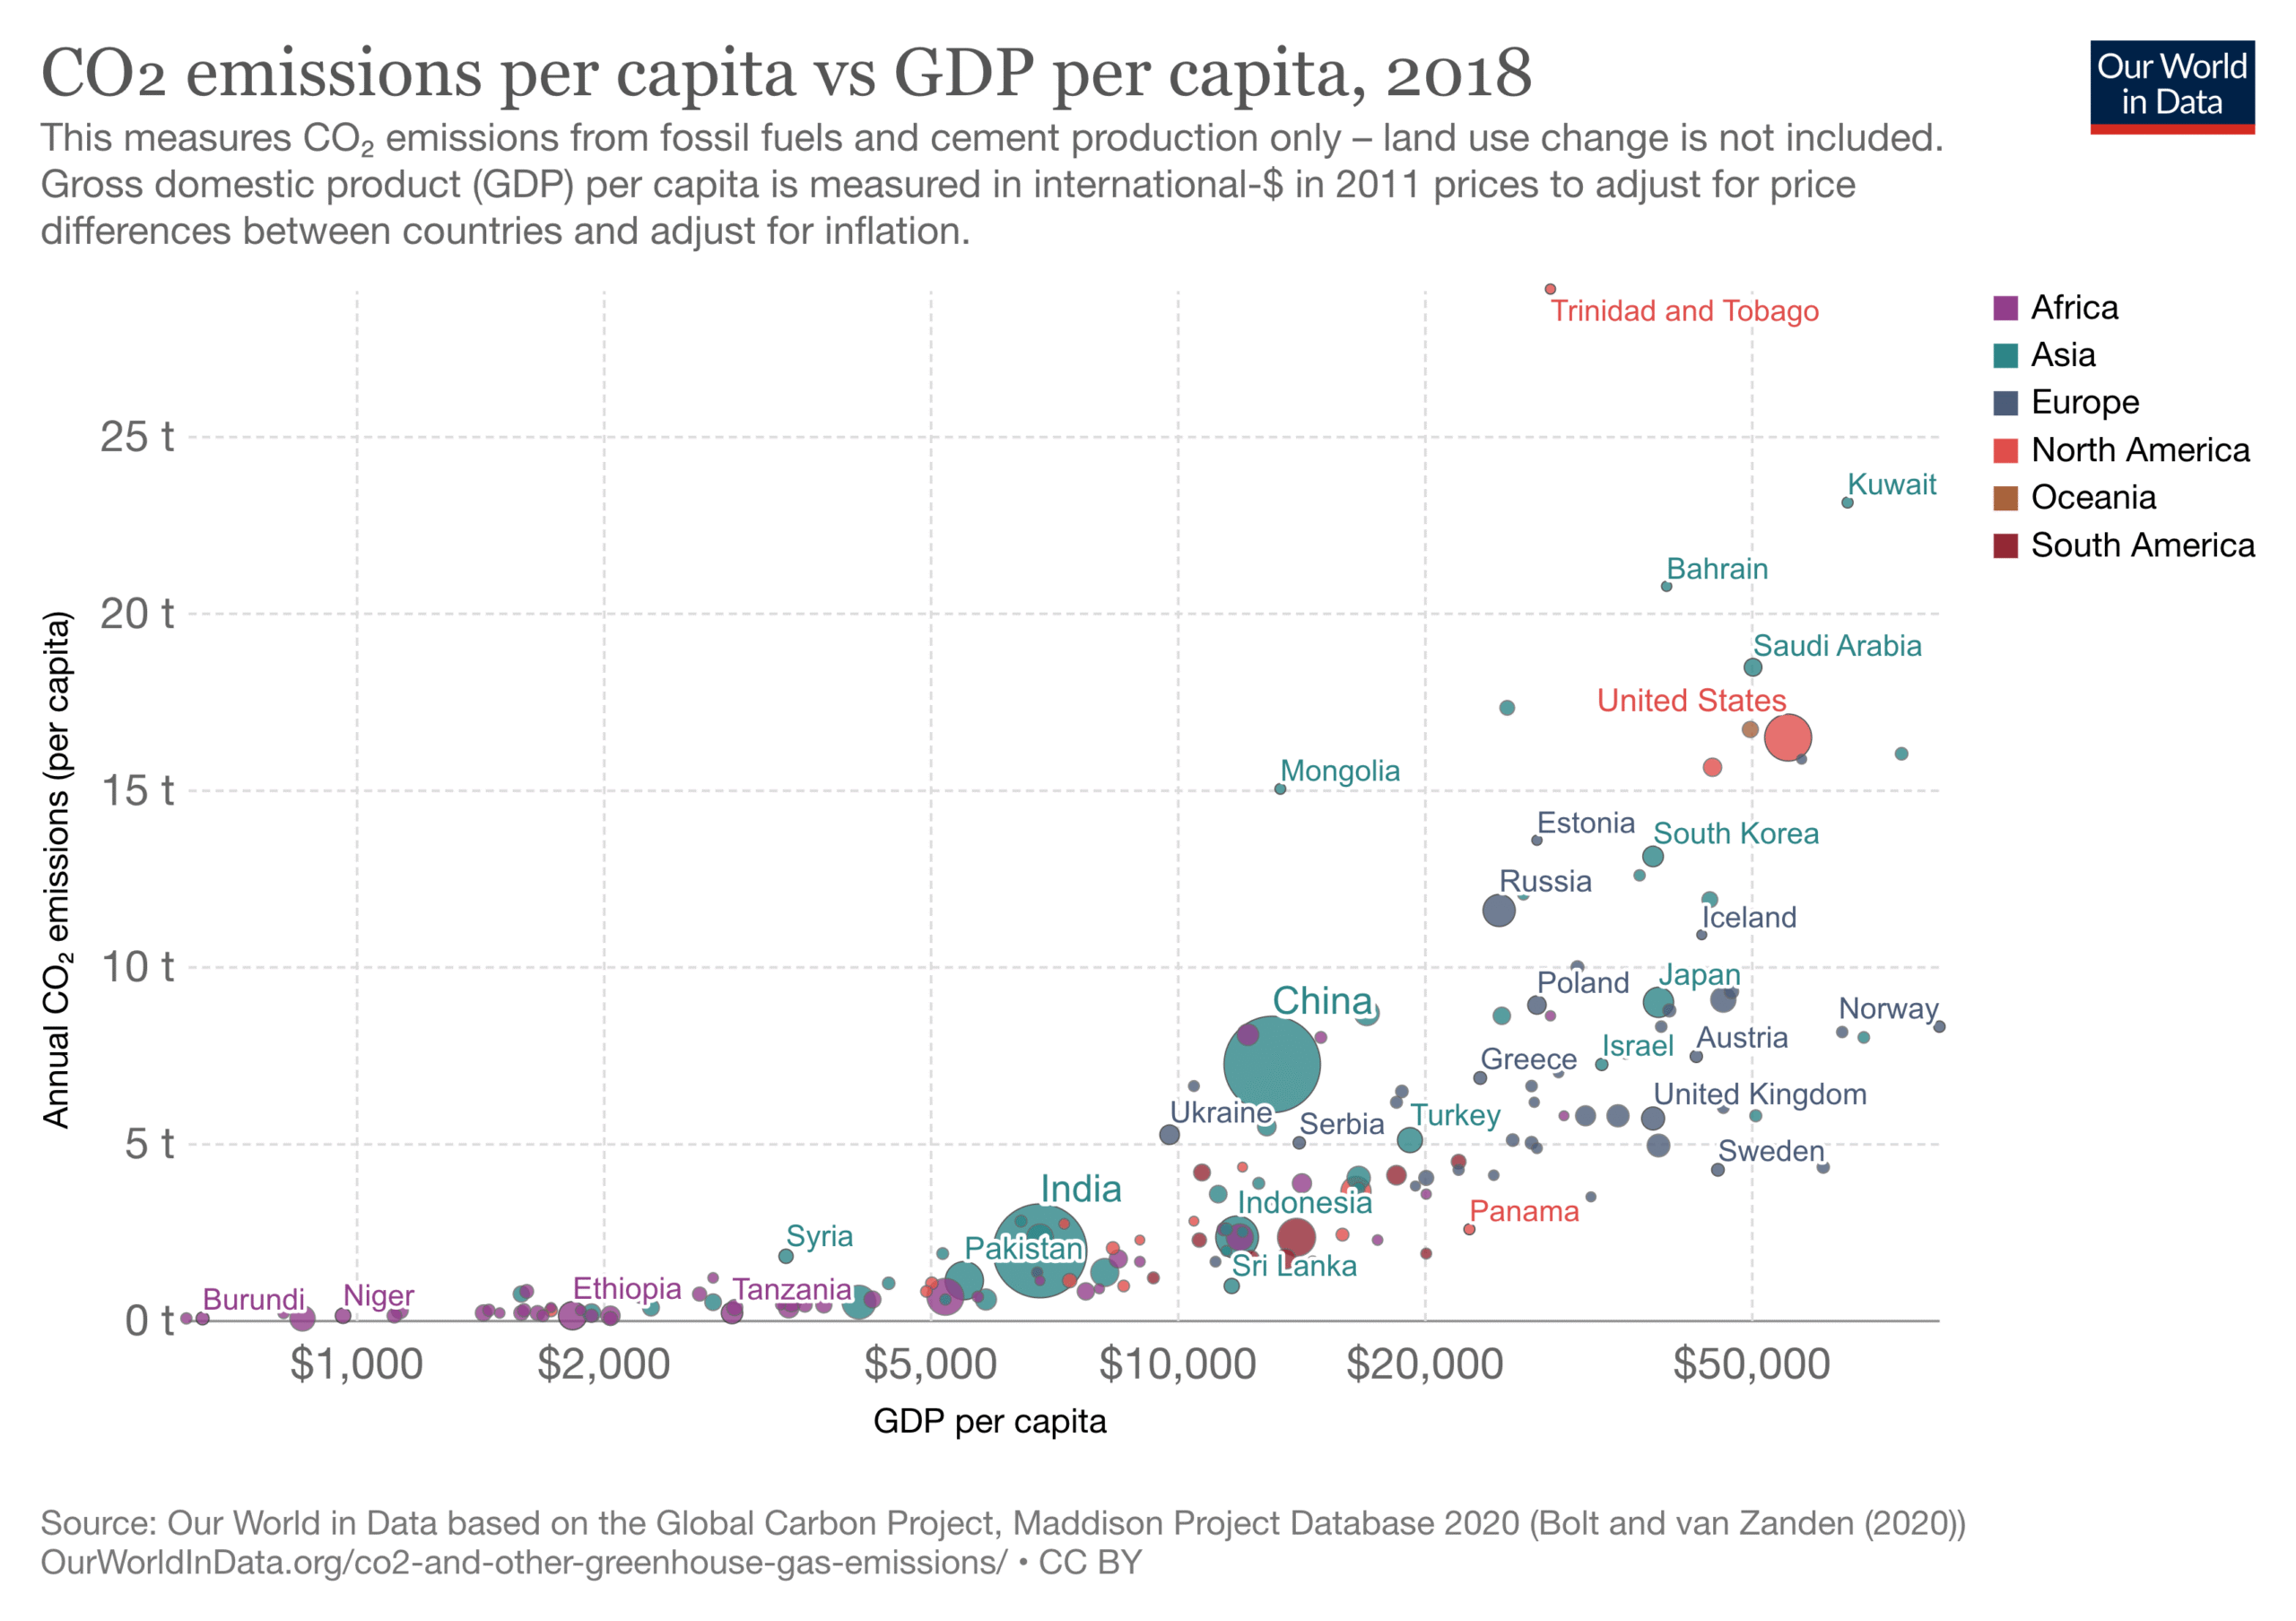
The graph above shows a fairly clear correlation between level of development and CO2 emissions. Some might retort that, for certain countries, we’re beginning to see a decoupling between per-capita GDP and per-capita CO2 emissions (e.g. UK, USA, France, Germany _ see graphs here). Nonetheless, these countries are still in the high range of CO2 emissions per capita. In terms of global pollution, the developed countries remain among the biggest polluters.
All these factors show just how wrong and dangerous it is to expect economic growth and technological innovation to solve the problem on their own. What we need is a different kind of development, one that takes into account the pollution and impacts we wish to avoid or reduce.
The ecological crisis is linked above all to demographics
Clearly, the pressure of humanity on the planet depends on the number of humans and the lifestyle of each individual. 70. A number of recurrent statements on this subject emphasize the demographic dimension: there are already too many people on the planet; it is a priority to regulate births, particularly in countries where they are most important, i.e. the countries of the South. But what does this mean in practice, and what role do demographics and lifestyle play in the current ecological crisis?
What does it really mean to limit population growth?
First of all, it’s worth recalling a few orders of magnitude. Humanity today numbers 7.7 billion people. Over the period 2015-2020, there were an average of 140 million births and 57 million deaths per year 71. Stopping population growth would therefore mean around 80 million fewer births or 80 million more deaths, the equivalent of the greatest catastrophes experienced by humanity over the last two centuries. 72.
Since no one openly calls for massive genocide, global pandemics (far more deadly than COVID 19), famines affecting the entire planet or other catastrophic scenarios 73it’s mainly the evolution of the birth rate that we need to look at.
According to the central scenario of the UN’s World Population Prospect (WPP) 2019, the world’s population is set to increase by 2 billion to reach 9.7 billion in 2050. As can be seen in the following graph, these projections incorporate fairly substantial assumptions for a reduction in the fertility rate: at global level, it would fall from 2.5 children per woman today to 2.2 in 2050, and would almost everywhere approach the generation replacement rate (2.1 children per woman). Only in sub-Saharan Africa will fertility remain significantly higher (from 4.6 children per woman today to 3.1 in 2050). 74. The WPP 2019 also studies a “low” scenario, with in particular a fertility rate in sub-Saharan Africa of 2.7 children per woman in 2050 (i.e. 2 children less in one generation), but the population still reaches 8.9 million in 2050.
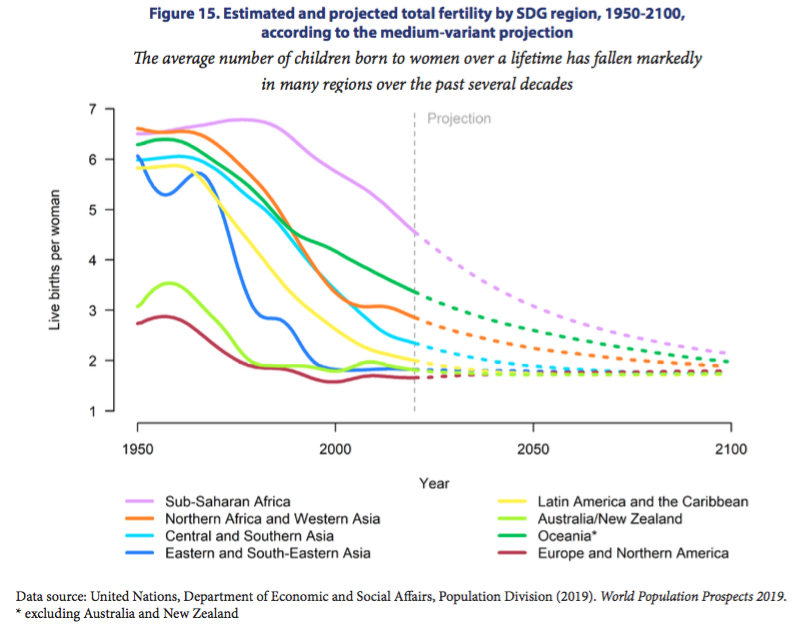
Source World Population Prospects 2019 – Higligths (p 23)
Nevertheless, birth control policies are needed in regions of the world where the birth rate is high, for ecological and above all social reasons: countries with high birth rates are among the world’s poorest. For demographer Hervé Le Bras, the key to these policies“lies with women, and can be summed up in two words: education and autonomy” (education beyond primary school and the ability to decide for themselves about their fertility). Given that many high-birth-rate regions are experiencing political instability and even conflict (both of which are unfavorable to women’s emancipation), there seems little room for maneuver to outpace projections.
Some don’t hesitate to recommend authoritarian policiessuch as the one-child policy introduced in China in the 1970s. First of all, it should be noted that this type of measure has consequences other than just a drop in fertility (forced abortion and sterilization, boy-girl imbalance, hidden children, infanticide and child abandonment, human trafficking, rapid aging of the population and imbalance between generations). It is also, and above all, totally unrealistic to envisage it on a large scale: INED’s simulator of world population trends shows that to reach a population peak of 8 billion in 2050, we would need to adopt a global fertility rate of 1.5 children per woman from today throughout the world.
As demographer Henri Leridon writes, projections to 2050 are largely determined by the size of the current generations of “reproducers” (mothers…).
It therefore seems rather pointless to expect the world population to fall by 2050, unless fertility completely collapses and whole generations refuse to reproduce. This is mainly due to the inertia acquired during the years of strong demographic growth: the age structure of the world population still bears the trace of these years, with numerous generations of reproductive age contributing to a relatively high number of births despite a fairly low average fertility per woman.
Demographics and climate
Keeping global warming below 2°C above pre-industrial levels is one of the major challenges of the 21st century. Is limiting population growth a key variable in meeting this challenge?
Let’s start by stating the obvious.
- Humanity’s greenhouse gas emissions in 2015 totaled 49 GT CO2eq (excluding land-use change). 75. Meeting the Paris Agreement target implies reducing them to 0 by around 2050-70 (in reality, residual emissions remain, offset by physical and biological sequestration). The efforts to be made on the existing production system are therefore already considerable, independently of demographic growth.
- The historical responsibility for emissions is very clearly tilted towards the countries that were the first to embark on economic development. In 2018, the EU28, the USA and China were responsible for 60% of cumulative fossil CO2 emissions since 1850.
- Per capita GHG emissions are largely correlated with standard of living (measured by GDP/capita).76. See Our World in Data for a graph on CO2 alone.
Let’s take a look at emissions over the last few decades. Between 1970 and 2015, the world’s population doubled, as did GHG emissions. A cursory analysis might suggest a cause-and-effect relationship. However, this is far from being the case, given the contrasting situations between countries, as illustrated by the graph below.
Trends in GHG emissions by the 4 largest emitters 1970-2015 (Mt CO2eq)
MISSING DATAVIZ: 947775cb-b1c7-4969-8452-c466b3291483Source EDGAR database (does not include land-use change)
In 2015, the top 4 emitters were responsible for 56% of global GHG emissions for 48% of the population.
Among them are two demographic giants: India and China. In both cases, economic growth is primarily responsible for the increase in emissions.
- China’s population has multiplied by 1.7 since 1970, and the country’s emissions by 6.5, to account for over a quarter of global emissions in 2015. It is therefore economic development (of both the country and its customers, as China has become the world’s factory) rather than demographics that has made China the world’s leading emitter. If population had been the sole determining factor, Chinese emissions in 2015 would have amounted to 4 GteqCO2 (i.e. 9 GteqCO2 less, 20% of global emissions).
- In India, the dynamic is similar (population multiplied by 2.5 and emissions by more than 4), even if the economy’s share is smaller, as the country remains among the poorest in the world.
In the countries of the industrial revolution, per-capita emissions have fallen, leading even in Europe to a reduction in absolute emissions (with the USA increasing its emissions by 13% compared to 1970). Despite this, the USA and EU28 remain responsible for 22% of global emissions (for 11% of the population), almost as much as the Chinese and considerably more than the Indian giant.
It should also be noted that the reasoning here is based on countries’ national emissions. The conclusions would be different if the analysis were based on the carbon footprint, which focuses not on national production but on consumption (and therefore includes emissions linked to imports). As seen in misconception 7 on the dematerialization of the economy, France’s carbon footprint is much larger than its direct emissions.
What about demographic projections?
According to the UN’s World Population Prospect 2019, more than half of the population growth expected between now and 2019 (1 billion people) will come from 9 countries: India, Nigeria, Pakistan, DRC, Ethiopia, Tanzania, Indonesia, Egypt and the USA. Given the very low per capita CO2 emissions of these countries (with the exception of the USA), this would imply an increase of 3 Gt of CO2 (including almost 1 Gt for the USA alone).
Isn’t it a clear priority to reduce the emissions of the biggest emitters and prevent the major demographic countries from following the carbon-intensive development path that has been humanity’s up to now? To take just two examples, if the United States were to reduce its per capita emissions to the level of the European Union (which is still very inadequate in terms of the Paris Agreement), it would divide its overall 2015 emissions (including population growth) by 2. Symmetrically, if India were to follow China’s path (but without increasing its population), it would emit nearly 13 GTeq CO2 in 2050, i.e. 4 times its current emissions.
Natural resource extraction and demographics
The physical quantity of matter extracted is another global indicator of mankind’s pressure on the planet, encompassing biomass (crops, crop residues, grazed biomass, wood and fishing), fossil fuels, metals and non-metallic minerals (sand, gravel, clay). Global figures already make it clear that demography is not the only variable explaining this pressure: resource extraction rose from 27 million tonnes in 1970 to 92 in 2017, a more than 3-fold increase. At the same time, as already noted, the world’s population doubled.
When we think in terms of territories, the material extraction indicator can be expressed in three different ways:
- the extraction of materials directly produced in the region;
- apparent domestic consumption of materials (materials extracted directly in the country + imported materials – exported materials)
- the material footprint, which attributes to the final consumer all the resources mobilized worldwide: it therefore adds to apparent domestic consumption the materials incorporated in imported objects and machines (and subtracts exports).
Depending on the perspective adopted, the weight of the different territories is clearly not the same, as shown by the following two graphs, which compare domestic consumption and material footprint according to the four income groups of the countries.
Domestic material consumption and material footprint by income level
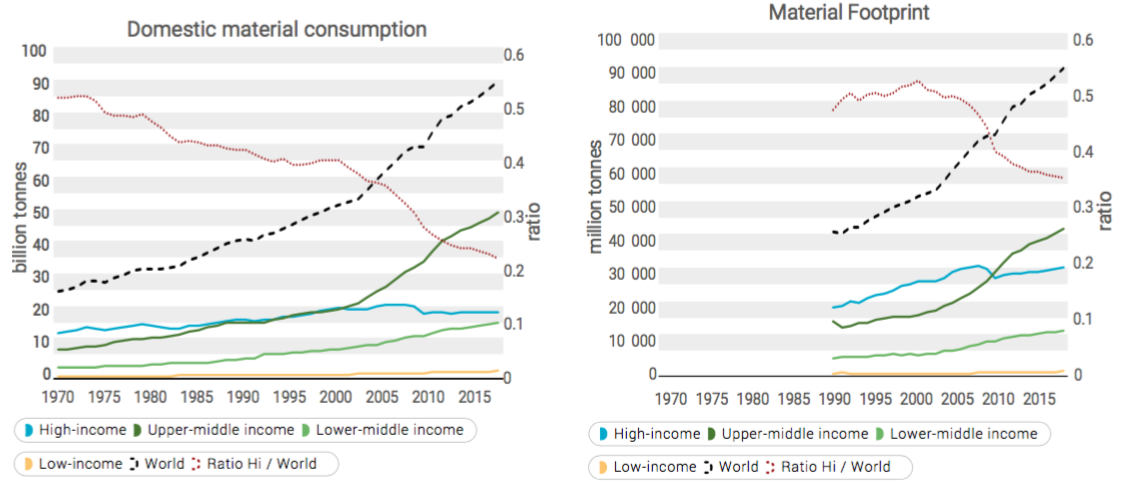
Source Global Ressources Outlook 2019 (Fig. 2.21 and 2.25). “Hi/World ratio” (right-hand scale) indicates the share of High Income / world.
- The material footprint of upper-middle-income countries (to which China belongs) is steadily increasing (reflecting their economic development), but remains lower than their domestic consumption: this reflects China’s role as the “workshop of the world”.
- The material footprint of high-income regions is greater than their domestic material consumption: this indicates that consumption in these countries depends, in part, on materials sourced from other countries via international supply chains.
- Countries with “lower-middle” and “low” income levels (which are therefore those most in need of materials for their development) account for just 22% and 18% of global consumption respectively.
Relative to the population, these figures are even more disproportionate. This is one of the key messages of the Global Resources Outlook 2019.“The material footprint in high-income countries is around 27 tonnes per person, 60% higher than the upper-middle income group in 2017 and more than 13 times the level of the low-income group.”
Environmental impact
Let’s add one last point: the issue of resource extraction and distribution is important not only because humanity does not have infinite reserves, but also because of the environmental impact.
Environmental impact of extracting and transforming resources into materials, fuels and foodstuffs
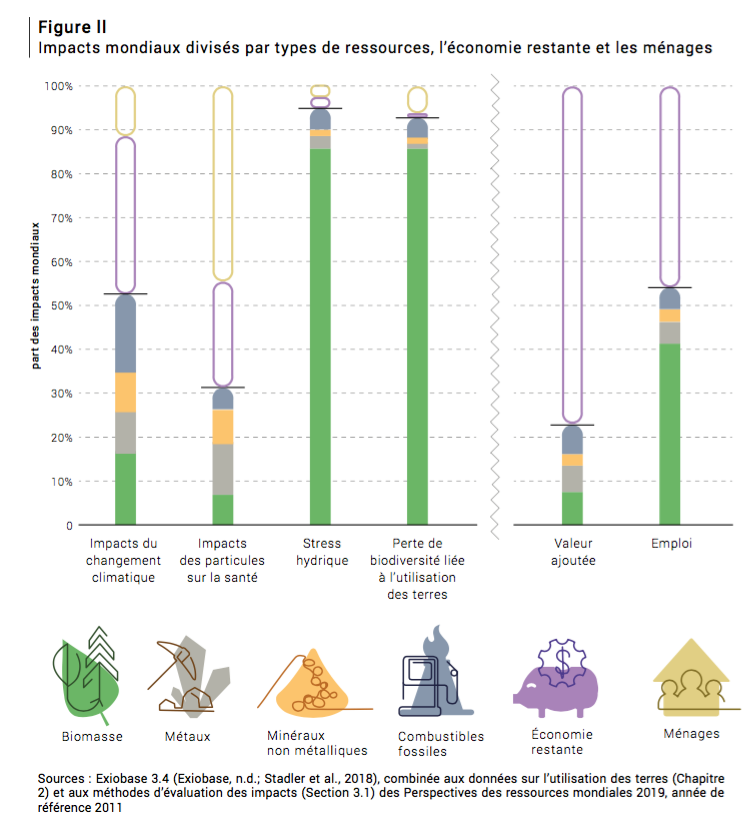
Source Global Ressources Outlook 2019 – Résumé pour décideur en français (p16)
According to the Global Resources Outlook,“the extraction and transformation of resources into materials, fuels and food accounts for around half of the world’s greenhouse gas emissions (without taking into account land-use-related climate impacts) and more than 90 percent of biodiversity loss and water stress.” (Summary for decision-makers FR p15). Yet these impacts obviously take place where the direct extraction of materials takes place: countries that outsource the most material- and energy-intensive stages of production chains also outsource environmental impacts, both global (such as GHG emissions) and local (water resources, destruction of space and biodiversity, etc.).
Find out more
Some articles and interviews
- World population: towards explosion or implosion? Population & Sociétés (2020)
- Demographics and climate – Ecosophical inquiry blog
- 10 billion people, so what? Interview with Hervé Le Bras and Gilles Boeuf – Le Monde (2017)
- Hervé Le Bras: “The demographic explosion is behind us” – La Croix (2020)
Educational tools on population trends
Improving the state of the environment depends above all on individual behavior
On wikiHow, you’ll find a 17-step guide to saving the planet: saving water and energy in the home, buying locally and responsibly, using environmentally-friendly means of transport and so on. This guide is in line with a number of speeches that place changing individual behavior at the heart of solving ecological crises, whether through daily activities (water and energy consumption, waste sorting, modes of transport) or consumer choices (taking environmental criteria into account when making a purchase).
Of course, changes in individual behavior are fundamental, and initiatives to disseminate these concrete actions are important. When you consider that a return trip from Paris to New York for one person emits as much GHG as that person’s average annual heating consumption, it’s clear that weekend shopping on 5th Avenue doesn’t help the climate balance…
However, betting on the evolution of environmental awareness among citizens and consumers is clearly not enough.
In the publication Faire sa part? Pouvoir et responsabilité des individus, des entreprises et de l’Etat face à l’urgence climatique, Carbone 4 showed how individual actions, while necessary, are far from sufficient to meet the climate challenge.
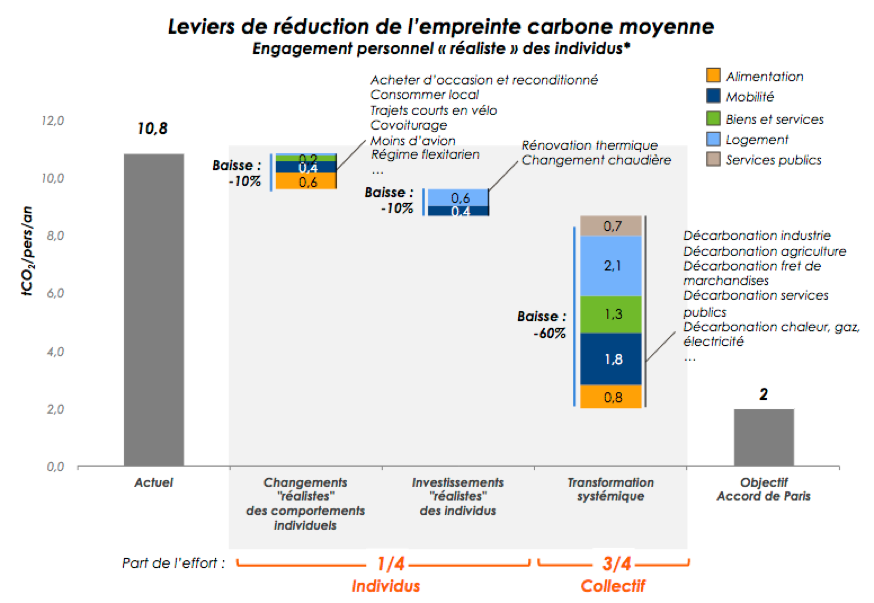
Source Faire sa part – Carbone 4 – June 2019
In 2017, the average French person’s carbon footprint was 10.8 tonnes of CO2 equivalent. According to the study, a “realistic” modification77 in individual behavior would reduce it by 10%. If we add investments that can be made by individuals (e.g. thermal renovation), we see that roughly a quarter of the reduction in the average carbon footprint can be achieved by individuals. The rest of the effort has to come from collective action and investment, whether by the State, local authorities or businesses.
This result is actually quite understandable.
At the economic level, ecological transition in France implies massive investment to bring transport, energy, water and waste management infrastructures, vehicle and ship fleets, building stocks and machine inventories into ecological compliance. It’s our entire stock of physical capital, our entire economic heritage, that needs to be renovated to limit as far as possible the extraction of natural resources, the consumption of space and local and global pollution (including GHG emissions). We also need to invest in training and research to transform industrial and agricultural practices, and to support the professional retraining of those who today work in activities, such as the coal industry, that cannot continue if the transition takes place.
Faced with such a challenge, it’s easy to see that individual behavior alone is not enough. Here are a few examples.
- Citizens benefit from public services (health, education, justice and defense, water and energy networks) that consume resources and emit greenhouse gases that are beyond their control. Only the State and local authorities can undertake the renovation of public buildings, implement responsible purchasing policies or develop land-use planning to place services as close as possible to users and limit the artificialization of land.
- The use of public transport depends to a large extent on supply: many people don’t have access to it for their daily trips.
- Consumers can only choose from what’s on offer: sometimes the “ecological” choice doesn’t exist, or is too expensive. In such cases, they have no alternative but to wait for a satisfactory offer to emerge. While electric vehicles are becoming increasingly widespread, they remain expensive. The same applies to “organic” food, which has long been much more expensive than “conventional” food.
- Consumers have little impact on the industrial processes themselves (e.g. manufacturing methods for aluminum, steel or other metals incorporated into objects, etc.), or on waste treatment methods.
It’s not always easy to be a responsible citizen and consumer.
- Changing habits takes time to learn and adapt. For example, adopting a diet that has little impact on the environment means not only choosing products more carefully, but also relearning how to cook. All Do It Yoursel practices take time.
- Responsible consumption means taking the time to get informed. Even if transparency has progressed, consulting and understanding information on the environmental quality of products indicated by various labels and standards requires time, training and skills that not all individuals necessarily have access to.
- The number of different criteria to be taken into account when making a purchase requires consumers to arbitrate between choices, none of which satisfies them, but for different reasons. For example, between an organic cosmetic from a company with high wage inequalities, and a company producing conventional cosmetics with a good wage policy, what power does the consumer have to express both his environmental and social expectations?
- In 1992, 1,700 scientists and the Union of Concerned Scientists signed the World Scientists’ Warning to Humanity, calling for the environment to be taken into account. 25 years later, the World Scientists’ Warning of Climate Emergency has been signed by almost 15,000 scientists. The accompanying article published in Bioscience magazine shows that, apart from the hole in the ozone layer, all the indicators highlighted have only worsened. ↩︎
- Coined in 2001 by scientists Paul Crutzen and Eugene Stoermer, the concept of the Anthropocene refers to a new geological era characterized by the massive impact of human activities on the planet. Although the concept is widely used, it has not been officially validated. In 2009, the International Union of Geological Sciences launched a dedicated working group which, after 15 years of study, came up with the proposal to call a new geological era starting in 1950 the Anthropocene. This proposal was rejected in early 2024. ↩︎
- Global warming will not be linear: there are “tipping points”, such as the disappearance of the Arctic ice pack or the melting of Greenland, which once crossed will trigger chain reactions leading to runaway global warming, regardless of human actions. See Lenton, T. M., Held, H., et al. (2008), Tipping elements in the Earth’s climate system Proceedings of the National Academy of Sciences; and Steffen, W., Rockström, J., et al. (2018), Trajectories of the Earth System in the Anthropocene, Proceedings of the National Academy of Sciences. ↩︎
- Created in 1988, the IPCC (Intergovernmental Panel on Climate Change) is an intergovernmental organization bringing together all UN member states. Its mission is to provide policy-makers with an assessment of scientific knowledge on climate change, its environmental, economic and social impacts, and the measures needed to address them. IPCC assessment reports are published approximately every 5 years. The first part of the 6th report, which deals with the physical understanding of climate and current and future warming, was published in 2021. ↩︎
- The effects will vary from one region of the world to another: warming will be more pronounced on continents than on oceans, at the poles than in the tropics, at night than during the day. ↩︎
- Current estimates range from 250 million to 1 billion people. See for example: Climate Change and Migration: Improving Methodologies to Estimate Flows, International Organization for Migrations (2008). See also the 2017 Lancet countdown report. ↩︎
- Consult the IPCC report Global Warming of 1.5 °C, the Le Monde article summarizing it Climate: there is hope of limiting global warming, but at the cost of an international effort, or watch the video of climatologist Valérie Masson-Delmotte’s hearing at the French Senate. ↩︎
- Global warming will not be linear: there are “tipping points”, such as the disappearance of the Arctic ice pack or the melting of Greenland, which once crossed will trigger chain reactions leading to runaway global warming, regardless of human actions. See Lenton, T. M., Held, H., et al. (2008), Tipping elements in the Earth’s climate system Proceedings of the National Academy of Sciences; and Steffen, W., Rockström, J., et al. (2018), Trajectories of the Earth System in the Anthropocene, Proceedings of the National Academy of Sciences. ↩︎
- Living organisms have already experienced at least 5 mass extinctions. The last, 65 million years ago, saw the extinction of the dinosaurs, along with three quarters of all species on Earth. Some scientific articles on the ongoing extinction: Accelerated modern human-induced species losses: Entering the sixth mass extinction, Sciences Advances (2015) ; Biological annihilation via the ongoing sixth mass extinction signaled by vertebrate population losses and declines, PNAS (2017) – Le Monde article presenting this study ; Worldwide decline of the entomofauna: A review of its drivers, Biological Conservation, (2019) – Sciences Avenir article presenting this study. ↩︎
- See the FAO’s State of the World’s Forests report; see also the website of the NGO Global Forest Watch, which includes a wealth of data and information. ↩︎
- See the article Global warming impairs stock-recruitment dynamics of corals, Nature (2019) and the article Dans la Grande Barrière, ” les coraux ne font plus de bébés” (Le Monde 2019) summarizing this study. ↩︎
- IPBES (Intergovernmental Science-Policy Platform on Biodiversity and Ecosystem Services) is an independent intergovernmental body comprising over 130 member states. Established in 2012, it provides decision-makers with objective scientific assessments of the state of knowledge about the planet’s biodiversity, ecosystems and the contributions they make to people, as well as the tools and methods to protect and sustainably use these vital natural assets. The first global assessment report on biodiversity and ecosystem services was published in 2019. See a summary on the Le Monde website. ↩︎
- The Millennium Ecosystem Assessment initiative was launched in 2000 by the UN with the aim of assessing the consequences of ecosystem change on human well-being, and proposing the actions needed to maintain ecosystems and their sustainable management by human beings. Over 1,300 experts from all over the world took part in the project, the results of which were published in 2005. ↩︎
- IPBES (Intergovernmental Science-Policy Platform on Biodiversity and Ecosystem Services) is an independent intergovernmental body comprising over 130 member states. Established in 2012, it provides decision-makers with objective scientific assessments of the state of knowledge about the planet’s biodiversity, ecosystems and the contributions they make to people, as well as the tools and methods to protect and sustainably use these vital natural assets. The first global assessment report on biodiversity and ecosystem services was published in 2019. See a summary on the Le Monde website. ↩︎
- Sources. Water: AQUASTAT – FAO’s Global Information System on Water and Agriculture. Sand: Sand and Sustainability: Finding New Solutions for Environmental Governance of Global Sand Resources UNEP, 2019. Fossil fuels: Statistical Review of World Energy 2023. Cereals: FAOSTAT. Iron ore: USGS – National Minerals Information Center – Commodity Statistics and Information. ↩︎
- Source: BRGM metal criticality sheets. Average annual growth rate (AAGR) smoothed over 5 years. ↩︎
- See the press release and the article itself Elhacham, E., Ben-Uri, L., Grozovski, J. et al. ” Global human-made mass exceeds all living biomass. ” Nature (2020). ↩︎
- Florian Fizaine, Victor Court (2015) Renewable electricity producing technologies and metal depletion: A sensitivity analysis using the EROI Ecological Economics. ↩︎
- In Canada, for example, local authorities can declare areas incompatible with mining activity. See also the setbacks of the Montage d’or project in French Guiana. ↩︎
- In addition to the consumption of fossil fuels themselves, there is the share of electricity generated by fossil fuel power plants (64% of electricity production – see IEA). ↩︎
- Source: World Bank – Indicators: Access to electricity (% of population) and Total population ↩︎
- This would involve replacing and/or adapting all the refineries that today transform crude oil into fuels usable by consumers (diesel, heating oil, gasoline). In 2024, the world’s refineries produced almost 83 million barrels per day (for a capacity of 104.5 million barrels). Source: Statistical Review of World Energy 2025.. ↩︎
- Proven reserves are published by country for the period 1980–2020 in the Statistical Review of World Energy. ↩︎
- It results from the theorem of bounded integrals: any function whose integral is finite passes through a maximum and converges to 0 at infinity. ↩︎
- See, for example, a recent summary in Quel avenir pour le pétrole? by Denis Babusiaux and Pierre-René Bauquis? revue AFIS – 2019. ↩︎
- Check out this twitter feed from Météo France, which explains the carbon budget concept very well. ↩︎
- RCP stands for “Representative Concentration Pathways”. In 2100, the radiative forcing of an 8.5 scenario is 8.5 W/M2. For more on scenarios, visit the météo France website. ↩︎
- See Ritchie, J., and Dowlatabadi H. (2017), The 1,000 GtC Coal Question: Are Cases of Vastly Expanded Future Coal Combustion Still Plausible? Energy Economics and Why do climate change scenarios return to coal?“, Energy ↩︎
- Schweizer, V. and Kriegler, E. (2012) Improving environmental change research with systematic techniques for qualitative scenarios, Environmental Research Letters; Christensen, P., Gillingham, K. and Nordhaus, W. (2018) Uncertainty in Forecasts of Long-Run Economic Growth, PNAS. ↩︎
- E.g.: a climate stable enough to allow agriculture or the maintenance of infrastructures; land and oceans in sufficiently good condition to allow the reproduction of fauna and flora that support the diet of billions of humans. ↩︎
- AFEP has published a report on this subject in France: of 209 new university professors recruited between 2000 and 2011, almost 85% devote their research to mainstream economics. ↩︎
- In the article “The Tyranny of the Top 5”, two economists demonstrate the importance of having published in one of the top 5 economics journals for securing a position in the top 35 US economics departments. See J. Heckman & S. Moktan, Publishing and Promotion in Economics: The Tyranny of the Top Five, Journal of Economic Literature, 2020. ↩︎
- This was the formula used by Alfred Nobel in his will, opened in 1895, to designate the recipients of the prize in the 5 original disciplines (physics, chemistry, literature, medicine, peace). When the Bank of Sweden Prize in Memory of Alfred Nobel was created in 1969, the same formula was chosen. ↩︎
- We’re talking about William Nordhaus. As we show in our fact sheet on the global economic impacts of global warming, he has played more of a braking role in raising awareness of the climate issue. It should be noted that Elinor Ostrom was rewarded ” for her analysis of economic governance, in particular of the commons “, a fundamental theme in ecological matters. ↩︎
- Oswald, A. J. and Stern, N. (2019), Why does the economics of climate change matter so much, and why has the engagement of economists been so weak? See also Why are economists letting down the world on climate change? in which the authors summarize their remarks and challenge their colleagues. ↩︎
- Pottier, A. (2014), L’économie dans l’impasse climatique: développement matériel, théorie immatérielle et utopie auto-stabilisatrice, EHESS doctoral thesis – pp. 136-137. ↩︎
- Bowles, S. and Wendy, C. (2020), What Students Learn in Economics 101: Time for a Change Journal of Economic Literature. ↩︎
- Microeconomics studies the behavior of a single economic agent or a homogeneous group of agents (e.g. households, companies). Macroeconomics studies the relationships between the major economic aggregates (savings, investment, consumption, growth). In this respect, it concerns groups of agents, typically on a national or even global scale. See data sheet XXX ↩︎
- See in particular: Daly, H. E. (1968), On Economics as a Life Science, The Journal of Political Economy; Ayres, R.U. and Kneese, A.V. (1969), Production, Consumption, and Externalities, The American Economic Review; Coddington, A. (1970), The Economics of Ecology, New Society; Georgescu-Roegen, N. (1970) The Economics of Production The American Economic Review; Nicholas Georgescu-Roegen, The Entropy Law and the Economic Process, Harvard University Press, (1971). ↩︎
- The first is as follows: ” During any transformation of a closed system, the variation in its energy is equal to the quantity of energy exchanged with the external environment, by thermal transfer (heat) and mechanical transfer (work).” The second is as follows: ” Any transformation of a thermodynamic system takes place with an increase in overall entropy, including the entropy of the system and of the external environment. ↩︎
- You may also wish to consult the following books: Jean Gadrey and Florence Jany-Catrice, Les nouveaux indicateurs de richesse La Découverte (2016); Eloi Laurent, S ortir de la croissance : mode d’emploi Les liens qui libèrent (2019); Joseph Stiglitz, Amartya Sen, Jean-Paul Fitoussi, Report of the Commission on the Measurement of Economic Performance and Social Progress (2009); the European Union’s Beyond GDP initiative. ↩︎
- Some resources: Chaire Comptabilité Ecologique publications. Books: Quelles normes comptables pour une société du commun? Édouard Jourdain, Ed° Charles Léopold Meyer (2019), and Révolution comptable – Pour une entreprise écologique et sociale, Jacques Richard and Alexandre Rambaud, Editions de l’Atelier (2020). Newspaper articles: Il faut intégrer les enjeux écologiques dans la comptabilité des entreprises, Le monde (2019); Transformer nos systèmes comptables pour se réorganiser avec ce qui compte -The conversation (2020); Une révolution comptable pour rendre compte d’un nouveau contrat avec la nature – Le Monde (2020) ↩︎
- Externalities don’t just concern the environment. As early as the beginning of the 19th century, Alfred Marshall spoke of the fact that firms, through their geographical location, benefit from external economies which ” result from the general progress of the industrial environment “, or which ” are connected with the growth of knowledge and technical progress “. Alfred Marshall, Principles of Economics, Macmillan (1890). ↩︎
- This example was developed by John Meade, who also first used the term externality in Meade, J. (1952), External economies and diseconomies in a competitive situation, Economic Journal. ↩︎
- This relationship is no longer necessarily true today: beekeepers suffer negative externalities when fields near their hives are treated with pesticides. Faced with the collapse of bee populations, the commercialization of pollination services is on the rise: in California, for example, beekeepers are paid to pollinate almond trees. ↩︎
- Arthur C. Pigou, The Economics of Welfare, Macmillan (1920) ↩︎
- They generally believe that standards and regulations can generate high, undisclosed costs, and that markets are better placed than public authorities to identify the most efficient technologies. ↩︎
- John H. Dales, Pollution, Property and Prices, University of Toronto Press (1968). He draws on Coase, R. (1960), The problem of social cost, Journal of Law and Economics. ↩︎
- Examples include Jean Tirol and Christian Gollier in France, and Kenneth Rogoff in the USA. ↩︎
- See Pourquoi le ” Nobel d’économie ” n’est pas un prix Nobel comme les autres – Les Décodeurs, Le Monde (09/10/2023) ↩︎
- See Pourquoi le ” Nobel d’économie ” n’est pas un prix Nobel comme les autres – Les Décodeurs, Le Monde (09/10/2023) ↩︎
- L. Barrage & W.D Nordhaus, Policies, projections, and the social cost of carbon: results from the DICE-2023 model, NBER Working paper series, 2023 (p.9). ↩︎
- The textbook is Harvard economist Gregory Mankiw’s Principles of Economics. First published in 1997, this textbook was a resounding success in English-speaking countries before being translated into 20 languages and selling over 20 million copies. The passage on natural resources and growth can be found on page 524 of the 8th edition (2018), available online. ↩︎
- These scenarios assess, for example, resources twice as great as envisaged at the time, or a strong control of pollution, or an increase in agricultural productivity, or technical progress enabling materials to be recycled. ↩︎
- Originally published in 1972, Limits to Growth was updated in 1992(Beyond the Limits, Chelsea Green Publishing) and 2004(The limits to growth: The 30-year update. Chelsea Green Publishing). ↩︎
- The Limits to growth report is based on the Wolrd3 model developed by Forrester. Doomsday model” could be translated as “catastrophist model” or “end-of-the-world model”. ↩︎
- In other words, the stocks of machinery, infrastructure, buildings, etc. needed for the economy. See XXX capital sheet ↩︎
- It’s worth noting that while Joseph Stiglitz helped forge the prevailing consensus on the issue of natural resources and growth at the start of his career, he went on to make important contributions in the fields of economics and ecology, for example on the questioning of GDP. ↩︎
- This report was produced by the World Commission on Environment and Development, launched by the UN in 1983. Headed by Gro Harlem Brundtland, Prime Minister of Norway, its mission was to define a program of international, multidisciplinary cooperation on environmental issues. ↩︎
- These debates follow in the wake of the Limits to Growth report published in the early 1970s (discussed in this module’sidée reçue3). It should be noted that most of these articles are no longer published in the major generalist economic journals, but in specialized environmental journals. For a literature review on the subject, see Pezzey, J. C. V. and Toman, M. A. (2002), The Economics of Sustainability: A Review of Journal Articles, Ressources for the Future Working Paper. ↩︎
- There is much debate about the different forms of capital (some also speak of social capital, institutional capital, etc.), their definition or the relevance of applying the notion of capital to human or natural capital. ), on their definition or on the relevance of applying the notion of capital to human or natural capital. It is not our intention here to enter into these debates. ↩︎
- A very educational article on this subject: Creating a sustainable economy: the notion of sustainability, on Easynomics.fr ↩︎
- See, for example, this article describing recent experiments using soap bubbles and drones. ↩︎
- their power to transform/destroy matter, their energy consumption, and their gaseous, liquid or solid effluents ↩︎
- This book is set against the backdrop of the energy debates that took place in England in the 1860s, a country that saw the birth of the Industrial Revolution thanks in particular to the extensive use of coal. Following the Cobden-Chevalier Treaty (1860) of free trade between France and England, which provided for the lifting of customs restrictions and taxes on the coal trade, the English feared that their industrial supremacy would be eroded if coal ran out. For a more in-depth analysis of the Coal question – Pottier (2014) chapter 2.1.2 p 107 ↩︎
- For example: withdrawal from the market of the most polluting equipment (e.g. incandescent light bulbs have been banned in Europe since 2013), promulgation of maximum energy or water consumption standards for machines or buildings, consumer information rules (energy labels rating the energy performance of household appliances or homes) etc. ↩︎
- An update published in 2019 does not fundamentally change the conclusions. Forest bioenergy, carbon capture and storage, and carbon dioxide removal: an update, EASAC, February 2019. ↩︎
- Services already account for over 65% of global GDP. See here ↩︎
- The carbon footprint can concern a territory (the case considered here), but also a product or a particular company. The definition is then different. The carbon footprint of a product involves calculating the GHG emissions linked to its manufacture, use and end-of-life. A company’s carbon footprint takes into account the company’s direct emissions, as well as those of upstream and downstream activities in the value chain in which the company is involved. ↩︎
- This lifestyle includes not only individual behavior, but also the infrastructures and collective services to which it has access. ↩︎
- See World Population Prospects 2019 Vol2 (p5). ↩︎
- According to demographer Henri Leridon, the world famine of 1876-1879 caused between 30 and 60 million deaths, the Spanish flu epidemic between 40 and 100 million victims, the Second World War between 50 and 80 million deaths, the great famines of the USSR in 1918-1920, or China in 1958-1961, several tens of millions of deaths in 3 to 5 years, and HIV-AIDS caused 35 million deaths from the start of the epidemic in the 1980s to 2018. ↩︎
- It should be noted that the unchecked continuation of current global warming and biodiversity collapse dynamics could lead to such scenarios. ↩︎
- Oceania (excluding Australia and New Zealand) would also have a high fertility rate, but the countries in this region represent only a small proportion of the world’s population (from 12 million today to 19 million in 2050). The “North Africa and West Asia” region, on the other hand, is expected to drop from 2.9 to 2.3 children per woman. ↩︎
- Unless otherwise stated, all figures relating to GHG emissions in this section are taken from the Edgar Database – Booklet 2019. It is important to note that this database does not include land-use changes (i.e. CO2 emissions linked to the difference between deforestation and reforestation). ↩︎
- Standard of living (measured by GDP/capita) is not the only determinant. The “environmental quality” of this standard of living is also important. In the case of CO2, for example, the KAYA equation shows that the energy content of GDP and the more or less carbon-intensive energy mix are fundamental. ↩︎
- The list of individual actions envisaged in the study mixes “small gestures” (lowering home heating temperature, purchasing LEDs, buying a water bottle) and more significant changes (adopting a vegetarian diet, no longer flying, buying only second-hand goods…). The “realistic” vision considers that only part of the actions that can be activated on an individual scale will be carried out, depending on the willingness of households on a French scale to change. The study also presents a “heroic” vision in which all households carry out all the actions, resulting in a 25% reduction in the average carbon footprint of French households. ↩︎