
This text has been translated by a machine and has not been reviewed by a human yet. Apologies for any errors or approximations – do not hesitate to send us a message if you spot some!
The debt-to-GDP ratio is a key indicator in speeches on public debt and, more generally, on the sound management of public finances. The evolution of this ratio depends on a purely mathematical mechanism known as the “snowball effect”. In this fact sheet, we’ll look at what this is and why it’s important. It is, of course, only one element in the many debates surrounding public debt (see our module on public debt and deficit).
What is the snowball effect in economics?
Intuitively, we would tend to think that the increase in the debt/GDP ratio is linked to the public deficit alone: as expenditure exceeds revenue, the State must go into debt. While this is one possible cause, it is not the only one.
The evolution of this ratio depends on four factors:
- the year-on-year GDP growth rate, i.e. economic conditions;
- the average interest rate on public debt ;
- inflation rate ;
- the primary public balance, i.e. the difference between public revenue and expenditure excluding interest charges.
If the interest rate on debt is higher than the rate of GDP growth (including inflation), then debt increases mechanically, even in the absence of a primary deficit. This purely mathematical mechanism is known as the snowball effect of public debt.
It explains why, even with “sound” budgetary management (in the sense that revenues cover expenditure excluding interest on debt), the debt/GDP ratio can rise mechanically as a result of excessively high interest rates. In this case, it is necessary to generate a primary surplus in order to stabilize the debt/GDP ratio. Depending on the various parameters observed, we can calculate this balance “stabilizing” public debt. 1
A simplified numerical example to understand this arithmetic
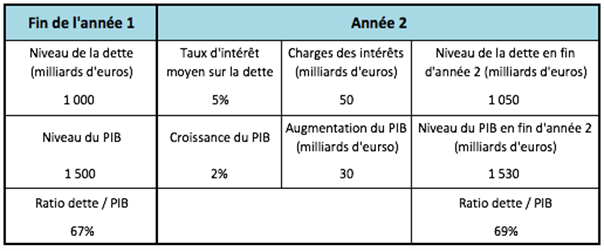
Imagine a country with a GDP of 1,500 billion euros and a general government debt of 1,000 billion euros: the debt-to-GDP ratio is therefore 67%.
If, the following year, the public primary balance is zero but the interest rate is 5% while GDP growth is only 2%, then the debt/GDP ratio rises to 69%. It has risen in the absence of a primary deficit.
Detail of snowball effect calculation for our example
Over a ten-year period with the same parameters, the snowball effect increases the debt ratio to 89% and the interest burden to 5% of GDP.
Since the Maastricht Treaty (1992), European Union member states have been bound by budgetary rules: public debt must be below 60% of GDP, and the deficit must not exceed 3% of GDP. These rules are designed to avoid a snowball effect. These ratios remain constant with interest rates on public debt at 5%, a growth rate of 3% and inflation at 2%, which seemed an acceptable “framing” of overall economic data in the euro zone when the treaty was signed.
The dangers of the snowball effect
The exponential power of the snowball effect explains why so much attention is paid to containing the public balance, and in some cases even generating primary surpluses. We also understand that governments are careful to avoid any risk of rising interest rates on their public debt, which would happen if creditors were wary of their ability to honor their commitments (interest payments and repayment of maturing debt).
It is this effect, in particular, that leads governments to take measures that “lend credibility” to their concern not to let the deficit slip, and to assert urbi et orbi that they will repay their debt, or at least that they will be able to “roll it over”. (Remember that most countries that issue their debt in their national currency “roll over” their debt, i.e. re-borrow to repay maturing loans. More on this in the module on public debt and deficit).
While it’s important to be aware of the snowball effect, it’s dangerous to make it the determining factor in public decisions. For example, during a recession, the snowball effect necessarily increases as the GDP growth rate becomes negative. If the response of governments is to reduce public spending in an attempt to generate a budget surplus to stabilize the debt/GDP ratio, this risks having a pro-cyclical effect, leading to the opposite of the desired result. In fact, mobilizing the public budget helps to cushion and combat crises, thanks to automatic stabilizers and the
Finally, this snowball effect is all the more problematic given that, from the 1970s-80s onwards, governments chose to finance their debt mainly on the financial markets (see module on public debt and deficit). Financial players thus have a say in the management of public finances (and, more generally, public policies), which they can “punish” by raising interest rates (and thus increasing the snowball effect) if it doesn’t suit them. It is important to understand that this has not always been the case, and that it is not inevitable. 2
The snowball effect on debt dynamics in the eurozone over the last few decades
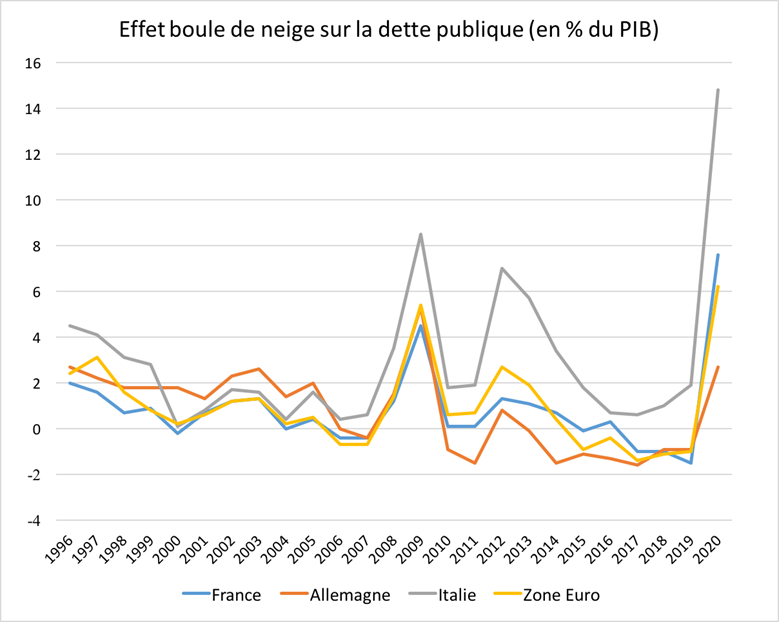
Source European Commission Ameco database (series 18.1)
The graph above traces the snowball effect on public debt for the three main eurozone economies and for the zone as a whole between 1996 and 2020.
When the snowball effect is greater than 0, it contributes to an increase in the debt/GDP ratio (the other element influencing this ratio being, of course, the primary balance), and vice versa.
This graph reveals several points:
- Global economic crises (2007-2008, then 2020) result in a sharp rise in the snowball effect for all countries, due to the recession-induced drop in GDP.
- From the 1990s to the mid-2000s, the snowball effect was positive overall, contributing to the rise in public debt.
- Italy has experienced a positive snowball effect over the entire period, which explains how this country can have one of the highest debt ratios in Europe, while the public balance has been systematically in surplus (except in 2009 and 2020). 3
- The sharp rise in the snowball effect for Italy in the early 2010s reflects the European public debt crisis, during which interest rates soared in five countries. We can also see the effect of the gradual decline in rates from 2012 and especially 2015, following the European Central Bank’s accommodating monetary policies (see Module on public debt and deficit).
- Finally, from 2015 onwards, the snowball effect has been negative (with the exception of Italy), helping to reduce the debt/GDP ratio. This is due to the ECB’s accommodating monetary policy, which enables many countries to borrow at near-zero or even negative interest rates. As GDP growth is non-zero (excluding the effect of the Covid-19 crisis in 2020), there is no need to fear a snowball effect for many years to come: the huge amounts of savings accumulated (notably as a result of the ECB’s quantitative easing operations) need capital security (even at the cost of zero or even negative returns), and everything suggests that this need is very sustainable.
Find out more
To better understand the various factors that influence public debt and to get rid of preconceived ideas about debt, consult our module
- See more detailed explanations on the Fipeco website ↩︎
- See the module on public debt and deficit and the book by Alain Grandjean and Nicolas Dufrêne, Une monnaie écologique, Odile Jacob, 2020. ↩︎
- See Ameco database (Series 16.4 – Net lending excluding interest). ↩︎