
This text has been translated by a machine and has not been reviewed by a human yet. Apologies for any errors or approximations – do not hesitate to send us a message if you spot some!
In a 2016 interview, climate economist Richard Tol asserted “ Climate change is not an important issue for the 21st century. “. In the work for which he was awarded the Nobel Prize in Economics in 2018, William Nordhaus estimated that global warming of +6°C would lead to a GDP loss of 8.5% in 2100. A 2015OECD report cited a central case of 12% GDP loss in 2100. Examples of this type abound.
How is it still possible at the beginning of the 21st century to make such statements? Let’s not forget that studies on the physical impacts of climate change show that if we exceed +2°C, the planet will become largely uninhabitable. Can we seriously expect this to translate into anything other than a slowdown in growth?
In this fact sheet, we show why the methods used by economists to assess the cost of future climate damage are highly open to criticism. What they have in common is that they are based on phenomena that are already known or anticipated, whereas climate disruption plunges us into unknown territory. We also explain why these studies are dangerous: they have given, and still give, the impression that even at +3°C global warming will be manageable.
————
This article benefited from the proofreading and comments of Jean-Marc Béguin (see the list of all TOE contributors).
Note anf udate (june 2025)
In this article we use the 2016 version of the DICE model, for which William Nordhaus was awarded the 2018 Nobel Prize in Economics.
Since then, a new version of this model has been published: DICE-2023. The assessment of damages does not change fundamentally. Nordhaus writes: “In total, damages are estimated to be 3.1% of output at 3 °C warming and 7.0% of output at 4.5 °C warming.” 1
Since this article was written, economists have produced studies that arrive at conclusions more consistent with those of scientists on the physical impacts of global warming. This can be seen in the review of the latest studies on the subject (in french) that we conducted mid-2025.
This research is also being used more widely at the institutional level, albeit with precautions (see the end of section 4.2 on the work of central banks).
What are the impacts of climate change on human societies and the economy?
Studying the impacts of climate change involves a wide range of research topics and disciplines
For example, the researchers studied the consequences of different climate change scenarios on :
- natural systems (dangers for terrestrial, freshwater, coastal and deep-sea marine ecosystems, impacts on animal and plant species in terms of their ability to adapt, migrate and survive, etc.);
- food production (crop yields, livestock health, fishing and aquaculture yields) and the availability of drinking water (melting of the continental glaciers that feed the planet’s major rivers, changes in rainfall patterns);
- health impacts (nutrition, hyperthermia, increased range of certain diseases and emergence of new viruses, mental disorders);
- rising sea levels, the frequency of extreme events (storms, heat waves, floods), the disappearance of land (islands and coastal areas) and the destruction of human structures (buildings, infrastructure, factories);
- impacts on specific economic sectors (agriculture, tourism, energy or water production, disruption of global supply chains, etc.) and on the economy as a whole (measured by loss of GDP);
The research also looks at the impact of all the above in terms of migration and the stability of political regimes, and even geopolitical conflicts and wars.
These areas of research may concern the world as a whole or specific regions.
Climate change could make our planet largely uninhabitable
The analysis and synthesis of all this research work is published in the IPCC Working Group 2 assessment report, the latest version of which was published in February 2022 ” Climate Change 2022: Impacts, Adaptation and Vulnerability “.
What does the Intergovernmental Panel on Climate Change (IPCC) do?
What is the IPCC?
Created in 1988, the IPCC is an intergovernmental organization bringing together all UN member states. Its mission is to provide policy-makers with an assessment of scientific knowledge on climate change, its environmental, economic and social impacts, and the measures needed to address them.
It does not produce research, but synthesizes existing scientific work in a highly transparent and codified process. 2.
IPCC assessment reports
Every five years or so, the IPCC publishes an assessment report consisting of a general summary and reports from each of its three working groups (WGs):
-GT1: physical understanding of the climate system and climate change;
-GT2: consequences of climate change and adaptation strategies;
-GT3: strategies for limiting climate change.
Each working group produces a report of several thousand pages, a summary for decision-makers approved line by line by IPCC member states, and a technical summary.
Source The various sections of the IPCC’s Sixth Assessment Report (2021-2022) can be downloaded from the IPCC website.
The findings of the latest IPCC report are unequivocal: ongoing climate change has already had a major impact on natural and human systems.
More than half of humanity is now highly vulnerable to climate change.
In France, the Ministry of Ecology estimates that 62% of the population is “strongly or very strongly” exposed to climate risks.3.
Without far-reaching action to limit global warming and adapt our societies to the changes already underway, the impacts will only increase, to the point of calling into question the habitability of our planet.
This is illustrated, for example, by the following map.
Worldwide distribution of the population at risk of hyperthermia due to extreme heat and humidity
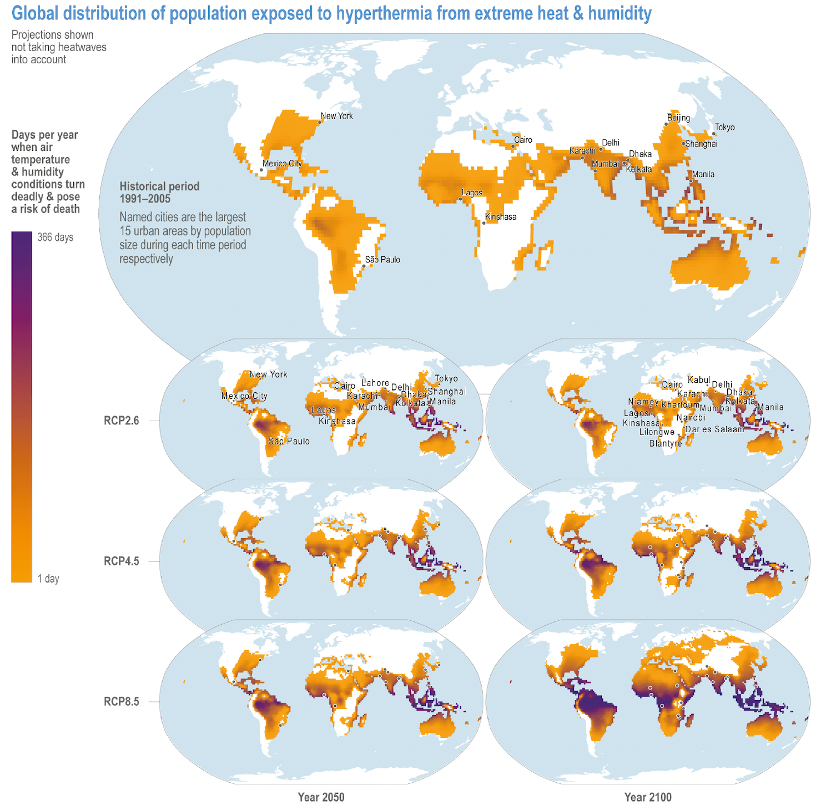
Source: IPCC Sixth Assessment Report – Working Group 2 (2022) Annex 1 – Global to Regional Atlas (Figure AI.29)
These maps show the proportion of the world’s population exposed to hyperthermia in the recent past and in the future, according to different global warming scenarios. The colors indicate the number of days per year when temperature and humidity conditions exceed the threshold beyond which they become lethal.
As can be seen, the RCP8.5 scenario 4 scenario (which leads to warming in excess of 3.2°C) implies that a large part of the planet will be largely uninhabitable by 2100 (all the purple lands in the bottom right-hand planisphere).
Billions of people are affected (India, Central and Northern South America, large parts of Africa, Southeast Asia and Oceania).
These results merely confirm those of previous IPCC reports.
To avoid these extreme risks, the international community adopted the goal of limiting ” the rise in global average temperature to well below 2°C above pre-industrial levels ” in the Paris Agreement adopted at COP21 in 2015.
For some economists, the impact of global warming on world GDP is negligible.
When the IPCC transcribes the work of economists attempting to assess the macro-economic impact of global warming, the extreme risks for mankind just mentioned suddenly appear very limited. It is this approach that we will be criticizing at length in this article.
TS.C.10.2 (…) In the case of high warming (>4°C) and limited adaptation, the magnitude of the decline in annual global GDP in 2100 relative to a no-warming scenario exceeds the economic losses of the Great Recession of 2008-2009 and the COVID-19 pandemic of 2020; much smaller effects are estimated for lower warming, lower vulnerability and higher adaptation (medium confidence).
First of all, comparison with the last two crises gives the impression that a warming of +4°C would be manageable from an economic point of view, just as these crises were.
In addition to this limited impact, the wording used is confusing. We’ll see in section 3.C that, in reality, studies on the global economic consequences of global warming most often postulate a simple slowdown in GDP growth over the course of the 21st century, and not a recession as was the case in 2009 and 2020. 5.
The IPCC transcribes here the synthesis of academic work on GDP and climate. Who are the economists who reach such conclusions? What methods do they use?
Find out more
Some resources on the impacts of global warming
- Impacts, Adaptation and Vulnerability – Sixth Assessment Report of IPCC Working Group 2 (2022)
- A summary of the Sixth Assessment Report of IPCC Working Group 2 on the Good Buddy blog (2022)
- Climate impact explorer: visualize the consequences of global warming in each country according to different warming trajectories
What tools do scientists use to study climate change, the consequences of global warming and ways of dealing with it?
While there is no longer any doubt about the reality of climate change, its causes and its potentially dramatic consequences, the future remains fundamentally uncertain, if only because it depends on future human behavior.
As a result, we don’t know what path humanity will take over the next few decades to change or reverse current trends.
The simplified diagram below illustrates the complex interactions between climate, human societies and natural systems. Once again, the scientific disciplines involved are extremely varied. They range from the life and earth sciences (climatologists, ecologists, oceanologists, etc.) to the engineering sciences (energy systems, agronomists, etc.) and the social sciences (demographers, economists, sociologists, etc.).
Climate change and socio-economic development are profoundly linked
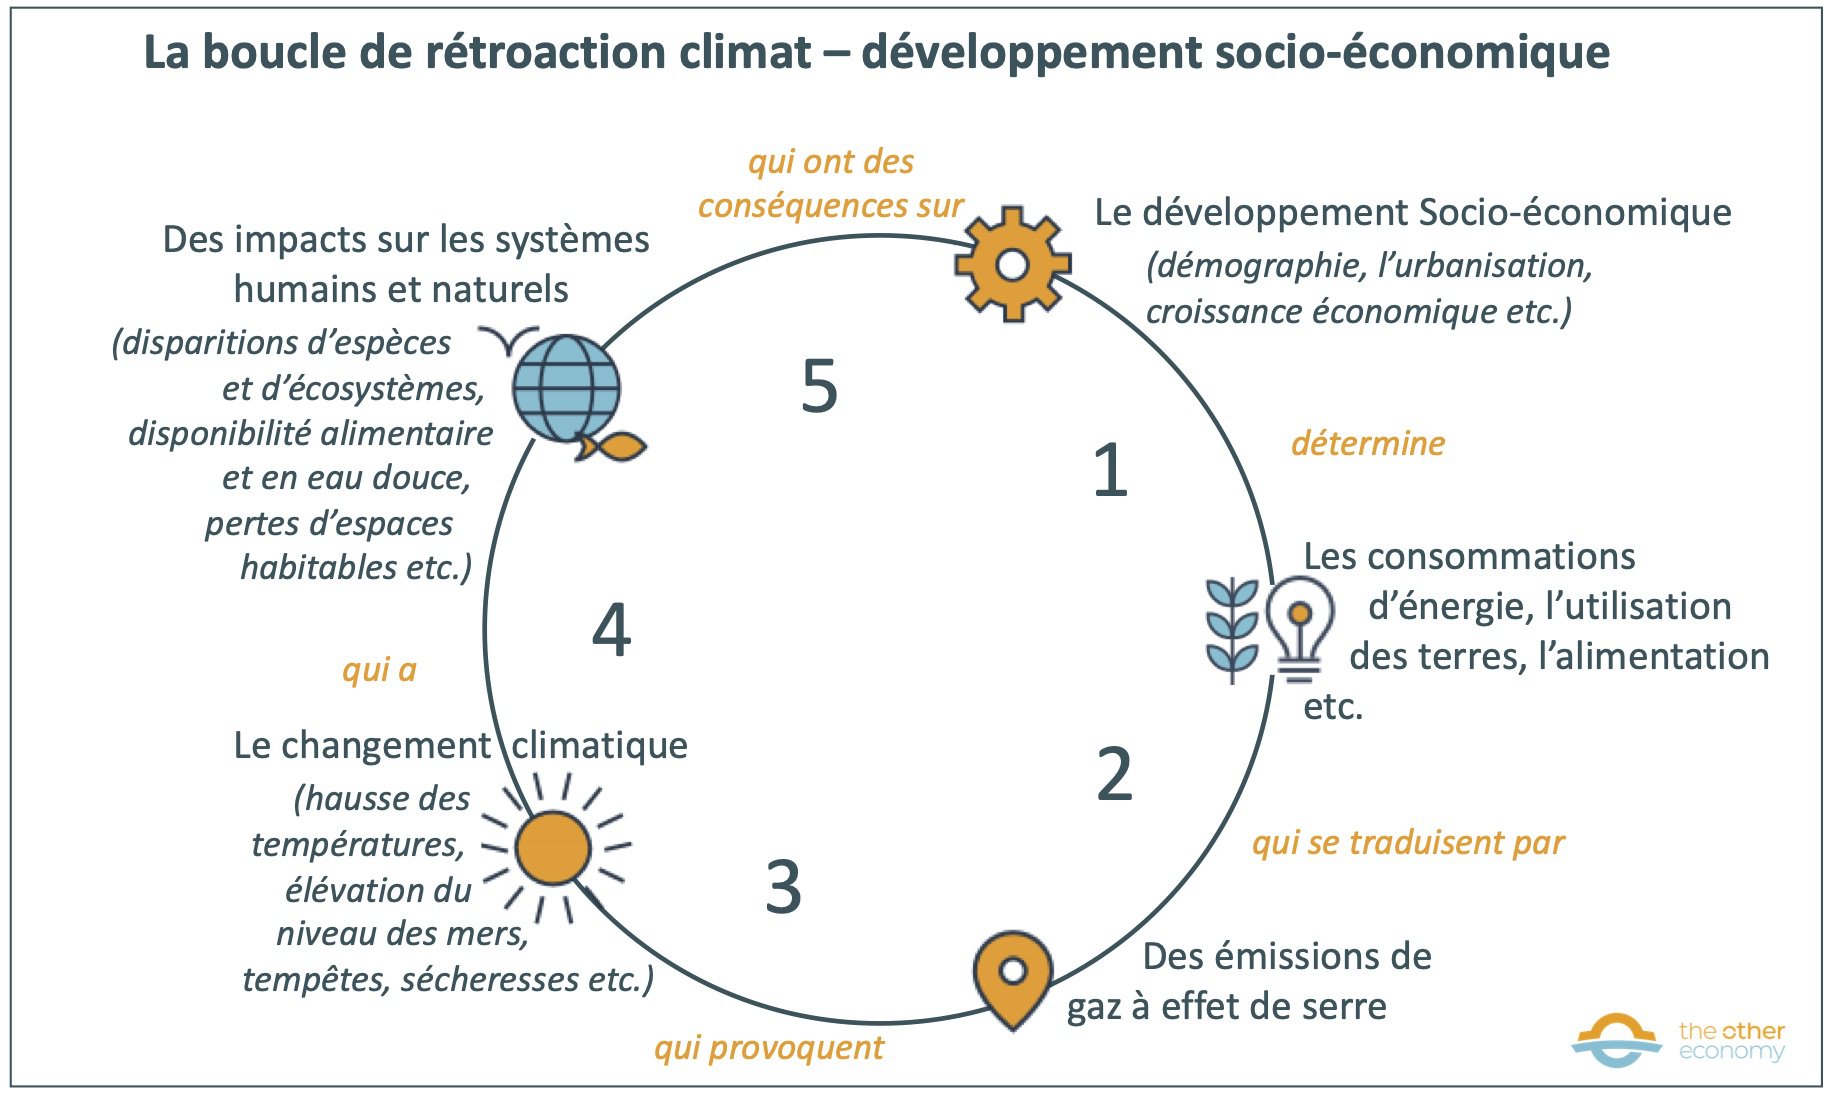
Source Climate change scenario interactive teaching guide developed as part of the SENSE project
Human activities lead to energy consumption and land use. This results in greenhouse gas emissions, which in turn cause climate change in its many manifestations (e.g. global rise in temperatures, changes in rainfall patterns, melting of continental glaciers, changes in ocean currents, increased heat waves and storms, etc.). Climate change in turn has repercussions on human beings and natural systems, and ultimately on socio-economic development.
To study possible futures, scientists make extensive use of the scenario tool.
The I4CE think tank has identified three main families of climate-related scenarios.
–Climate scenarios, used by climatologists, study the evolution of the climate system as a function of different GHG emission trajectories (phase 3 of the above loop and IPCC WG1).
–Socio-economic scenarios, used by climate economists, explore the consequences of the evolution of human societies on greenhouse gas emission trajectories (and therefore ultimately on global warming). When it comes to exploring how to limit emissions to reach a climate target (2°C or 1.5°C), we speak of “transition scenarios”. These are then compared with “business as usual” or “reference” scenarios, which consist in letting trends continue without introducing any constraints linked to a climate target (these scenarios are in phases 1 and 2 of the above loop and are mainly studied by the IPCC’s WG3).
–Impact scenarios, used by the scientists mentioned in Part 1, study the consequences of global warming on human societies and natural systems (phases 4 and 5 of the above loop and IPCC WG2).
A scenario generally consists of four dimensions
–A qualitative narrative (a story) describing a possible evolution of the world.
E.g.: current social, economic and technical trends are continuing; inequalities are increasing enormously; humanity is resolutely committed to the ecological transition, etc.
–Quantitative hypotheses: this involves specifying the variables that translate the narrative in quantitative terms.
E.g.: the assumptions of a transition scenario may concern the evolution (global, regional, by country) of population, GDP, urbanization, as well as assumptions on the means (technological, political, economic, etc.) implemented to reach the identified climate objectives. The assumptions of a climate scenario will include greenhouse gas emission trajectories.
One (or more) models: a model is a set of mathematical equations designed to simulate the functioning of a real-world system as described by a certain number of variables (the global climate, a financial market, a natural ecosystem, a country’s economy) and its evolution over time.
The quantitative assumptions mentioned above constitute the model’s input data: they are said to be exogenous because they are not calculated by the model itself, but come from external sources.
Models are always simplified representations of reality. However, they are not all based on the same type of scientific knowledge. Climate models, for example, are based on the laws of physics, while economic models are based on economic theories, themselves influenced by economic currents of thought. 6.
–Results: these are all the quantitative output data from the model that are interpreted to complete the scenario story.
For example, in a climate scenario, we’re talking about changes in temperature, rainfall and snow cover; in a transition scenario, we’re talking about changes in demand and the energy mix, the amount of investment required and the technologies to be deployed.
Integrated assessment models (IAMs) aim to explore the entire climate-development loop.
As we saw in the previous section, each of the three main scenario families explores in detail a part of the climate-development feedback loop. For this, very different models are used.
For example, climate scenarios (located at point 3 of the loop) are based on climate models. Based on the laws of physics, they aim to make dynamic projections of how the climate may evolve over the 21st century according to different greenhouse gas emission scenarios.
Transition scenarios aim to explore a large part (or even, for some, the whole) of the loop (albeit much more superficially than scenarios and models studying a specific part of the loop).
To do this, they use Integrated Assessment Models (IAMs ), which aim to help understand the interactions between human societies, economic development and climate over the long term. Assessment is termed “integrated” because these models use information from a wide range of scientific disciplines, and aim to describe both human and natural systems, by coupling modules representing at least the economy, the energy system, the climate, etc.
While the AMI family includes models that vary widely in terms of complexity, resolution mode (simulation or optimization logic) or modeling paradigm (Bottum up or Top down model), we can distinguish two main categories.
Cost-benefit MRIs
Highly aggregated (with little or no geographical or sectoral breakdown), their aim is to determine the “optimal” GHG emissions trajectory (and therefore global warming trajectory) in the economic sense of the term, i.e. the one that enables the current costs of combating global warming to be offset by future benefits (i.e. damage avoided).
These models therefore need to assess the future damage of global warming (in terms of lost GDP). In this respect, they really do explore the whole loop (even if only superficially).
In particular, they are used to determine the “social cost of carbon”, i.e. the cost, in today’s euros, of the future damage caused by the current emission of one tonne of carbon. This work is therefore largely intended to feed into public policies on carbon pricing (via a tax or quota market).
Examples: models called DICE, PAGE, FUND are cost-benefit IAMs.
Detailed process-based IAM
Much more complex and disaggregated, they go further than their predecessors in analyzing the coupling of human and natural systems, by making modules interact that represent the economy (with more or less sectors), the energy system, the climate, but also sometimes agriculture and land use, or water. It is these models in particular that are used in the transition scenarios assessed by IPCC Group 3. Their aim is to answer questions such as: how can we limit global warming to +2°C, +1.5°C? What would be the impact of this or that measure?
In theory, these models should, like their predecessors, include an assessment of the damage caused by global warming to the world economy, since this necessarily has an influence on the terms of the transition. 7. In practice, this was hardly the case until central banks began to take an interest in climate-related financial risks (see section 4).
The Integrated Assessment Modeling Consortium 8 has created a wiki containing documentation for most of the IAMs used in the IPCC’s work.
Simplified representation of the structure of an Integrated Assessment Model (IAM)
The image below shows how complex IAMs work, with input data in blue, modules in green representing different human and natural systems, and output data (results) in yellow.
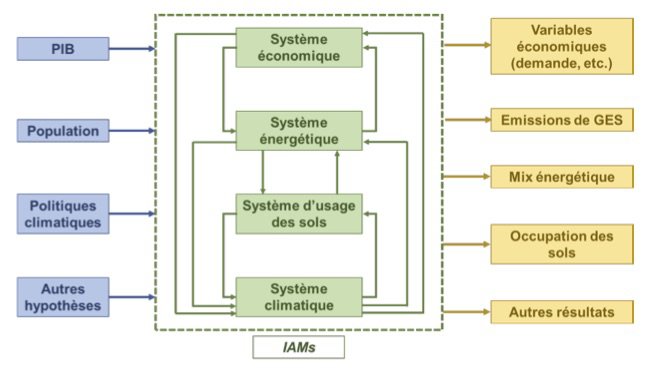
Source Understanding the challenges of modeling the complex link between energy, climate and the economy – The Shift Project & IPFEN (2019)
Find out more
Understanding climate-related scenarios
- Climate energy scenario – assessment and instructions for use, The Shift Project & AFEP (2019)
- Understanding transition scenarios, I4CE (2019)
- The “Climate change scenario” interactive teaching guide developed as part of the SENSE project
Understanding Integrated Assessment Models (IAM)
- Transition scenarios and models used in the IPCC 6th Assessment Report (WG 3 – Annex 3)
- How integrated assessment models’ are used to study climate change, Carbon brief (2018)
- Understanding the challenges of modeling the complex link between energy, climate and the economy – The Shift Project & IPFEN (2019)
- Compare the main IAM documentation on the Integrated Assessment Modeling Consortium wiki
How do economists study the macroeconomic damage caused by climate change?
The founding role of William Nordhaus’ work: the DICE model
In 2018, economist William Nordhaus was awarded the Nobel Prize in Economics for his pioneering work on “integrating climate change into long-term macroeconomic analysis”. In the early 1990s, he designed the first integrated assessment model, the DICE9 model, coupling a long-term growth module with a climate module.
DICE belongs to the category of cost-benefit AMIs (see section on AMIs).
Nordhaus’ DICE model is based on a highly aggregated and simplified representation of the global economy.
Production is based on the use of labor and capital. Technical progress increases the total productivity of these factors (TFP), leading to growth in production. 10.
Note here that GDP grows by construction and whatever happens: in fact, total factor productivity, which is decisive in calculating GDP, is an exogenous variable, i.e. it is not calculated by the model. In DICE-2016, it grows by around 2% per year throughout the 21st century.
Nordhaus combines this highly simplified representation of the economy with an equally simple climate module
Production leads to greenhouse gas emissions, which cause climate change in the form of a rise in the planet’s average temperature. This in turn causes damage (in the form of reduced production, and hence GDP). It is possible to reduce emissions in order to limit the damage, which translates into costs (also expressed in GDP points) representing the transition from a fossil fuel energy system to a decarbonized system.
Thus, in this representation of economic-climate links, actions designed to reduce emissions take the form of a reduction in consumption today (we must deprive ourselves in order to invest) and an increase in consumption in the future (by limiting climate damage).
The question Nordhaus seeks to answer is: how can we optimize intertemporal consumption?
The DICE model is therefore designed to determine the economically “optimal” greenhouse gas emissions (and therefore warming) trajectory with a view to maximizing intergenerational “well-being”. 11. If the world follows this trajectory, the current costs of combating global warming will be offset by future benefits (i.e. avoided damage). The model can also be used to study “non-optimal” trajectories: for example, the continuation of current trends (the business-as-usual scenario) or the maximization of social well-being under the additional constraint that the temperature rise does not exceed 2°C.
Optimal global warming according to Nobel Prize winner William Nordhaus
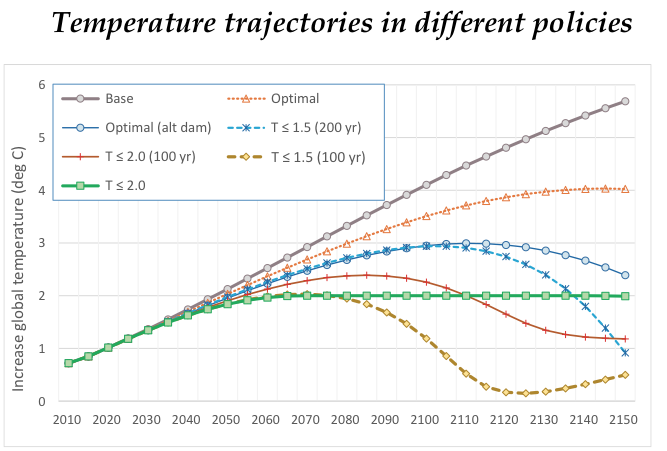
Source Climate Change: The Ultimate Challenge for Economics, Presentation by William Nordhaus at his Nobel Prize award ceremony. Slide 6.
The “optimal” curve according to DICE-2016, the version of the model developed by William Nordhaus for which he received his Nobel Prize, is in orange.
In the latest published version of the model(DICE-2023), optimal warming reaches +2.73°C in 2100.
Defining the damage function, or how to make global warming harmless to economic growth
Nordhaus’ pioneering role greatly influenced subsequent work. The fact that his model was made freely available on the Internet multiplied its appropriation and use by other researchers, and inspired subsequent generations of AMI models. In particular, he had a decisive (and unfortunate) influence on the assessment of the aggregate economic damage of global warming.
What is a damage function?
As mentioned above, one of the aims of the DICE model is to see to what extent the expenditure incurred to combat climate disruption is offset by the economic damage avoided in the future. To function, DICE therefore requires an assessment (in terms of GDP losses) of these future damages.
To achieve this, Nordhaus developed what he called a “damage function”, which links a certain level of global temperature rise to a loss of production (and therefore GDP).
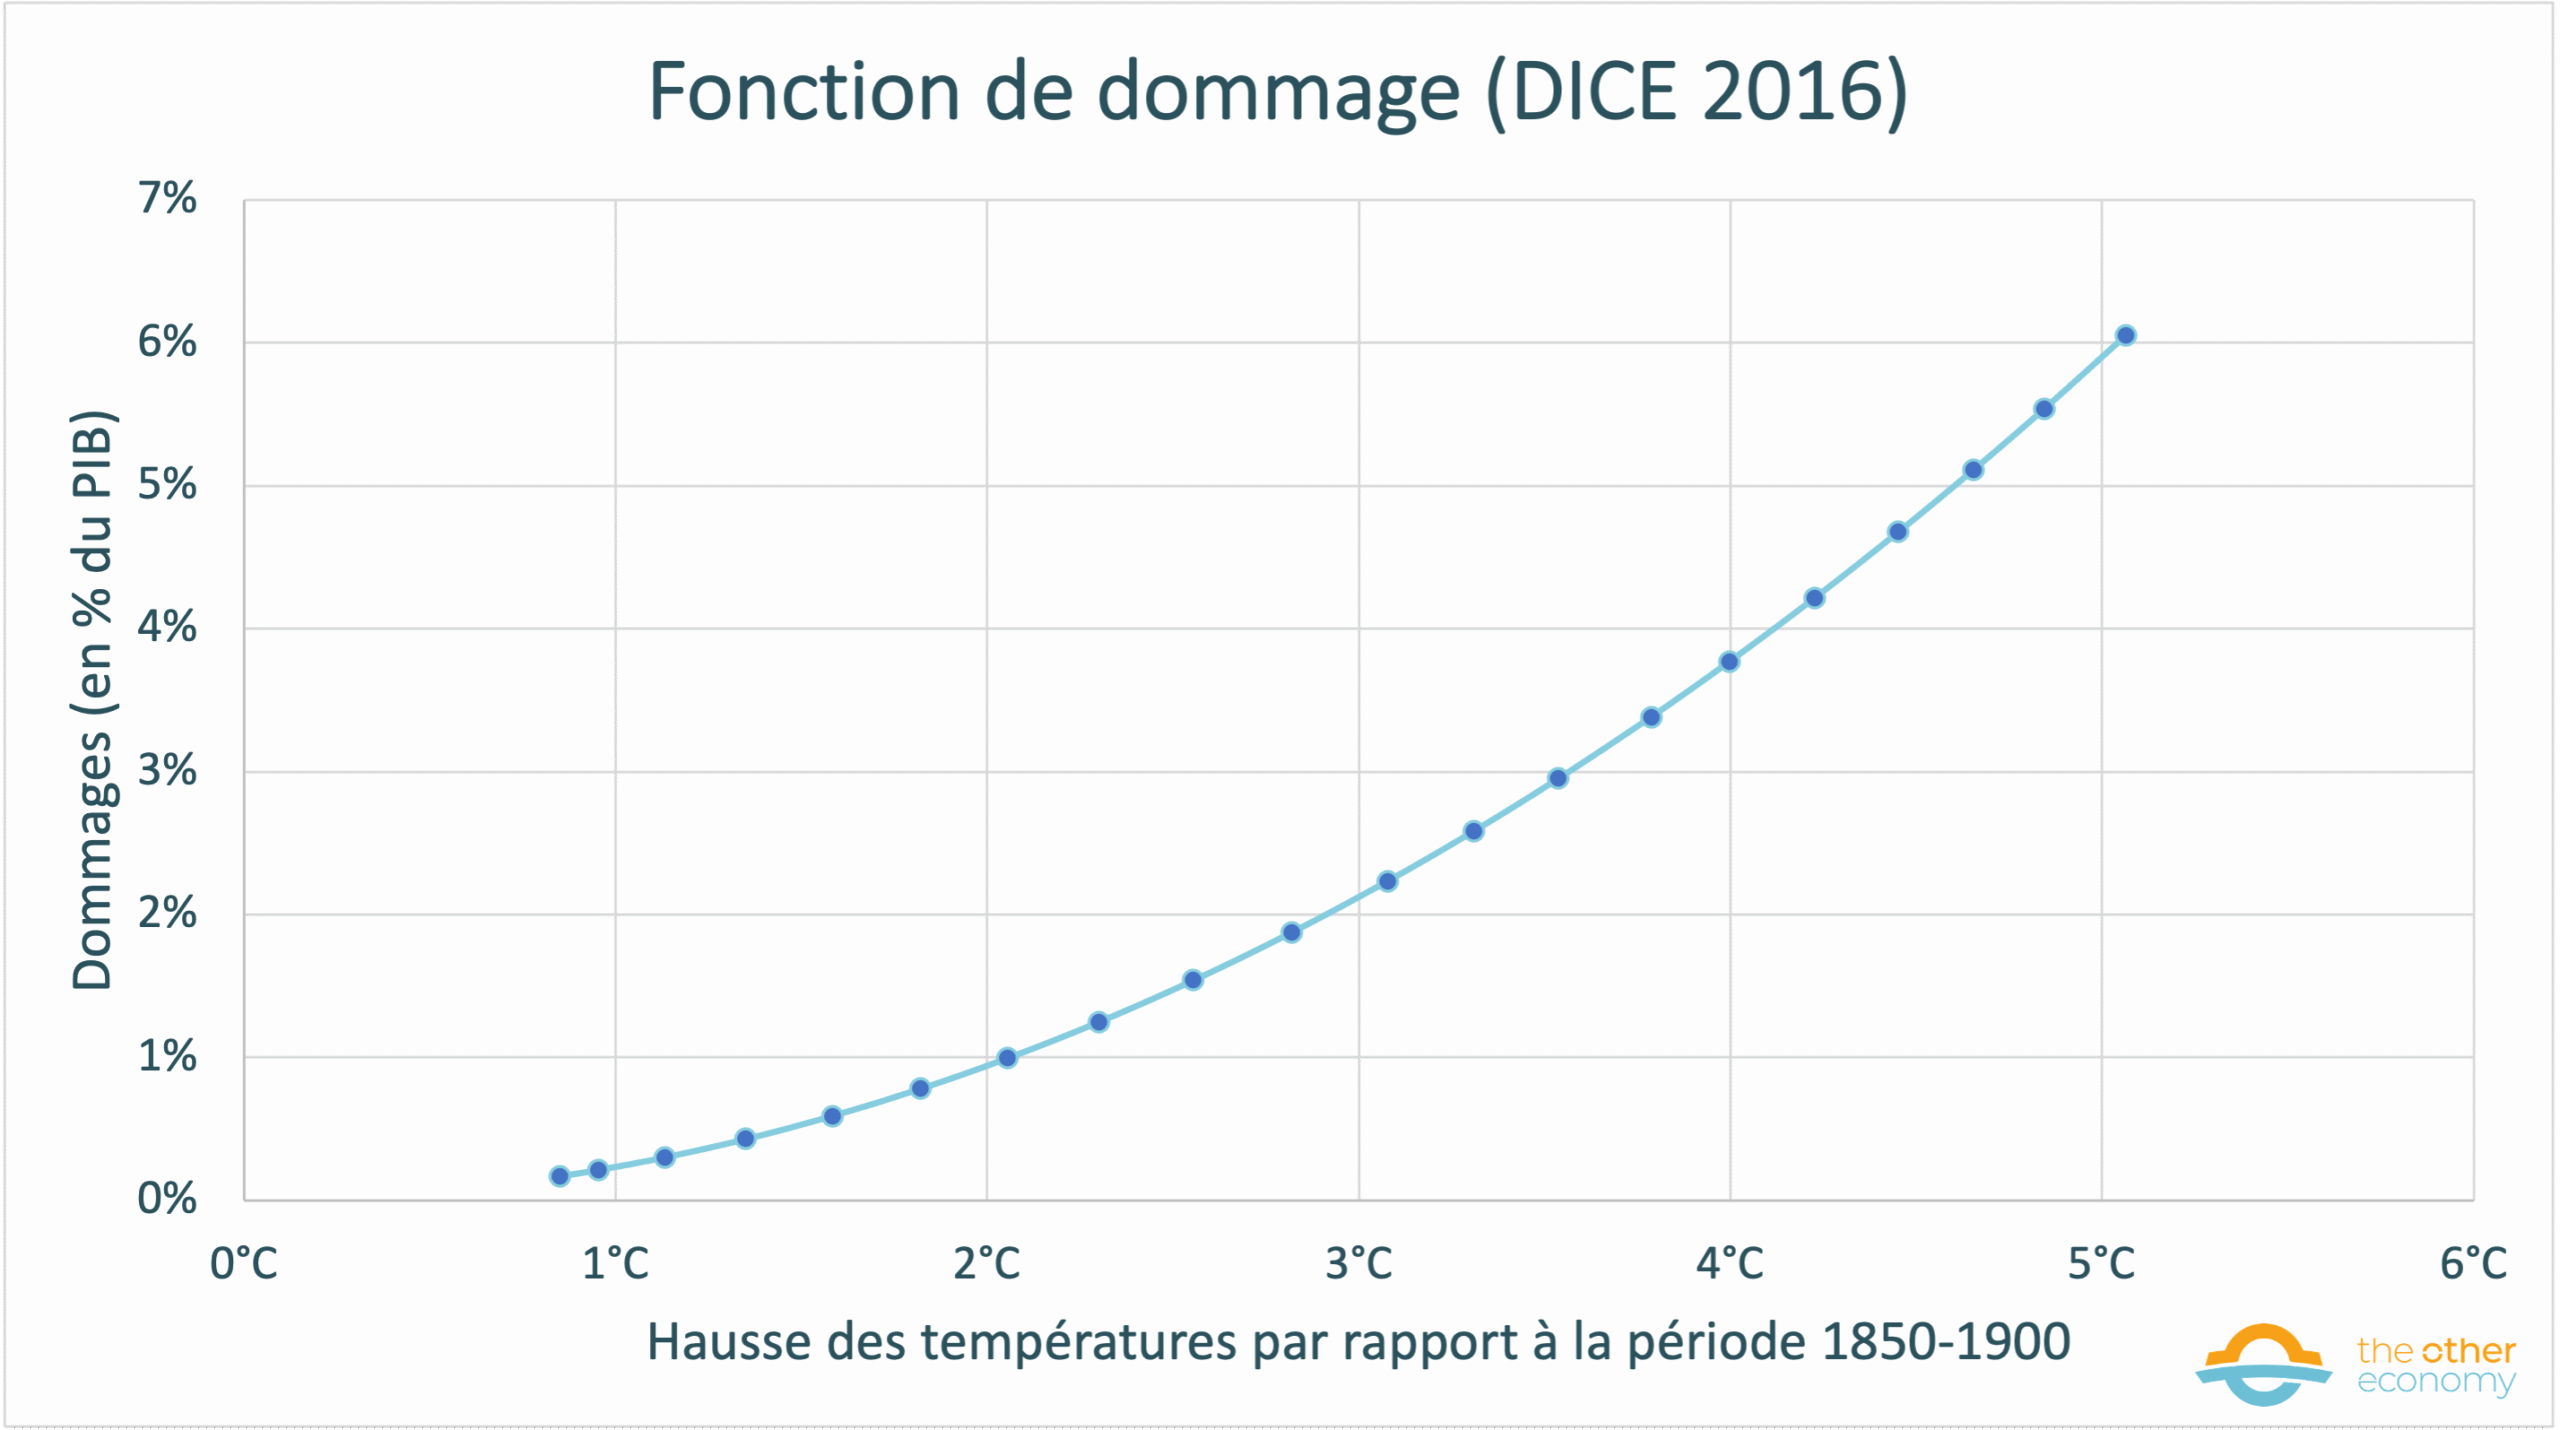
By way of illustration, here’s the damage function used in Nordhaus’ latest work (DICE 2016) 12. For 5°C of warming, we reach barely 6% of GDP losses.
Source Data uploaded by the NGFS (V1.1 NGFS Scenario Data _ “downloads” tab)
Including all factors, the model’s damage function assumes that damage represents 2.1% of global income in the event of 3°C warming, and 8.5% of income in the event of 6°C warming.
A change of climatic era 13 has a negligible effect on the economy!
Two main approaches are used to develop damage functions
In an article from 2020, economist Steve Keen takes a detailed look at the methods that Nordhaus and his successors invented in an attempt to quantify the damage to GDP caused by global warming.
–The enumerative approach consists of using natural science articles on the physical impacts of global warming (e.g. reduced agricultural yields) to translate them into production losses for certain sectors, and then aggregating the whole.
However, the number of sectors considered was very limited: most were directly exposed to meteorological conditions, such as agriculture, energy and forestry. In Nordhaus’ early work 14these sectors accounted for barely 13% of US GDP in 1991. However, the sectors considered have changed little since then 15.
The more recent statistical or econometric approach uses two types of data: cross-sectional data (geographical) and panel data (temporal).
In the first case, economists establish a correlation between the differences in GDP and climate observed today between several regions. On this basis, they deduce the effects on GDP that a rise in temperature would have on the same region. In the second case, a correlation is established between the evolution of GDP in a given region and the warming that has already taken place.
This assumes that the effect on GDP of a short-term variation in climatic conditions is a good approximation of the long-term effect of climate change. These approaches are highly open to criticism in many respects. Suffice it to say that correlation is not causation, and that extrapolating from differences (geographical or temporal) in the impact of the current climate what the economic impact of a totally unknown climate will be makes no sense.
What these methods have in common is that they are based on phenomena that are already known or anticipated, whereas global warming plunges us into unknown territory.
Global warming will reveal dependencies between nature and the economy that were previously unknown or ignored by economists. 16.
It will also have many “non-economic” impacts: health, social and even political (diseases, migrations, destabilization of societies) that are not taken into account at all by these damage functions.
One of the main problems is that climate change is taking us into uncharted territory: we don’t know how an increase in greenhouse gas concentrations will affect the climate and how climate change will affect the economy, simply because our economy has never, in the lifetime of homo sapiens, experienced anything like what we are likely to encounter. We can extrapolate the future based on the past, but whether, in these circumstances, this makes sense is highly problematic.
Global warming presents us with an unprecedented, unknown and highly risky situation. So it’s hardly “scientific” to extrapolate from current situations.
Threshold crossing (often referred to in physics as “threshold effects”)” is the best illustration of this.
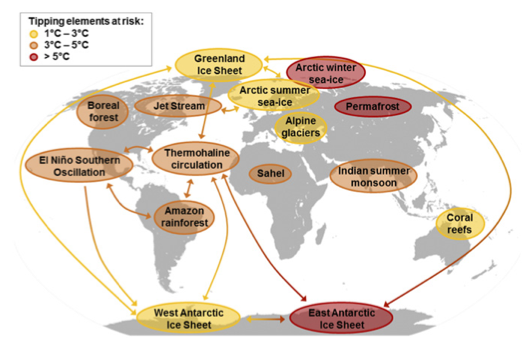
It has now been established that global warming will not be linear, and that there are tipping points (“tipping elements”, see map) which, once crossed, will trigger chain reactions leading to runaway global warming. 18.
Global map of potential cascade failures
Source Steffen, W., Rockström, J., et al (2018), Trajectories of the Earth System in the Anthropocene, PNAS (figure 3)
This graph shows the climate tipping points that could occur depending on the level of global warming. For example, among the tipping points occurring between +1 and +3°C of warming are the melting of the Greenland ice cap, Alpine glaciers and Arctic pack ice in summer.
These tipping points are one of the reasons for adopting the target of limiting global temperature rise to +2°C above pre-industrial levels.
However, the damage functions of Nordhaus and his successors generally do not include any tipping points or discontinuities in warming.
Worse still, the studies that attempt to assess them once again conclude that their impact is negligible! This is one of the findings of an article published in 2021 in the highly prestigious scientific journal Proceedings of the National Academy of Sciences (PNAS), summarizing various articles on the economic damage associated with threshold crossings.
Tipping points reduce global per capita consumption by around 1% in the event of 3°C warming, and by around 1.4% in the event of 6°C warming.
This work was strongly criticized in a short letter published in response in the journal PNAS and co-authored by economists and climatologists: “Estimates of economic and environmental damage associated with tipping points are not consistent with the scientific literature”. They conclude that future work on the macroeconomic damage of climate should be carried out in collaboration with climate scientists.
Despite these criticisms, some economists can now use the results of Dietz et. al to claim that they have incorporated tipping points into their damage function. This is what W. Nordhaus has done in the article in which he presents the 2023 version of the DICE model 19.
Thirty years after Nordhaus’ first work, the damage functions developed by his successors still produce the same kind of results.
The following two graphs show a sample of estimates of the impact of climate change on the economy found in recent academic literature.
On both graphs, each point represents the loss (or gain!) of GDP when a certain temperature level is reached.
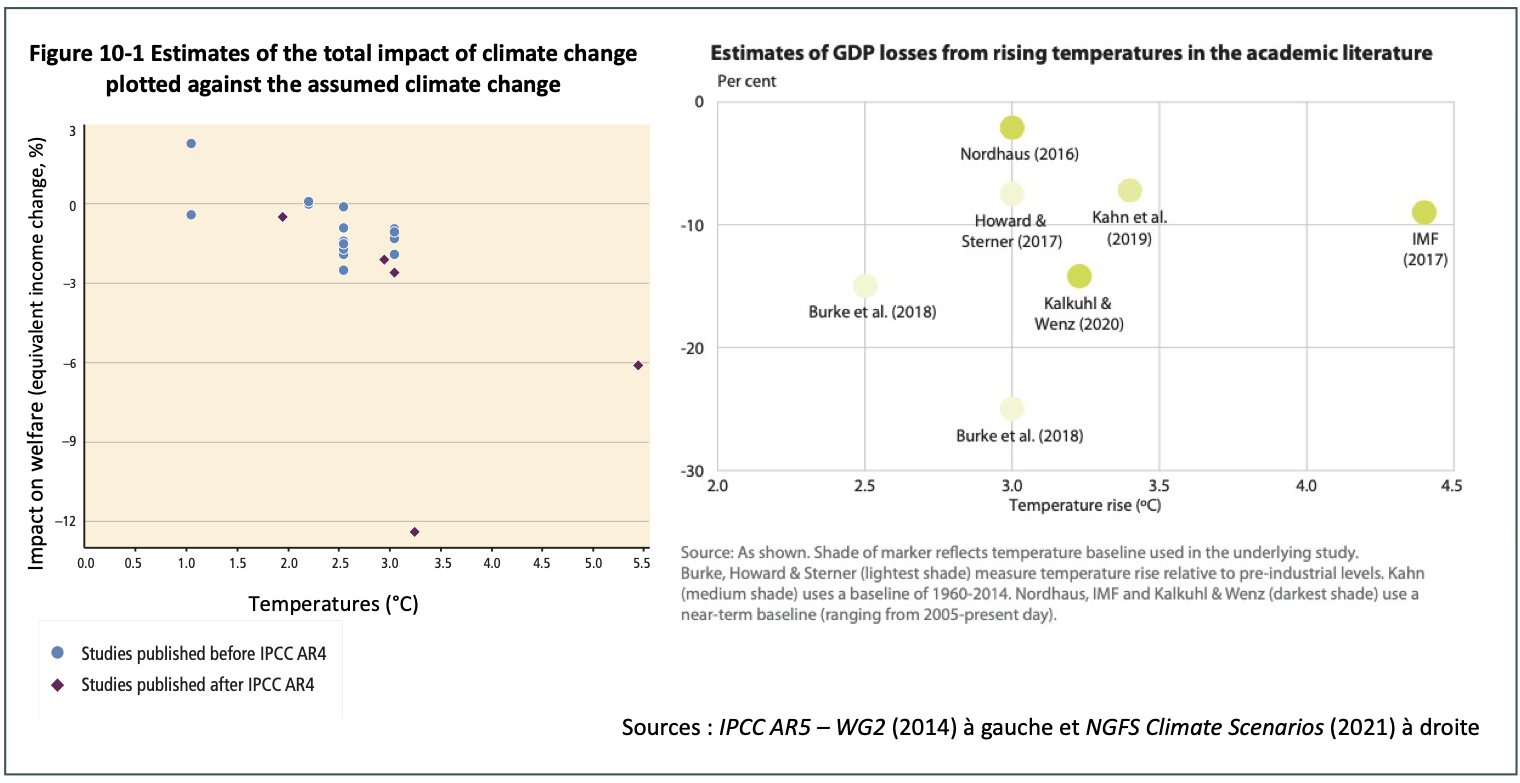
Source Left chart: Climate Change 2014, IPCC AR5 (5th IPCC report), Working group 2: Impacts, adaptation and vulnerability – Chap. 10: Key economic sectors and services (p690). Right chart: NGFS Climate Scenarios for central banks and supervisors, 2021 (p41)
- The first is taken from the fifth IPCC report (2014). As can be seen, in the vast majority of cases, GDP losses for global warming of +2°C to +3°C are less than 3%.
- The second comes from a report by the NGFS, the network of central banks concerned with climate risk to financial stability (see section 4.B on the work of the NGFS).
The assessments put forward are higher, reflecting a recent upward trend in damage estimates. However, they are still limited: remember that at over 3°C, a large part of the planet will become uninhabitable. Can we seriously expect this to translate into just a 10 to 25% loss of GDP?
All the more so since, as we’ll see in the next point, these losses are measured in relation to the level of GDP that would have been achieved assuming continuous economic growth throughout the 21st century in the absence of global warming. When damage functions indicate a GDP loss of 25%, this does not necessarily mean a recession.
The damage is all the more negligible in that it is calculated in relation to what the level of GDP would have been in the absence of global warming.
As noted in section 3.A, the DICE model assumes economic growth of around 2% per year throughout the 21st century.
Damages are applied to this rising GDP level. The following image shows what this means in concrete terms.
GDP and climate damage according to Nordhaus: no recession in sight!
The following graph assumes GDP growth of 2% per year between 2020 and 2100 (orange curve), i.e. a 5-fold increase over the period. Next, we apply the Nordhaus damage function (DICE-2016) in the case of warming leading to +5°C in 2100. As can be seen, growth slows just a little. No recession is in sight, despite warming that climate scientists predict will make the planet largely uninhabitable. Let’s not forget that without inhabitants, there’s no production, no consumption, and therefore obviously no GDP growth!
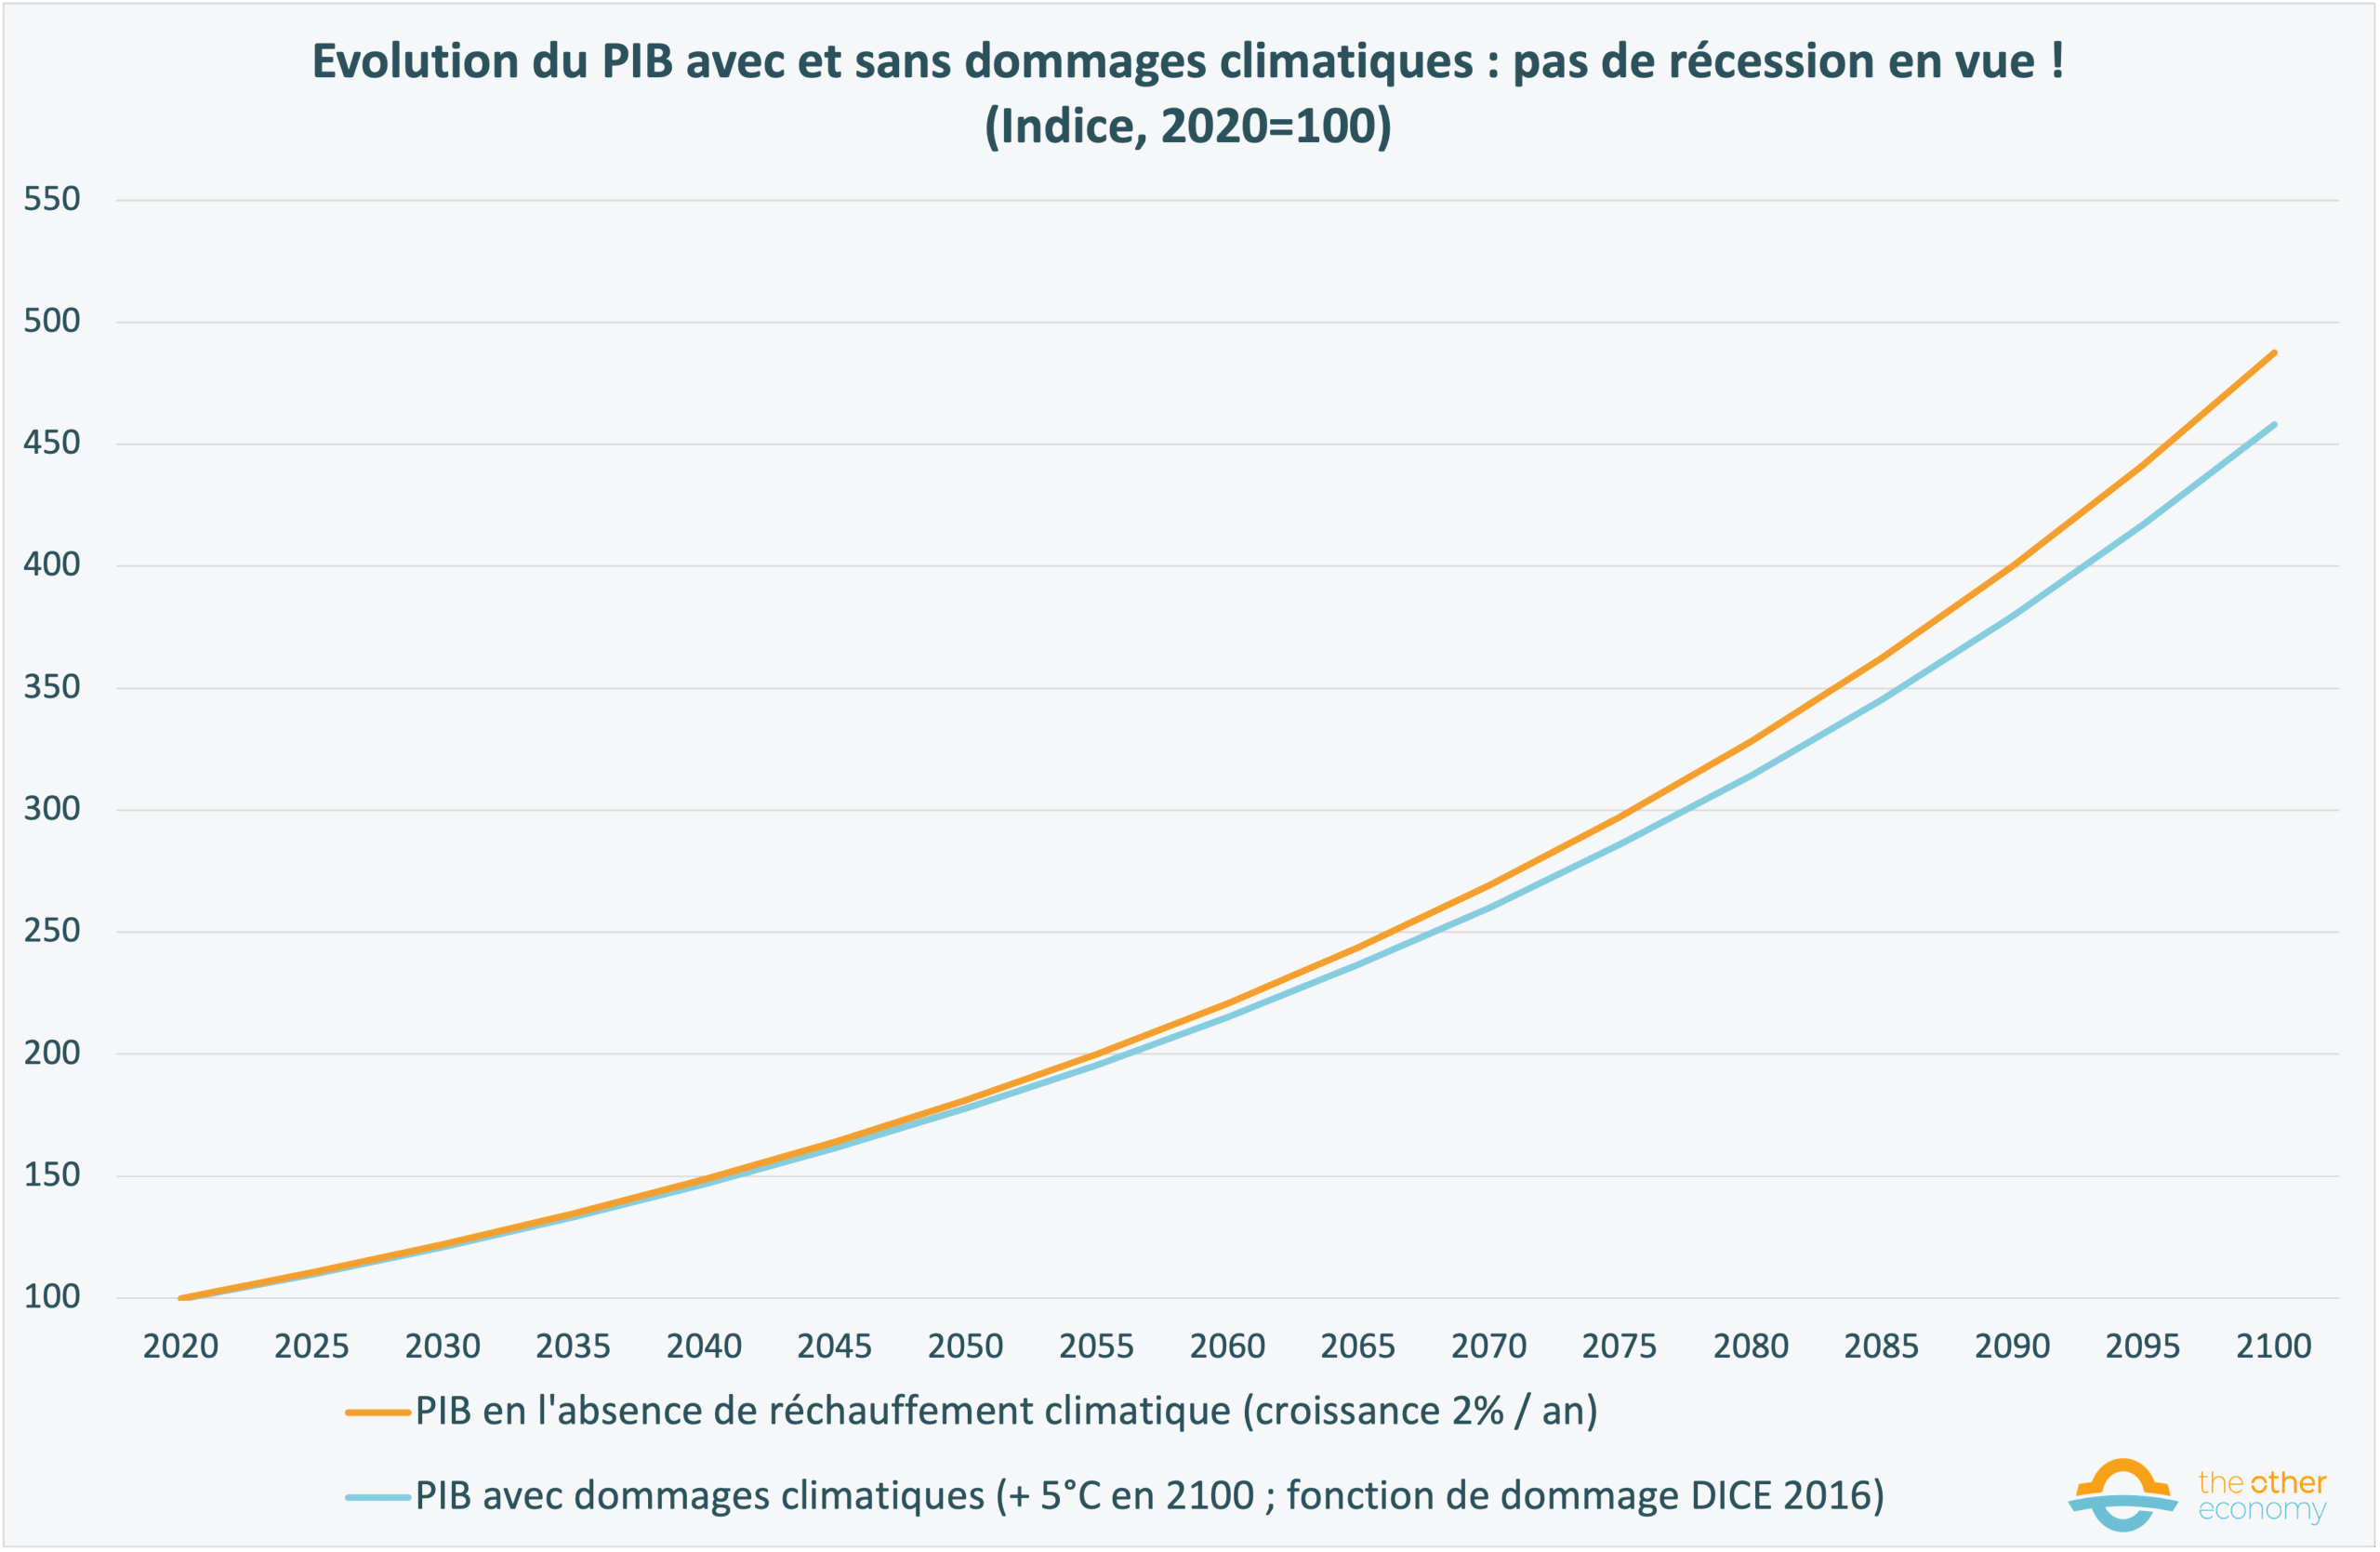
Source Author’s calculations based on NGFS data (V1.1 NGFS Scenario Data _ “downloads” tab)
The DICE model is no exception: all AMIs assume continuous growth in world GDP over the course of the 20th century.
As explained in section 2.A, transition scenarios are based on a narrative, a story describing a possible evolution of the world.
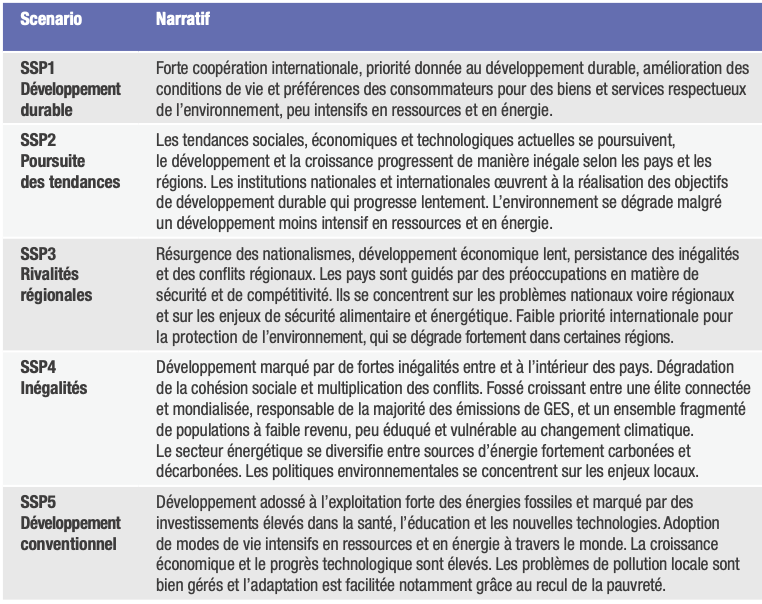
The most widely used narratives today are the “Shared Socioeconomic Pathways” (SSP – see box), which were built by the scientific community precisely to provide a common framework for analyzing the impacts of climate change and ways of coping with them.
Introducing the five Shared Socio-economic Pathways (SSP)
The SSPs are narratives exploring possible developments (social, economic, political, technological) in the world in the absence of climate policies and measures additional to those in place today. It is on the basis of these narratives that different types of climate policies will then be tested to build the transition scenarios.
Source Understanding transition scenarios, I4CE 2019
These narratives are complemented by quantitative socio-economic hypotheses. To each family of SSPs has been added :
- a demographic evolution trajectory ;
- an urban development trajectory ;
- three GDP trajectories (developed by research institutes IIASA and PIK, and by theOECD).
Economic growth in the 20th century is a basic assumption of all Shared Socio-economic Pathways.
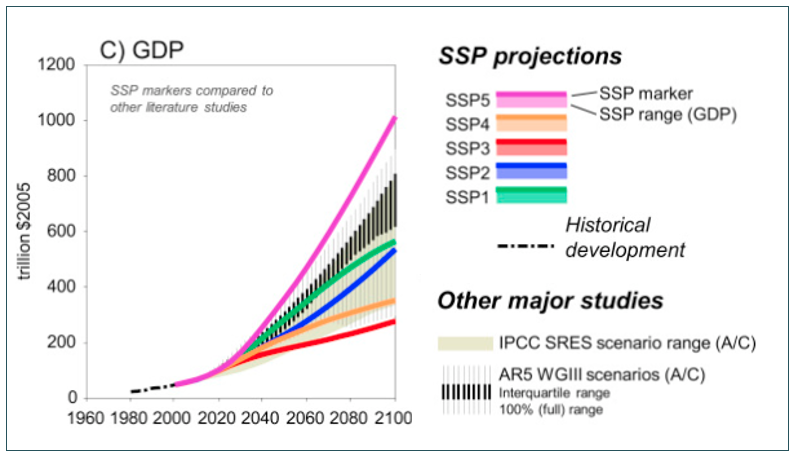
Source Rihai et al. The Shared Socioeconomic Pathways and their energy, land use, and greenhouse gas emissions implications: An overview, Global Environmental Change, 2017
The vast majority of IAMs (regardless of category) use SSP and associated trajectories20. GDP growth over the course of the century is therefore a basic assumption in models designed to assess the impact of climate change.
Applying existing damage functions to these IAM models will therefore always give the impression of slower growth, not recession or chaotic developments.
Few works, however, venture to publish graphs highlighting this, as the result seems so aberrant. The only one encountered during the writing of this fact sheet is the one published in 2021 by the ECB (see section 4.C).
Find out more
IAMs, and cost-benefit IAMs in particular, have been the subject of much criticism. In this fact sheet, we focus on those relating to climate damage assessment. To find out more, take a look at the following studies.
- The appallingly bad neoclassical economics of climate change, Globalizations (2020)
- Comment les économistes réchauffent la planète, Antonin Pottier, Edition du Seuil (2016).
- The Economics of Immense Risk, Urgent Action and Radical Change, NBER Working paper (revised 2022)
- The failure of Integrated Assessment Models as a response to ‘climate emergency’ and ecological breakdown: the Emperor has no clothes, Globalizations (2021)
- Finance in a hot house world, Finance Watch (2023)
- Loading the dice against pension funds, Carbon Tracker (2023)
What influence do these economic studies have on climate damage, and why are they dangerous?
Economic studies that conclude that global warming has a marginal impact on GDP growth have long dominated economic discourse on climate. While the limitations of this work are now widely criticized and recognized, it nevertheless continues to be used by central banks and financial supervisors to fuel research into climate risks.
However, these studies are dangerous: taken out of context (and therefore without descriptions of their limitations), they contribute to the arguments relativising the consequences of global warming put forward by personalities who approach the climate issue through this single entry point.
For over 25 years, the message that global warming has no significant impact on GDP has dominated economic discourse.
First of all, it should be remembered that climate and natural resources are not the focus of research in the discipline of economics (a point developed in the module on natural resources and pollution). In practical terms, even today, the macroeconomic models most widely used by public institutions to inform economic policy ignore the exploitation and destruction of nature (see module on GDP, growth and planetary limits).
Nordhaus had a major impact on the work that followed, given the paucity of work on the climate issue. This is explained, for example, by economist Steve Keen, who highlights the failure of the peer review process in the absence of a diversity of researchers.
As any academic knows, once you are published in a field, you will be selected by journal editors as a reviewer for that field. So, instead of providing an independent check on the accuracy of research, peer review can be used to impose a hegemony. As one of the first of the very few neoclassical economists to work on climate change, and the first to provide empirical estimates of the damage caused to the economy by climate change, Nordhaus was able to frame the debate and play a gatekeeper role.
Yet, for almost 25 years, Nordhaus and his successors have highlighted results concluding that climate change has a negligible impact on the economy. In his recommendations, Nordhaus has long advocated very gradual climate policies, starting with low emission reductions and building up over the course of the 21st century.
We had to wait until 2006 and the publication of economist Nicholas Stern’s report 21 to get the message across to the press and decision-makers that global warming would have significant economic consequences.
This work has therefore fuelled the discourse of climate sceptics. They have been a force for inaction, providing “scientific” arguments for political leaders and economic players who are quite content with the message that limited measures to combat global warming (policies of “small steps”, which make little difference to the functioning of the economic system) are “optimal”.
When Nordhaus was awarded the Nobel Prize, a great deal of criticism was voiced in the media about the methodologies he had helped to develop, and in particular about damage functions. The weaknesses and problems of this work are now widely recognized, and most publications referring to it are careful to point out its limitations. Paradoxically, this trend is accompanied by an increase in the use of this work by public players, driven by research into climate-related financial risks.
The growing use of damage functions driven by central banks
Awareness of systemic climate-related financial risks and creation of NGFS
In September 2015, in his “Tragedy of the Horizons” speech Mark Carney, Governor of the Bank of England and Chairman of the Financial Stability Board, states that global warming presents risks with potentially systemic financial consequences. He lists the different types of climate risk to the economy 22 :
- Physical risks: the impact of climate-related disasters on businesses, production chains and trade.
- Transition risks: the impact on carbon-intensive businesses of economic changes linked to the ecological transition aimed at reducing greenhouse gas emissions.
- Liability risks: legal action initiated by victims or other stakeholders.
These risks weighing on companies can spill over to financial institutions and thus threaten the stability of the financial system. This realization led to the creation in December 2017 of the NGFS (Network for Greening the Financial System), a network bringing together more than a hundred central banks and supervisors in 2022 to “help strengthen the global response required to meet the goals of the Paris Agreement and enhance the role of the financial system in managing risk and mobilizing capital for green and low-carbon investments” (see the NGFS website).
NGFS develops transition scenarios
The NGFS has worked on different transition scenarios to provide its members with a common reference point for assessing the physical and transition risks in their respective areas.
Scenarios range from an orderly transition (“net zero” 2050) limiting both transition and physical risks, to a simple continuation of current trends (“current policies”) where transition risks do not exist but physical risks are significant. In the former case, warming is limited to 1.5°C; in the latter, it rises to more than 3°C (and may rise as high as 5°C, the shaded part of the diagram below reflecting uncertainties about the climate system’s response to a certain level of warming).
Network for Greening the Financial System (NGFS) scenarios
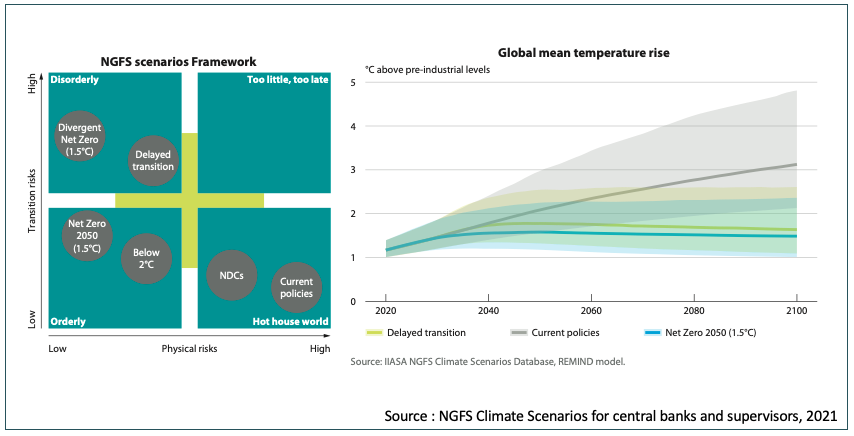
Source NGFS Climate Scenarios for central banks and supervisors, 2021 (p 7 and 26) The data and data visualization tools used to explore the scenarios are available on the NGFS Scenario Explorer (click on the “Guest login” button to access the data).
Physical risks are calculated on the basis of damage functions
To study its scenarios, the NGFS uses much more sophisticated models than DICE-type cost-benefit IAMs.
These are the detailed process-based IAMs presented in section 2. In order to estimate the physical risks of global warming, the NGFS has incorporated damage functions into these IAMs, based on academic literature. Thus, in the first version of its scenarios published in 2020, three damage functions were tested (one of which extended to 25% GDP losses; see graph below). In the end, it was Kalkuhl and Wenz (2020) who were chosen. 23 was chosen for the 2021 version of the scenarios.
The results are presented below: the climate damage of a scenario leading to over 3°C does not even reach 15% of global GDP.
Remember that this represents 15% less GDP than would have been the case in the absence of climate change.
Estimating physical risks in NGFS scenarios
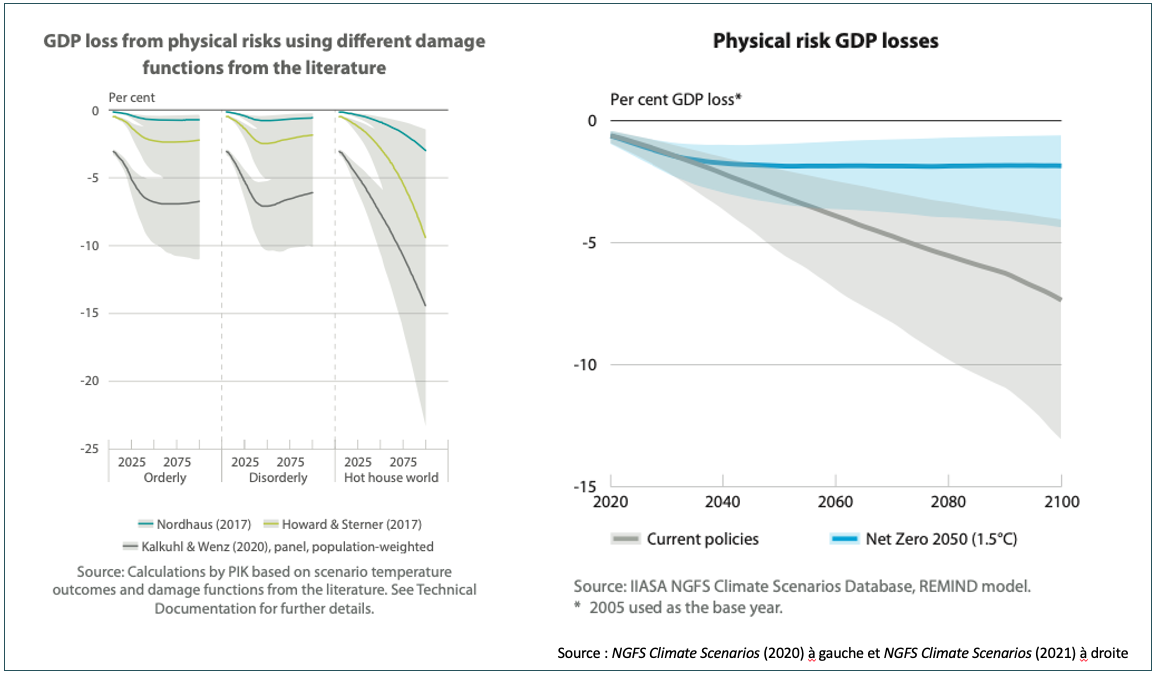
Source NGFS Climate Scenarios for central banks and supervisors 2020 (p29) and 2021 (p30)
The document does state that this “methodology does not include impacts related to extreme weather, sea level rise or broader societal impacts related to migration or conflict.”
But is this enough to justify the publication of such a graph in a document that serves as a reference for all central banks when estimating climate risks?
It was not until the fifth version of the NGFS scenarios24 (2024) that a less optimistic damage function regarding the consequences of global warming was adopted.
It is the damage function developed by Koltz et al.25, which in the NGFS scenarios results in a 15% decline in GDP for +2°C in 2050 and a 33% decline for +3°C in 2100.
It should be noted, however, that the authors of the report mention that these declines in GDP are relative to a baseline scenario in which GDP increases throughout the century (as explained in section 3.3). Climate damages therefore have a minimal effect on GDP: they don’t lead to recession, but simply to slower growth. This is the first time that this factor has been explicitly detailed in NGFS reports.
While damage projections are much higher with the new damage function, a global economic recession caused by climate change is not foreseen. A 30% loss under the Current Policies by 2100 scenario should be compared with a baseline that assumes no climate change. Under the baseline, the GDP is expected to grow substantially by the end of the century, so even with climate change damages standing at 30%, global GDP would still grow by more than 150% in the Current Policies scenario by 2100 compared to today (while it would grow by 215% without climate change).
The work of the NGFS serves as a framework for central banks to estimate climate risks.
The ECB used this framework to carry out climate stress tests for European banks.
Here are the results concerning the impact of physical risks on GDP. The difference between a transition scenario enabling global warming to be limited to 1.5°C and the absence of ecological transition policies is a GDP that grows just a little slower.
In terms of physical climate risks, the ECB believes that there is little difference between a very proactive transition and doing nothing.
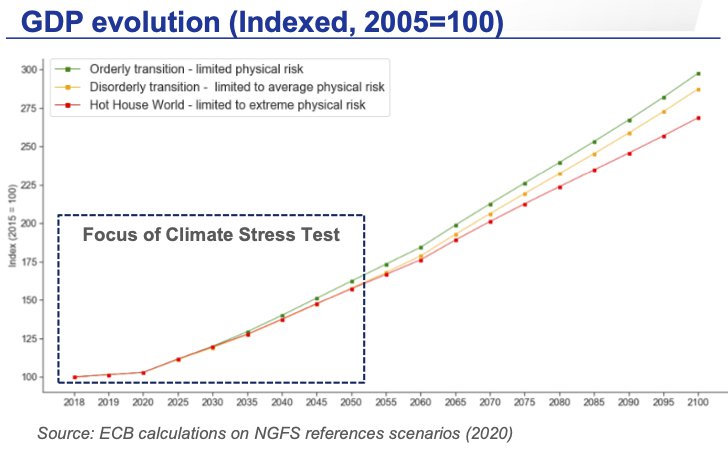
Source ECB economy- wide climate stress-test, presentation by Laurence Parisi at E-Axes Forum, Dec. 2021. and the ECB publication from which the presentation is taken.
The Council of Economic Advisers and the Office of Management and Budget, both part of the Executive Office of the President of the United States, published a White Paper on climate-related macroeconomic risks in 2022.
We find the following assessments for the “current policies” scenarios, i.e. those in which governments do not implement any climate policies in addition to those already in place. Once again, the impact on growth is very low.
In the United States, White House economic advisors present similar results
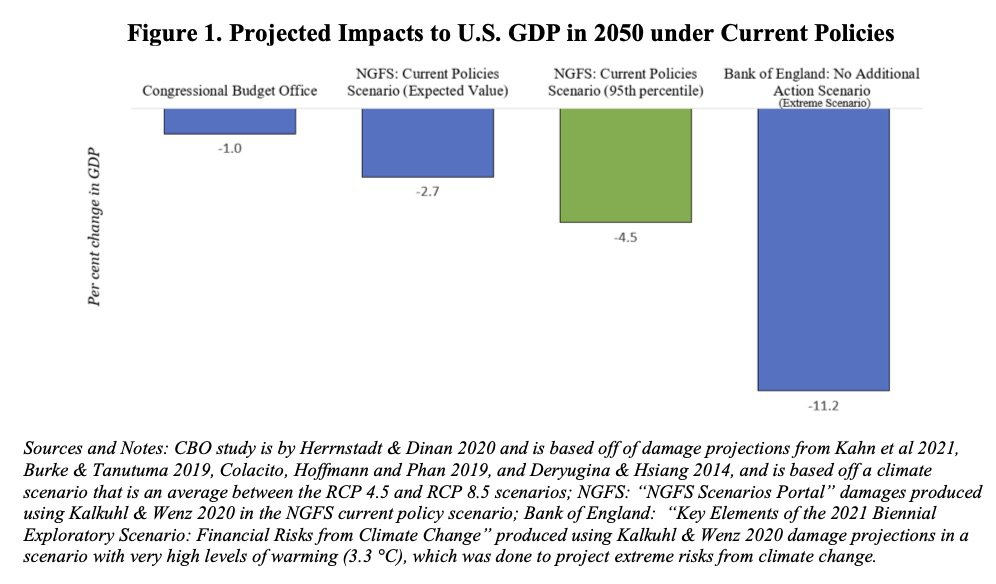
Source Climate-Related Macroeconomic Risks and opportunities, White Paper Council of Economic Advisers, Office of Management and Budget (2022)
In early 2022, the Bank of England published the Climate Biennial Exploratory Scenario report, in which it explores the transition and physical risks to the country’s financial system in three scenarios. Two scenarios explore two paths to British carbon neutrality by 2050, depending on whether action is taken “Early Action” or “Late Action”. A third scenario, “No Additional Action”, explores the physical risks that would begin to materialize if governments around the world failed to take action to combat global warming.
As can be seen from the graph, none of the scenarios involves a recession. The “No Additional Action” scenario leads to a temperature rise of over 3.3°C in 2050. This translates into only a slight slowdown in growth compared with the “Early action” scenario, which manages to keep warming below 2°C.
Summary of impacts identified in the Climate Biennial Exploratory Scenario (2022)
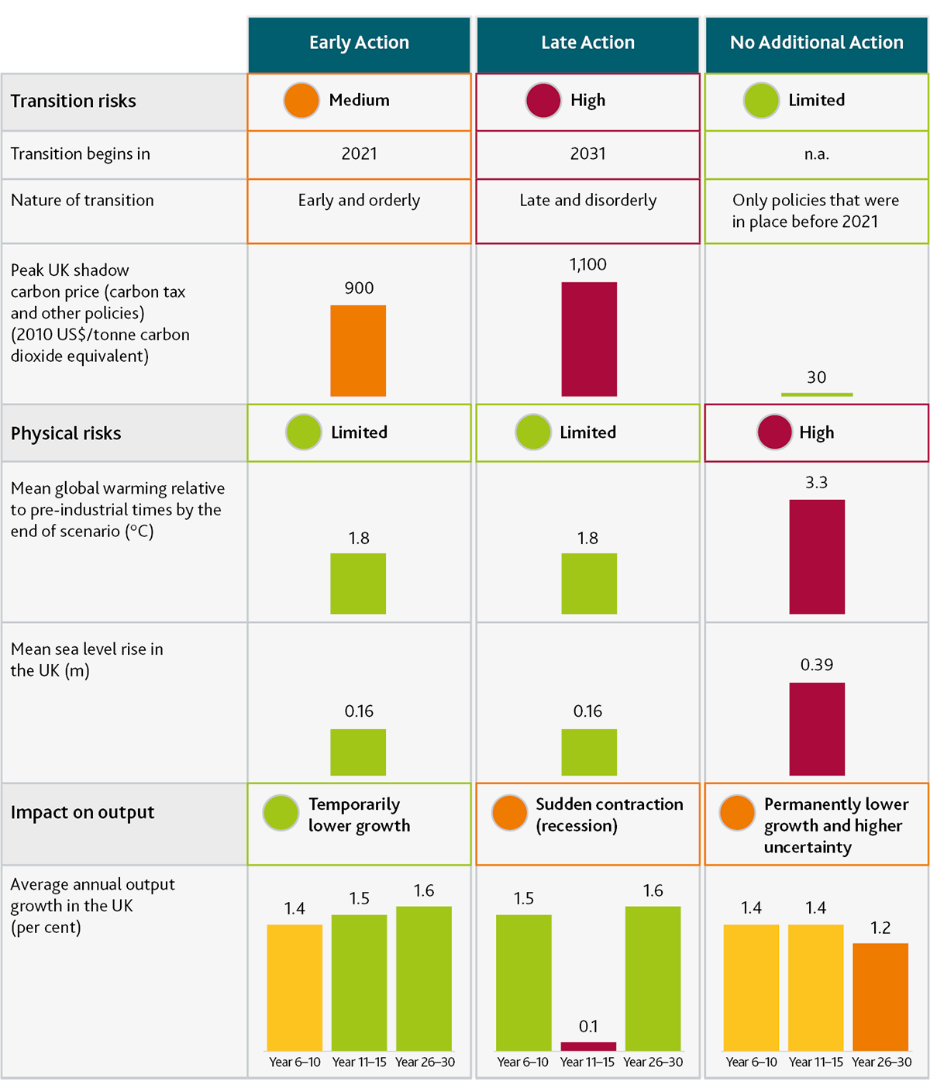
Source Climate Biennial Exploratory Scenario, Bank of England (2022)
Not only is this work scientifically questionable, it’s also dangerous!
There are three main reasons for this
1. Even if awareness of the reality of global warming is now fairly widespread, climate sceptics remain numerous.
In a context where information now circulates quite widely via images relayed on social networks, graphs such as the ECB’s presented above, taken out of the context of their report, can easily fuel a climatoskeptic discourse. The explanations we give in this fact sheet on how the impact of climate change on growth is assessed can help you counter climate-skeptic “arguments”.
2. There’s a difference between accepting the reality of climate change and really understanding what it means.
In economic and financial circles, professionals who approach the climate issue mainly through the type of reports presented above may therefore have the image that global warming in excess of 3°C would certainly be detrimental, but manageable nonetheless.
This is how, for example, the director of the Banque Publique d’Investissement France can believe he’ s speaking out against global warming while asserting that “1.5°C is cooked, but we must try to keep temperatures below 2.5°C, let’s say 3°C”.
It was also on the basis of this type of work that Stuart Kirk, HSBC’s Head of Responsible Investment, was able to give a speech at a conference organized by the Financial Times in May 2022, explaining why investors didn’t have to worry about climate risks.
3. Without explicitly saying so, these studies suggest that economic growth (assumed to be essentially independent of climate change, since it is based on continuous technical progress) will enable humanity to provide itself with the means to adapt to a climate change that is, after all, “manageable”.
On the contrary, the message from climatologists is to do everything possible to avoid the unmanageable and limit the already serious consequences of a 1.5°C-2°C scenario.
This work is not only scientifically questionable, because it is based on a framework that we know to be deeply flawed, but also and above all dangerous, because it suggests that this framework is plausible, and thus feeds the rhetoric that slows or even discourages action against climate change.
The fact that this work is still published in leading scientific journals and increasingly used by central banks is all the more questionable given that other approaches to climate damage have been developed.
Thus, for Martin Weitzman, one of Nordhaus’s main critics also shortlisted for the 2018 “Nobel Prize”, the existence of climate tipping points makes any attempt to assess future damage futile. The significant probability of warming scenarios with dramatic consequences for humanity, in itself, justifies radical action to reduce greenhouse gas emissions. In his view, such policies could be seen as “insurance policies” against catastrophic climate scenarios.
Find out more
To find out more about the work published by financial regulators on climate risk and the issues it raises, please consult the following publications.
- Lint Barrage and William Nordhaus, Policies, projections, and the social cost of carbon: Results from the DICE-2023 model, The Proceedings of the National Academy of Sciences, 2024. ↩︎
- To find out more about how the IPCC prepares its reports, consult the dedicated fact sheets on its website. ↩︎
- Impacts of climate change: Health and Society on the Ministry’s website ↩︎
- RCPs (Representative Concentration Pathways) are trajectories for the evolution of greenhouse gas concentrations in the atmosphere. Four RCPs were developed for the IPCC Fifth Assessment Report (and a 5th for the 1.5°C report) to serve as input data for climate models, enabling different warming scenarios to be explored. RCPs are named according to the radiative forcing they achieve by 2100. RCP8.5 is based on a continuous and sustained increase in GHG emissions until 2100, leading to a radiative forcing of 8.5 W/m2 in 2100 and a temperature rise of ~ 4.3°C (3.2 – 5.4°C). ↩︎
- According to the IMF’s World Economic Outlook, global GDP fell by -0.1% in 2009 (-3.3% for advanced economies) and by -3.1% in 2020. ↩︎
- See Alain Grandjean and Gaël Giraud (2017) “Comparaison des modèles météorologiques, climatiques et économiques”, Working Paper of the Energy and Prosperity Chair. ↩︎
- For example, floods, storms, rising sea levels and drought can destroy buildings, recycling plants, renewable energy production plants – in short, a whole range of structures important to the transition. ↩︎
- The IAMC is a consortium of scientific research organizations created in 2007 at the request of the IPCC. Its role is to coordinate the work of the modelling community in developing transition scenarios. ↩︎
- Dynamic Integrated model of Climate and the Economy. ↩︎
- For more details on this classic way of modeling economic growth and its limits, see the section on macroeconomic models in the module GDP, growth and planetary limits. ↩︎
- Well-being is equated with consumption. ↩︎
- Nordhaus, W. D. (2017), Social cost of carbon in DICE model, Proceedings of the National Academy of Sciences. ↩︎
- While climate science cannot precisely determine the effects of a 5°C rise in the planet’s average global temperature, paleoclimatologists can tell us what 5°C less would represent. In fact, this is the state the planet was in at the time of the last glacial maximum (around 20,000 years ago). The local consequences of such a temperature difference were enormous: the sea level dropped by around 100 metres (you could walk from France to England on dry land) and Northern Europe was covered by an enormous glacier. ↩︎
- Nordhaus, W. D. (1991), To Slow or Not to Slow: The Economics of The Greenhouse Effect, The Economic Journal ↩︎
- See the list of sectors covered by the different damage functions using the enumerative method in the 2014 IPCC report (Working Group 2, Chapter 10 supplementary material). This list has been reproduced and expanded in the appendix to the article by Steve Keen (2020).The appallingly bad neoclassical economics of climate change, Globalizations (2020) ↩︎
- For example, the work of energy economists highlights the impact of global warming on energy production (reduced efficiency of thermodynamic cycles in gas-fired, nuclear and solar thermal power plants, as these efficiencies are highly dependent on the temperature of the cold source associated with the atmosphere or water). Energy is absolutely essential in all economic sectors, and its effect on GDP is largely underestimated by economists working on growth (see the module on GDP, growth and planetary limits). ↩︎
- The Economics of Immense Risk, Urgent Action and Radical Change: Towards New Approaches to the Economics of Climate Change, NBER Working paper, revised 2022. ↩︎
- Lenton, T. M., Held, H., et al. (2008), Tipping elements in the Earth’s climate system Proceedings of the National Academy of Sciences; Steffen, W., Rockström, J., et al. (2018), Trajectories of the Earth System in the Anthropocene, Proceedings of the National Academy of Sciences ↩︎
- Lint Barrage and William Nordhaus, Policies, projections, and the social cost of carbon: Results from the DICE-2023 model, The Proceedings of the National Academy of Sciences, 2024 ↩︎
- When SSPs are not used, the GDP trajectory results either from calculations internal to the model used (as in the case of DICE), or from the results of another model. In all cases, GDP is growing because the factors of production, and in particular general factor productivity, are growing. ↩︎
- Stern, N. H. (2006), Stern Review: The Economics of Climate Change, Volume 30, London: HM treasury. ↩︎
- You can find out more about the systemic risks of global warming in the Finance module. ↩︎
- Kalkuhl, M., & Wenz, L. (2020), The impact of climate conditions on economic production. Evidence from a global panel of regions Journal of Environmental Economics and Management. ↩︎
- NGFS Climate Scenarios for central banks and supervisors – Phase V, Novembre 2024. ↩︎
- Maximilian Kotz, Anders Levermann & Leonie Wenz, The economic commitment of climate change, Nature, 2024 ↩︎