
This text has been translated by a machine and has not been reviewed by a human yet. Apologies for any errors or approximations – do not hesitate to send us a message if you spot some!
GDP growth means energy consumption : transport, construction, factories, etc. The European Union imports oil, fossil gas, coal, uranium and photovoltaic panels on a massive scale from countries of varying reliability. This dependence makes our economy vulnerable.
The energy bill weighs heavily on the trade deficit and people’s purchasing power. The underlying geopolitical risk can arise at any time, as demonstrated by the war in Ukraine: some factories had to close, and some households suffered from the winter cold because of soaring energy prices.
Beyond the benefits for the climate, strengthening our independence is a tremendous opportunity to protect our economy and free ourselves on the geopolitical stage.
Europe is dependent on the rest of the world for its energy supply
In 2023, the European Union’s primary energy consumption will be split as follows: around 40% oil, 20% fossil gas, 10% coal, 10% uranium, 5% solar and wind power; the remainder being made up of wood, biofuels and hydroelectricity.1
Not all of these energies are available in Europe.
European Union: sources and types of energy
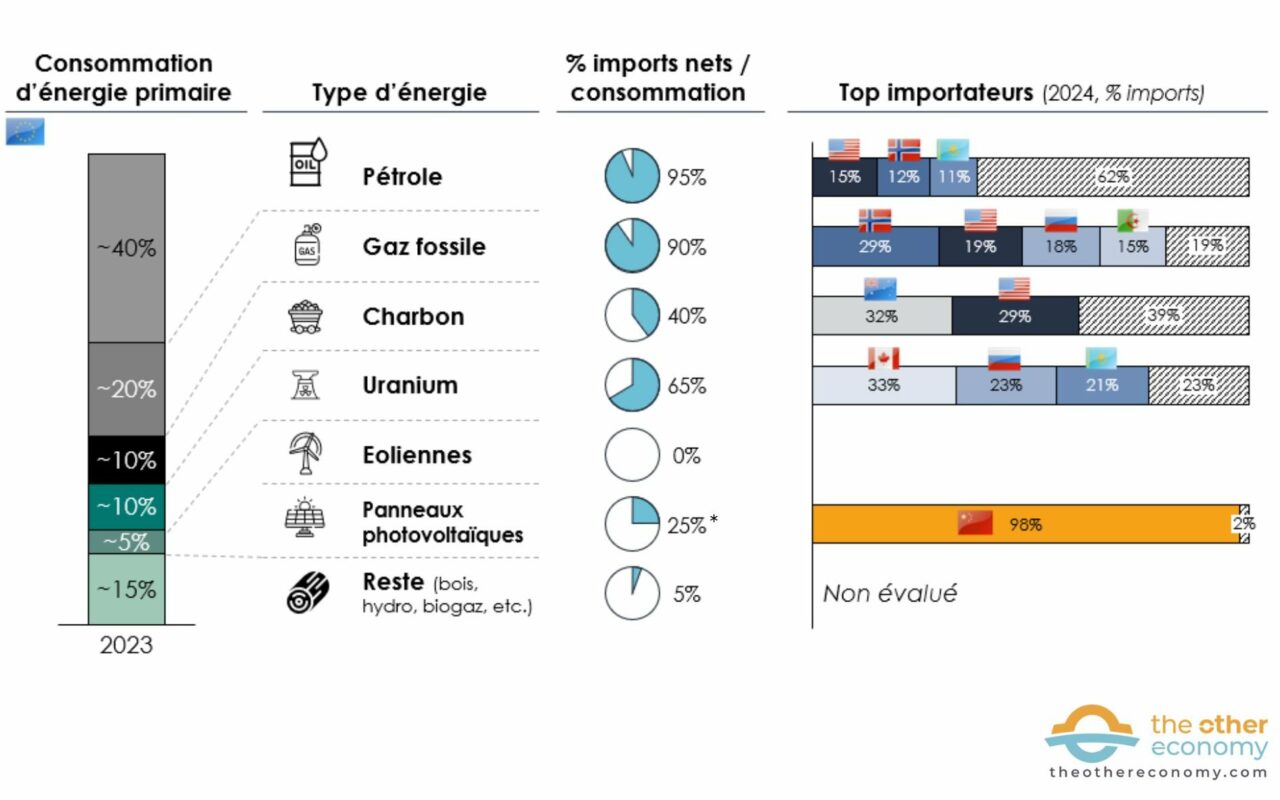
*The EU imports 95% of solar panels in a given year. But energy consumption corresponds to the stock of installed panels, i.e. 25% of the current stock. Installation is proceeding at a high exponential rate.
Source: Eurostat, Solar Power Europe, Bruegel, Word Bank
90% to 95% of the fossil oil and gas consumed in the EU is imported. Only production in the Netherlands, Denmark and Romania remains significant, but in decline. As oil is liquid and therefore easily stored and transported, the market is globalized and rather fragmented. The top 3 suppliers (USA, Norway and Kazakhstan) account for only 40% of supply. 2
By contrast, the gas market has historically been more regional, with overland pipelines from Norway, Russia and Algeria. The war in Ukraine led to the closure of Russia’s main land routes3
Coal, on the other hand, has historically been a locally exploited resource. The main deposits were exhausted in the second half of the 20th century, following the first two industrial revolutions. Poland, Germany and a few Eastern European countries are exceptions. As a result, coal now accounts for a minority share of the energy mix, with only 40% imported. 2
Uranium, whether natural or enriched, is 65% imported. No mines are exploited in Europe, and enrichment capacities are heterogeneous, with reactors in Eastern Europe (of Soviet design) still heavily dependent on their Russian neighbor. 6
Finally, photovoltaic solar panels and wind turbines are the product of two radically different industrial realities. On the one hand, over 95% of solar panels are imported, almost exclusively from China. On the other, the European Union manufactures more wind turbines than it installs on its territory, and thus generates trade surpluses via its exports.
In short, the European Union imports over 70% of the energy it consumes.
Not all energies are equal when it comes to energy independence
Fossil fuels (coal, oil, natural gas) and nuclear energy are stock energies. Once the fuel is consumed, it has to be replenished.
For fossil fuels, Europe has strategic stocks equivalent to a few months of current consumption.7 As a result, supply is virtually just-in-time.
For nuclear power, uranium’s high energy density (one kg of natural uranium contains 10,000 times more energy than one kg of coal) means that it can be used to produce electricity.8) makes it easy to store the equivalent of several years’ electricity production.9 Dependence is therefore reduced.
As for renewable energies, these are flow energies. Once a wind turbine or solar panel has been installed, the device produces for decades, capturing the flow of energy (wind or sun). As with nuclear power (see box), the “statistical convention” is to consider that renewable production is 100% domestic. Even if China stops supplying solar panels, Europe will be able to continue producing with existing panels, at least for a while. 10
In other words, a country’s energy dependency ratio can be calculated by assessing the weight of net fossil fuel imports (imports – exports) on the country’s total energy consumption.
Russia and the USA have a dependency rate of 0%, as they export more energy than they import. By contrast, Europe is at 58%, Germany 67%, France 51%, India 35% and China 20%. 11
The global scale of dependence on fossil fuels
52 countries import more than half their primary energy in the form of fossil fuels.
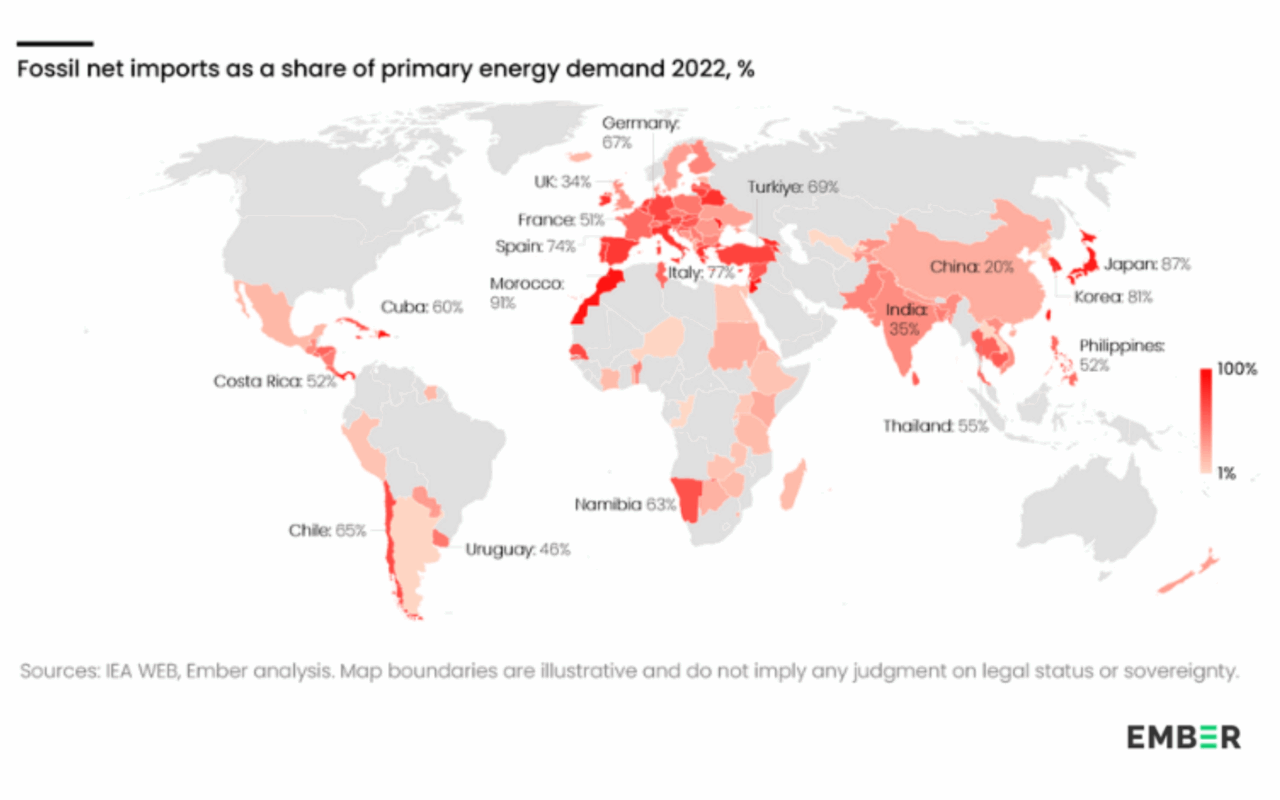
Source: Energy Security in an Insecure World, Ember, 2025
These figures therefore reflect a greater or lesser dependence on fossil fuel imports in relation to the country’s primary energy consumption.
The special case of nuclear power
If France’s rate of energy independence seems better than Germany’s, it’s because over 90% of its electricity comes from nuclear and renewable sources – compared with 55% in Germany.12
However, in the 1970s, when uranium was generally mined in the country of production, the “statistical convention” was to consider nuclear reactor energy production as domestic production.13 But since the early 2000s, France, for example, has stopped mining uranium. In Europe, the last mine, in Romania, closed in 2021. Yet the statistical convention has not changed.
There’s also a distorting effect of thinking in terms of primary energy. Primary energy corresponds to all the energy contained in natural resources such as uranium or oil. However, in the case of uranium, 2/3 of the energy it contains is lost at the power plant in the form of heat. If we reasoned in terms of final energy, France’s energy dependence would be closer to 60%. 14
Finally, it should be noted that in Europe, these energy dependency rates have stagnated on average for over 20 years.15 The boom in solar and wind power renewables (now accounting for 5% of the energy mix) has been offset by the decline in domestic fossil fuel and nuclear energy production.
Energy dependence accentuated by geopolitical risks
This notion of energy dependence is nevertheless insufficient to assess the geopolitical risk associated with energy supply. It says nothing about the reliability of supplier countries. Importing oil from Norway or Russia does not entail the same risk. What’s more, this approach is binary and overly simplistic: importing fossil fuels is considered a 100% dependency, whereas importing uranium or solar panels generates no dependency at all.
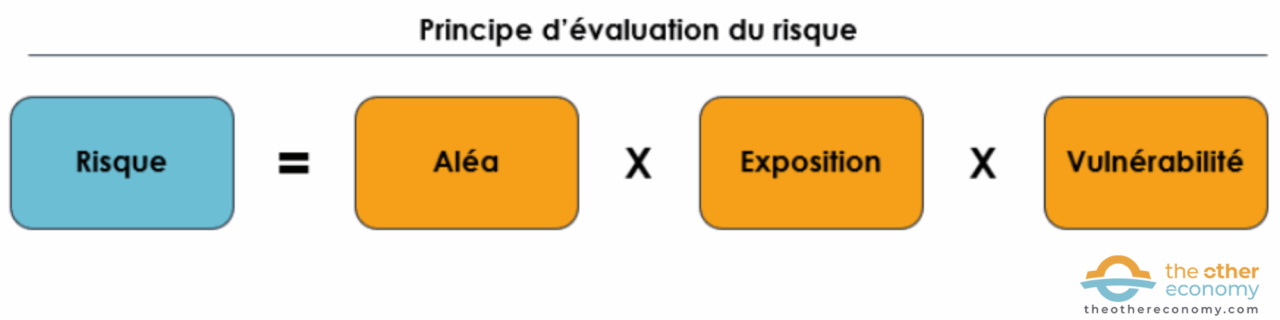
For a better understanding of this geopolitical risk, the following 3 key factors should be assessed:
- Hazard : the probability that the relationship with a third country will deteriorate.
- Exposure : the proportion of energy consumption exposed to supplies from a third country.
- Vulnerability : the severity of the impact if the hazard occurs.
Hazard: the reliability of supplier countries
The Democracy index16 assesses the state of democracy in countries around the world. Scandinavian countries are considered full-fledged democracies (score of 9 to 10), France and Poland imperfect democracies (score of 7 to 8), Turkey and Mexico hybrid regimes (score of 4 to 6), China and Russia authoritarian regimes (score of 1 to 3).
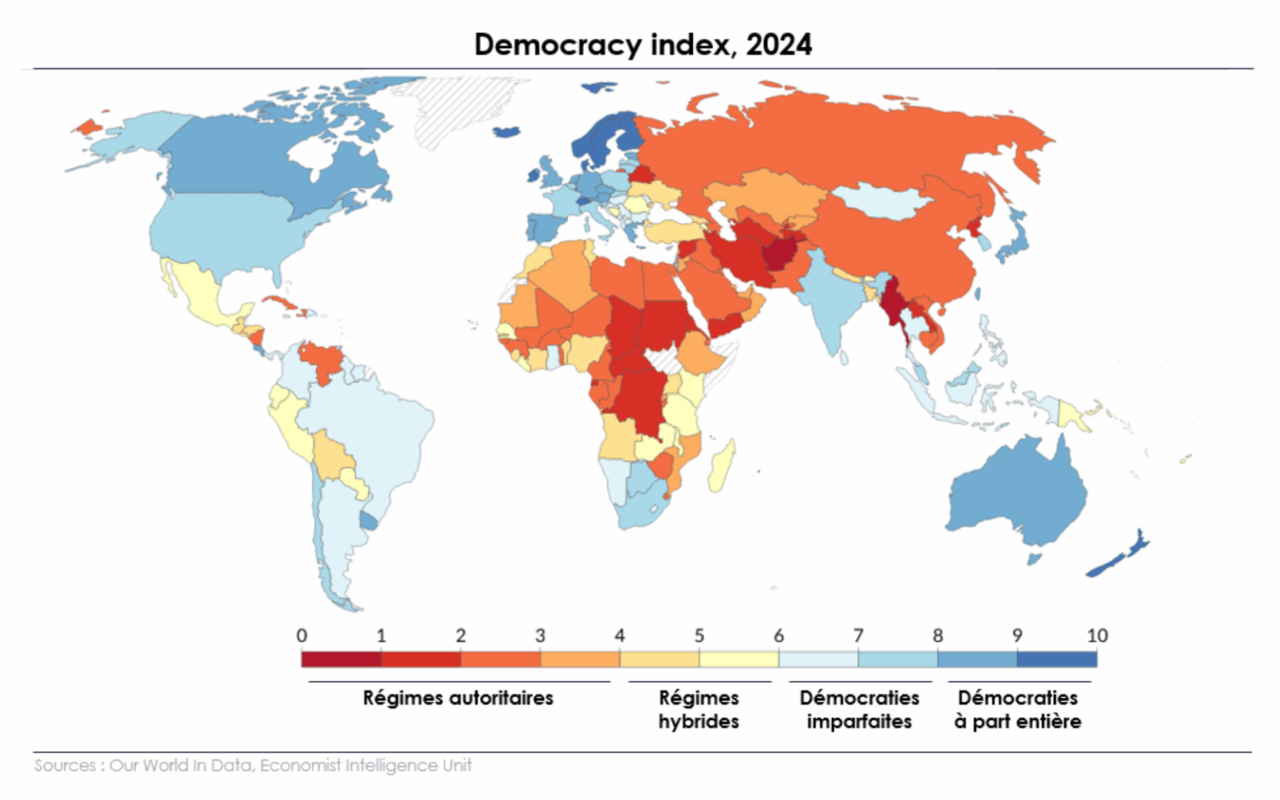
The state of a country’s democracy does not, strictly speaking, correspond to its reliability in honoring its energy supply commitments, but it does give an idea of a regime’s stability in geopolitical terms. For example, Russia’s unleashing of the war in Ukraine proved it to be an unreliable partner. In 2024, the military junta in power in Niger nationalized the subsidiary of French uranium multinational Orano.17 As a result, uranium imports from this country have ceased altogether. Since Trump’s re-election at the end of 2024, the USA’s score is likely to deteriorate over the next few years.
Exhibition: the weight of imports in consumption
Exposure is assessed by the weight of net imports (imports – exports) in energy consumption. This weight is then distributed among all suppliers. For example, net oil imports account for 95% of European consumption. Since the United States accounts for 15% of these imports, Europe’s exposure to the American giant is therefore 14% (15%*95%) of its oil consumption.
For stock energies (fossil fuels and uranium), 1 kWh of energy imported in year N is assumed to be consumed in the same year.18 As strategic stocks do not increase significantly, there is a communicating effect between incoming and outgoing flows. In addition, solar panels imported in year N are considered to have been installed in the same year, so the exposure relates solely to their production in year N.
This exercise is simplified by considering exposure to the energy mix of year N. Accounting for energy volumes associated with imports, projected over several years, would give a better picture of exposure to supply risk over this period.
Vulnerability: the consequences of a supply disruption
If all deliveries of fossil fuels, uranium or photovoltaic panels stopped overnight, what impact would this have on our energy consumption?
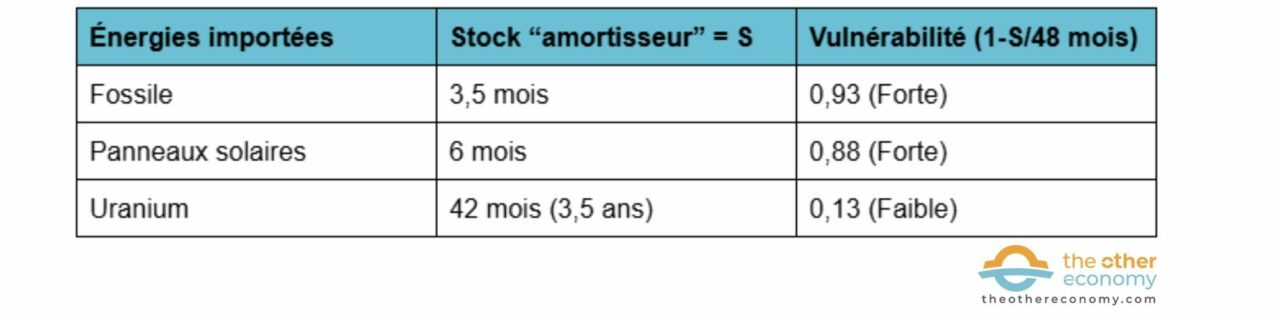
For fossil fuels, consumption can be maintained at the same level for 3-4 months, thanks in particular to strategic stocks. A few months is not much. The war in Ukraine has given us a glimpse of the consequences, affecting only Russian supplies: higher prices, factory closures, less heating for some households.
The nuclear industry’s capacity to withstand an identical shock is 12 times greater, since stocks of uranium (natural, enriched and depleted) mean that Europe can produce at the same level for around 3-4 years.
No longer being supplied with solar photovoltaic panels has a direct impact on the current year’s installations. There are stocks linked to distributors’ strategies, probably of the order of 6 months.19 to cushion the impact.
In this exercise, vulnerability is defined over a 4-year timeframe, in line with the current duration of the war in Ukraine:
The vulnerability of domestic production capacity is not assessed. There are, of course, critical imported components required for this production. For example, the permanent magnets used in the manufacture of offshore wind turbines.
One third of European energy consumption is exposed to high geopolitical risk
Combining the 3 factors above, the geopolitical risk to energy supply is more nuanced than the dependency ratio alone.
Risks to Europe’s energy supply
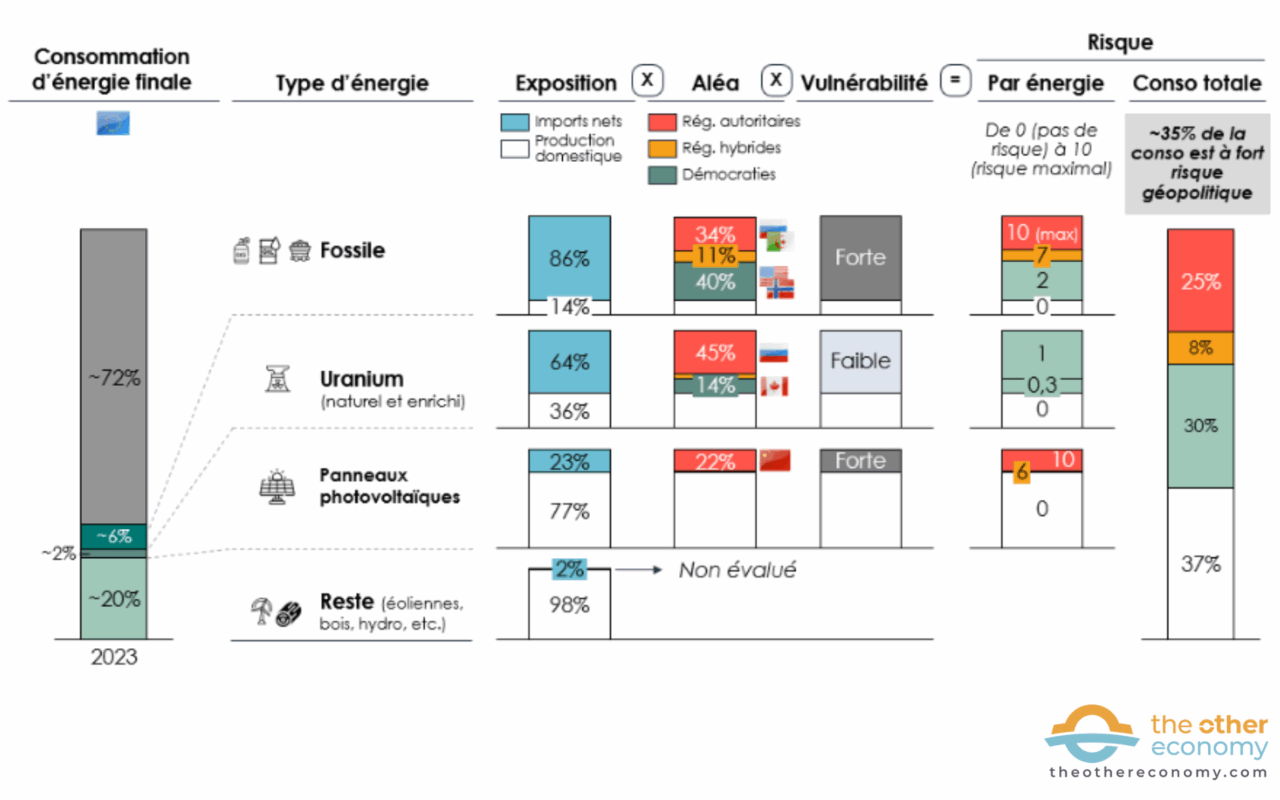
Around 35% of energy consumption is covered by risk-free domestic production. A further 30% is covered by supplies from countries with stable regimes and/or protected stocks on European territory (notably uranium) large enough to cope with geopolitical contingencies over several years. Finally, 35% of consumption is exposed to a high geopolitical risk, due to imports from authoritarian regimes and European stocks that cannot maintain current consumption levels for more than a few months.
Source: Eurostat, Solar Power Europe, Bruegel, Word Bank, Our Wold in Data, Economist Intelligence Unit
Energy bill weighs on trade deficit
Energy dependence and geopolitical risk go hand in hand. Dependence translates into an energy bill that fluctuates according to market prices, a country’s economic development or its energy independence strategy. Geopolitical risk, on the other hand, measures the probability of the occurrence of a crisis that will exacerbate this dependence, and potentially jeopardize our sovereignty. As in the case of the outbreak of war in Ukraine in 2022, or the oil shocks of the 1970s, when energy bills skyrocketed.
Fossil fuels less “profitable” than uranium and solar power in terms of balance of trade
In 2023, the European Union imported over 350 billion euros worth of energy products. It is interesting to compare these amounts with the quantity of associated energy. 20
Cost vs. energy supplied by energy type
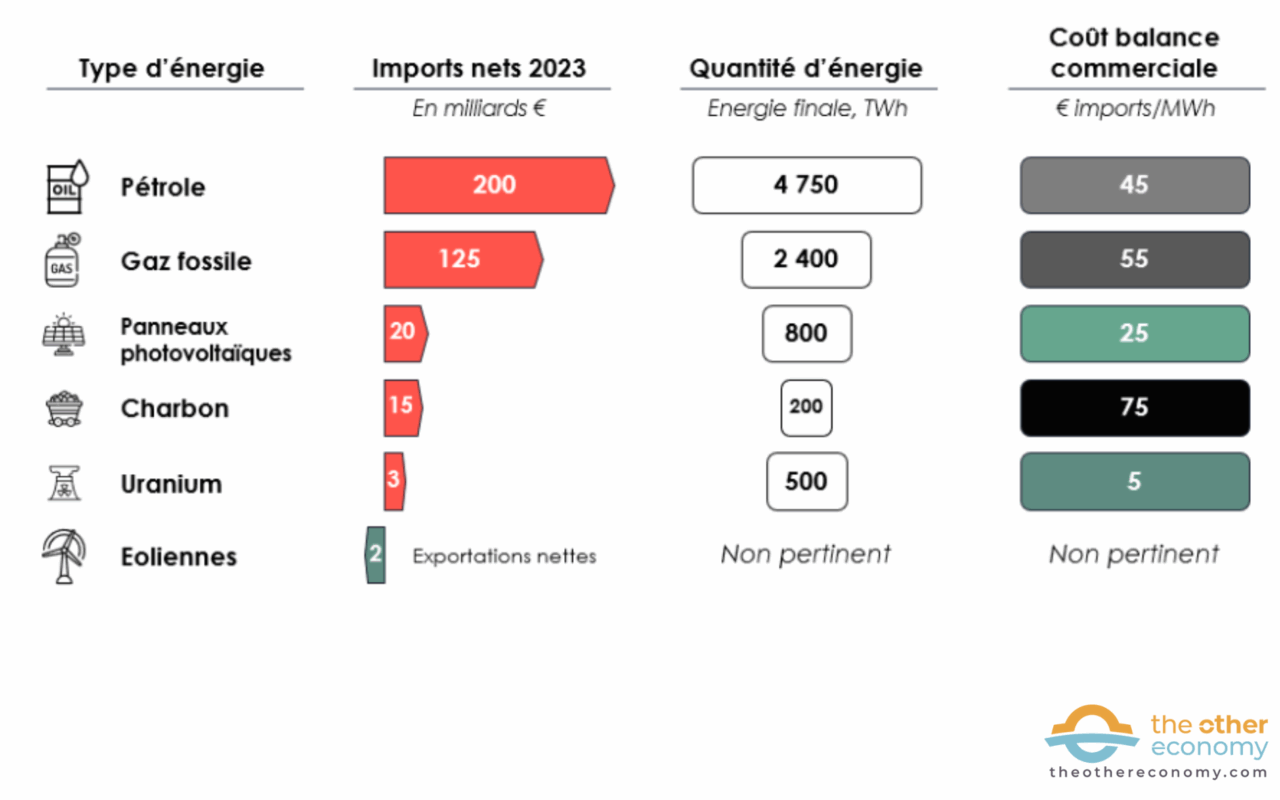
In terms of final energy consumption, coal is very costly in terms of imports per MWh supplied, as it is mainly transformed into electricity, and ⅔ of the primary energy is lost at the thermal power plant. Conversely, solar energy weighs relatively less on our trade balances than fossil fuels to supply 1 MWh of final energy consumption. Uranium is unbeatable in this respect, thanks to its very high energy density.
Source: Eurostat, Solar Power Europe, Bruegel and Wordbank
This “cost” should be treated with caution.21 This is the cost of imports alone. To this must be added local costs (e.g. construction and operation of power plants) to obtain the total cost, which has a very different classification. The concept remains interesting from a macroeconomic point of view, as local costs are also revenues: local wages feed the national economy.
Fossil fuels make a relatively small contribution to local value added: less than 50% of their total costs (national transport and distribution, boiler installation and maintenance), compared with 70% for solar panels (the panel alone represents only 30% of the total cost, the rest being mainly installation and ancillary equipment), and 90% for nuclear power (uranium represents only 10% of the total cost).
France’s energy bill weighs 4 times more than the budget of the Ministry of Ecological Transition
Since 2005, France’s energy bill has averaged 60 billion euros a year. This is the “cost” of our dependence. During the energy crisis triggered by the outbreak of war in Ukraine in 2022, the bill soared to over 120 billion euros, more than double the previous year’s figure. This is the additional “cost” of our exposure to geopolitical risk. We have to go back to the oil shocks of 1973 and 1979 to observe comparable situations.
Our energy bill reveals our dependence on fossil fuels and our exposure to geopolitical risks.
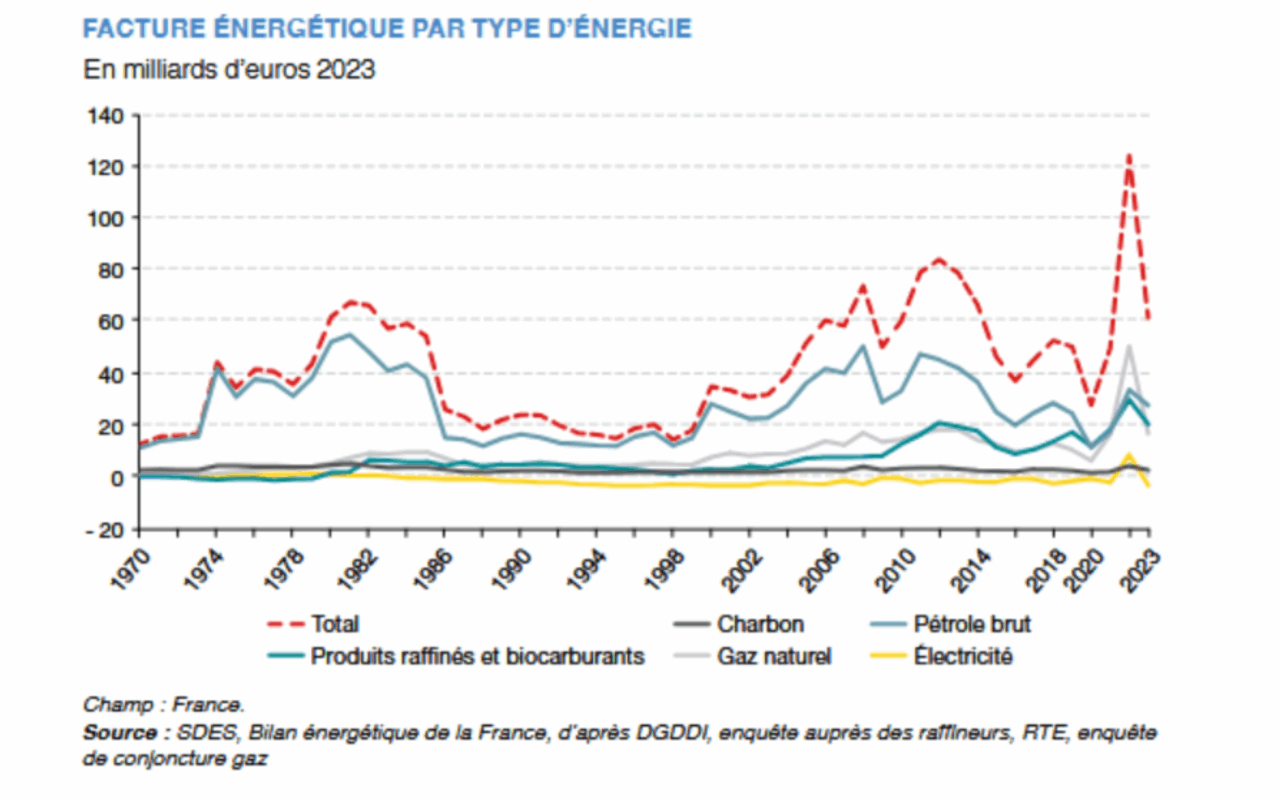
Source: Chiffres clés de l’énergie, Édition 2024, Ministère de la transition écologique.
60 billion euros is :
- the combined budget of the Ministries of the Interior and Higher Education and Research;
- 4 times more than the budget of the Ministry of Ecological Transition22 the ministry that is supposed to free us from this energy bill
So much money leaving the country when it could be funding national economic resilience.
How does energy dependence impact purchasing power?
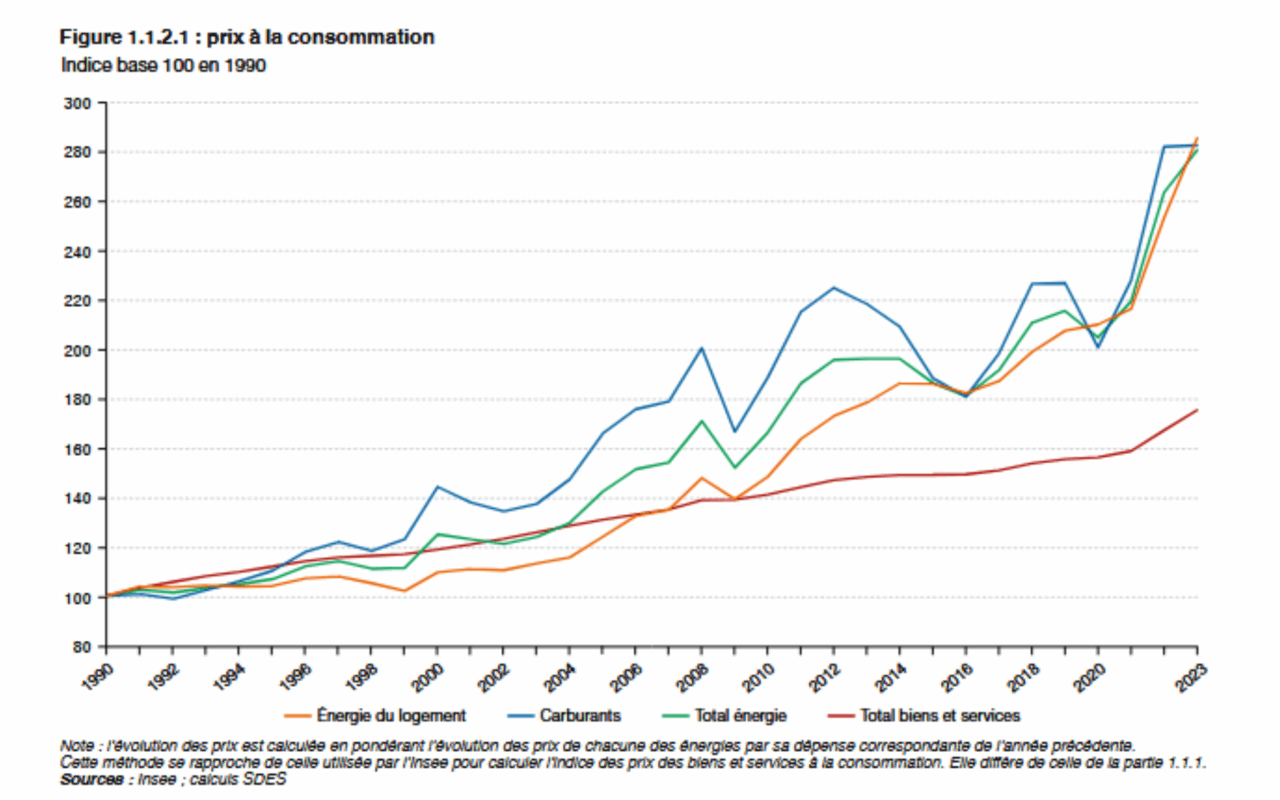
In 2023, the direct purchase of energy (fuel and accommodation) represented over €3,500 incl. tax.23 per year and per household, or almost three net monthly earnings.24 Since the early 2000s, this energy bill has been rising proportionally faster than the prices of all goods and services.
Consumer prices by use: energy weighs heavily on household bills
Source: Chiffres clés de l’énergie, Édition 2024, Ministère de la transition écologique.
This is problematic, as this energy purchase is part of constrained expenses (e.g. housing, food, transport).25 Indeed, the majority of households depend on the car to go to work, do their shopping or drop their children off at school. As housing is poorly insulated, more than two-thirds of the energy consumed at home is for heating.26 In other words, when the price of energy rises, households, if they can, have to arbitrate between compressible expenses such as leisure activities and expenses that are difficult to compress, such as less heating or less travel.
In 2018, this tension over automotive fuel prices contributed to the emergence of the Yellow Vests movement, putting millions of French people on the streets.
In 2022, at the time of the explosion in energy prices linked to the war in Ukraine, over 80% of French people wanted to reduce their energy consumption to lighten their bills, but the majority (~60%) said they were unable to do more.27
One year on, 8 out of 10 households say they have reduced their heating during the winter.28 This energy sobriety, motivated by economic reasons, is then largely undergone. 26% of households suffered from the cold at home during the winter of 2023-2024, compared with just 14% in 2020. 29
As households face rising energy bills, companies are also passing on the cost of their products and services. In 2022 and 2023, they contributed to inflation, which reached 5% to 6% in France. 30
This energy dependence not only weighs on household purchasing power, but above all it weakens the most vulnerable, who can no longer afford to heat their homes or get around.
Our dependence on fossil fuels puts us at the mercy of authoritarian regimes
Energy dependence and geopolitical risk are two sides of the same coin. Dependence on fossil fuels means dependence on authoritarian regimes: Russia, Kazakhstan, Saudi Arabia, Algeria, China and even the United States under Trump. In other words, the European Union is exposing its economy to potentially destructive geopolitical hazards that threaten its sovereignty. Reducing dependence on fossil fuels also means combating climate change.
Europe has its destiny in its own hands. The recipe is well known: consume less energy (e.g. train, bicycle, building insulation, heat pumps) and produce it at home in an environmentally virtuous way (e.g. geothermal, wind, nuclear, solar). This creates local jobs and helps stabilize or even improve purchasing power.
But gaining resilience isn’t just about energy. Strengthening our independence applies to all essential needs: food, medicine, clothing, etc.
Find out more
- Bilans et chiffres clés de l’énergie: reports by the French Ministry of Ecological Transition écologique
- Energy statistics: the energy page on the European Union’s statistics portal
- Or noir, La grande histoire du pétrole, Book by Matthieu Auzanneau, Ed. La Découverte, 2016.
- Energy transition: how many wars before we act, Alexandre Joly, Carbone 4 (01/03/2022).
- Consommer moins d’énergie : la meilleure arme pour se passer du pétrole et du gaz russe en un temps record, , Alexandre Joly, Carbone 4 (17/03/2022).
- See Shedding light on energy in Europe – 2025 edition, Eurostat interactive publication. ↩︎
- Database Eurostat International trade in goods ↩︎
- See data from the European think tank Bruegel : European natural gas imports (consulté le 6 août 2025). ↩︎
- Database Eurostat International trade in goods ↩︎
- Database Eurostat International trade in goods ↩︎
- See Olena Lapenko Ben McWilliams Roman Nitsovych Georg Zachmann, Ending European Union imports of Russian uranium, analysis published by the European think tank Bruegel, 2025. ↩︎
- For oil, 3 months (see Pénurie de carburants: que représentent les réserves stratégiques de pétrole? Eléonore Disdero, Libération (10/10/2022)); for gas, France has 130 TWh of underground natural gas storage capacity, representing just over a third of its annual gas consumption of around 350 TWh, or 4 months on average (see the Storage page in the Gas section of the Commission de Régulation de l’Énergie (CRE) website (accessed August 6, 2025)). ↩︎
- See Characteristics of the various energies in the Energy dossier on the Commissariat à l’énergie atomique (CEA) website (accessed August 6, 2025). ↩︎
- According to Orano, a nuclear multinational 90%-owned by the French state, French stocks potentially represent 10 years of national operation; see Nucléaire : un atout pour l’indépendance énergétique de la France (05/09/2023). ↩︎
- Constraints may nevertheless arise in the short term for the maintenance of certain components, and in the medium term to replace existing equipment and/or meet potential growing energy needs. ↩︎
- See Kingsmill Bond, Daan Walter, Sam Butler-Sloss, Energy Security in an Insecure World, analysis published by think tank Ember, 2025. ↩︎
- According to data from the International Energy Agency – see their Energy Statistics Data Browser for France andGermany. ↩︎
- See L’indépendance énergétique de la France grâce au nucléaire : un tour de passe statistique, Pierre Breteau, Les Décodeurs, Le Monde (21/02/2022). ↩︎
- See the article Est-on-on la voie de l’indépendance énergétique en France? on the Connaissances des énergies website (05/06/2024). Subtracting ⅔ of primary nuclear electricity from the denominator gives this order of magnitude. ↩︎
- See Shedding light on energy in Europe – 2025 edition, Eurostat interactive publication. ↩︎
- carried out each year by The Economist Group’s Analysis Division, The Economist Intelligence Unit . ↩︎
- See, for example, this article from Le Monde Niger nationalizes the subsidiary of French uranium multinational Orano, a new act marking the regime’s break with Paris (20/06/2025). ↩︎
- Since strategic stocks are not increasing significantly, the flow of goods in and out of the factory is like a communicating vessel. ↩︎
- See this article by Julien Chirol, President of BayWa r.e. Solar Systems, in PV Magazine (29/01/2024): A European stock of photovoltaic panels overestimated and ill-suited to the French market and L’Europe pourrait revenir à des niveaux de stocks solaires ” normaux ” d’ici à juin 2024, PV Magazine (24/10/2023). ↩︎
- For stock energies (nuclear and fossil), the link is direct with the volume delivered. For example, 1 liter of oil corresponds to around 10 kWh. On the other hand, how much energy should be considered for a solar panel purchased today that will produce energy for 25 years? A
discount rate of 7% is used (the standard rate used by the International Energy Agency) to take into account the uncertainty of future production flows. In other words, a solar panel that produces 1000 kWh in year 1, will produce 950 in year 2, then 903 in year 3, and so on. ↩︎ - Not all these energies are used for the same purposes. For transport, reasoning in terms of useful energy would better reflect the performance of combustion engines and electric motors, with efficiencies of around 40% and 90% respectively. As a result, the “cost” of oil would deteriorate by a factor of 2 compared with energies producing mainly electricity. ↩︎
- 15.32 billion euros in 2025. Source: Budget de l’État page , Expenditure by ministry on the budget.gouv.fr website. ↩︎
- Bilan énergétique de la France pour 2023, Ministères de l’aménagement du territoire et de la transition écologique, 2025. ↩︎
- Net monthly minimum wage for a 35-hour working week, Insee, 2025. ↩︎
- According to theIndice des dépenses contraintes published by insurance comparator Les Furets, they are around €1,100 a month. ↩︎
- Bilan énergétique de la France pour 2023, Ministères de l’aménagement du territoire et de la transition écologique, 2025. ↩︎
- Baromètre Énergie-Info 2022, Médiateur national de l’énergie. ↩︎
- Baromètre Énergie-Info 2023, Médiateur national de l’énergie. ↩︎
- Tableau de bord de la précarité énergétique, Observatoire national de la précarité énergétique, 2024. ↩︎
- See the article Inflation : une hausse des prix soudaine et durable aux causes et effets multiples, vie-publique.fr, 2023 and “Shrinkflation”, “cheapflation”, “greedflation”… On vous explique ces techniques commerciales des marques en période d’inflation, France Info (08/02/2024). ↩︎