
This text has been translated by a machine and has not been reviewed by a human yet. Apologies for any errors or approximations – do not hesitate to send us a message if you spot some!
There is scientific consensus that the current climate disruption is caused by an increase in the concentration of greenhouse gases in the atmosphere, and that this increase is man-made.
To specify, prioritize and take the necessary action, it is essential to know how to quantify our emissions. This enables us to define measurable objectives and anticipate their effects.
The aim of this factsheet is to review the various greenhouse gases, and then to understand how scientists obtain historical data on them and how emissions are measured today. This fact sheet will also provide an opportunity to detail some of the issues that carbon accounting can raise, and to analyze how it fits into a political framework that is inseparable from it.
What is a greenhouse gas?
Definition of the greenhouse effect
The greenhouse effect is a natural phenomenon whereby the earth’s heat radiation is absorbed by certain gases in the atmosphere.
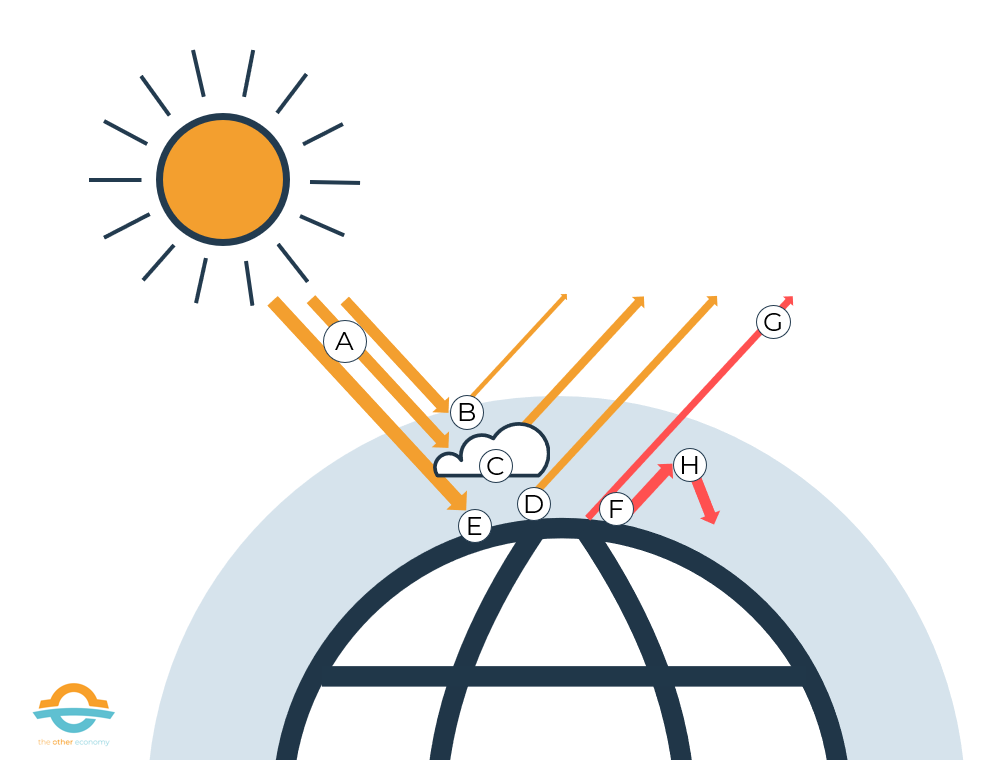
Simplified diagram of the greenhouse effect
More precisely, the sun sends us its energy in the form of luminous radiation (A). Some of it is directly reflected by the atmosphere (B), clouds (C) or bright land surfaces such as ice caps or the Sahara (D). The rest is absorbed as heat by the earth (E).
This heat is then partially re-emitted by thermal radiation (F), which is either lost to space (G) or reflected or reabsorbed by greenhouse gases (H) and thus trapped on Earth. The more these greenhouse gases are present, the less heat the Earth expels into space. Without them, the average temperature at the Earth’s surface would be not 15°C but -18°C.
What are the different greenhouse gases?
The atmosphere is made up of 77% nitrogen (N) and 21% oxygen (O2). Next comes the first GHG: water vapour (H2O), which accounts for 1%, followed by other components in very small concentrations, including the other GHGs (CO2, CH4 etc.).
There are two main ways of “measuring” greenhouse gases
- The atmospheric concentration of GHGs measures the stock of GHGs contained in the atmosphere. For carbon dioxide (CO2), the unit used is the PPM (part per million), which designates the number ofCO2 molecules per million atmospheric molecules. We have gone from 275 ppm before the industrial era to over 400 ppm today (see part 2). For methane (CH4) and nitrous oxide (N2O), the unit used is PPB (part per billion).
- GHG emissions measure the annual flow of GHGs that add to the existing stock. They are measured in metric tons ofCO2 equivalent, which enables GHGs to be compared with each other. Global GHG emissions have risen from 38 GTCO2-eq in 1990 to 59 GTCO2-eq in 2019 (see part 3).
Each GHG has a different residence time (the average time a gas molecule remains in the atmosphere) and heating capacity (the ability of a gas molecule to absorb thermal radiation from the earth and transform it into heat).
Water vapour
Water vapor (H2O) is the leading greenhouse gas in terms of atmospheric concentration. Its atmospheric concentration is only slightly modified by direct human activity, as its residence time in the atmosphere is around one week. 1.
- It is present in the atmosphere thanks to the natural cycle of water evaporation from the surface of the oceans.
- It is also emitted by man through crop irrigation, power plant cooling and aviation condensation trails.
Carbon dioxide
Carbon dioxide (CO2) is the main GHG emitted by man, and can remain in the atmosphere for thousands of years. 2.
- It is naturally emitted by the respiration of living beings, the decomposition of biological matter and fires.
- It is also emitted by man during the combustion of fossil fuels (oil, gas, coal), by chemical reactions at the base of certain industries (cement production) and by deforestation.
Methane
Methane (CH4) has 30 times the warming power ofCO2 over 100 years, but remains in the air for only a few decades, after which it decomposes intoCO2.
- It is formed naturally during the decomposition of living organisms and during the digestion of certain ruminants.
- It is also emitted by man via ruminant livestock (mainly cattle and sheep), certain agricultural crops (notably rice), waste dumps, and leaks during coal, oil and gas extraction. Furthermore, the gas extracted from the ground and used in gas-fired power plants for heating, cooking or hot water is methane. When we burn it (in our boiler, for example), it is transformed into water vapor andCO2 (and also into more toxic particles like nitrogen dioxide (NO2) when combustion is imperfect).
Nitrous oxide
Nitrous oxide (N2O) can remain in the atmosphere for a hundred years, and has a warming power 300 times greater thanCO2 over 100 years.
- It is emitted naturally by a wide variety of biological sources in soils and water (particularly microbial activity in tropical forest soils).
- Human activities exacerbate these emissions, notably through the use of nitrogen fertilizers in agriculture, wastewater treatment, fossil fuel combustion and certain chemical processes.
Halocarbons (HFCs, CFCs, etc.)
Halocarbons (HFCs, CFCs, etc.) are extremely powerful greenhouse gases. They are a family of gases obtained by replacing the hydrogen in a hydrocarbon molecule with a halogen gas (fluorine, chlorine, bromine, iodine or astatine).
- Today, they are used in certain industrial processes (manufacture of plastic foams, computer components or cell phones), as refrigerant gases for air conditioning and the cold chain (emissions from this item come mainly from leaks and landfill), or as propellants in aerosol cans. Lastly, some industrial processes can also emit halocarbons, even though this is not their purpose (e.g. aluminum production). The most powerful of these, SF6, is used in medium-voltage electrical cells.
- They don’t exist in their natural state: they were created because they are extremely stable and therefore not directly dangerous in the event of contact or inhalation. For this reason, they have replaced gases with health or safety drawbacks in various industrial applications. This stability also explains their long residence times in the atmosphere.
What is the “hole” in the ozone layer?
Ozone is both present in the upper atmosphere, where it protects us from the sun’s ultraviolet rays, and in the lower atmosphere, where it is a toxic pollutant for humans. Ozone “above” and “below” do not communicate with each other: they each have their own cycle, with specific formation and elimination mechanisms.
It’s the ozone in the upper atmosphere that we commonly call the “ozone layer”: without this gas, evolved life would probably not exist outside the oceans.
In the 1980s, it was discovered that the first halocarbons on the market, CFCs, were responsible for destroying high-altitude ozone. This destruction was particularly spectacular at springtime in the southern hemisphere: within a few weeks, almost all the stratospheric ozone above Antarctica had disappeared. This is where the term “ozone hole” comes from.
The Montreal Protocol, signed in 1987, decided to phase them out. They have been replaced by other halocarbons (HFCs or PFCs) which do not destroy ozone, but are still very powerful greenhouse gases.
Greenhouse gas emissions concern all sectors
The explanations given above on the sources of greenhouse gas emissions show that they originate from a number of chemical and physical processes, and therefore affect all sectors of the economy. This can be seen in the following image.
Worldwide direct and indirect greenhouse gas emissions by end-use sector in 2019
In 2019, anthropogenic greenhouse gas emissions totaled 59 GtCO2-eq, broken down as follows.
MISSING DATAVIZ: emissions-directes-et-indirectes-de-gaz-a-effet-de-serre-mondiales-par-secteur-final-dutilisation-en-2019Source: IPCC Sixth Assessment Report (2022) – Working Group 3 – Chapter 2 (figure 2.12).
In this graph, indirect emissions (i.e. those linked to electricity and heat production) are allocated to the final consumption sectors (e.g. buildings).
The Energy sector therefore only includes other emissions linked to energy production (e.g. fugitive emissions from fossil industries, oil refining, etc.).
LULUCF = Land Use, Land Use Change and Forestry;
Find out more
Some educational resources on the greenhouse effect and greenhouse gases
Historical greenhouse gas concentrations
Before measuring current emissions, it is worth looking at historical data, which can provide a basis for comparison. There are various methods for studying past climates: the study of stalactites, marine sediments or ice caps, each of which allows us to go back to different time scales in the past.
Ice caps cover several kilometers of land in Greenland and Antarctica. They are formed from falling snow, which does not melt (the temperature is always below 0°C) and eventually turns to ice under the weight of successive falls. The air surrounding the flakes becomes trapped in the form of tiny bubbles.
The study of these bubbles, veritable samples of the past trapped in the ice caps, makes it possible to accurately measure the GHG content of the atmosphere far back in time. There are two main reasons for this:
- Most GHGs are not chemically active: they do not transform easily when they come into contact with other elements. This is why they have not been destroyed after tens of thousands of years of residence in the ice.
- GHG concentrations are more or less the same at every point in the atmosphere. In fact, GHGs remain in the atmosphere for several decades, whereas the lower atmosphere (the troposphere) is only stirred for a few months. In less than a year, therefore, a quantity emitted anywhere is more or less homogenized over the entire planet. GHGs trapped in the air bubbles of ice caps are therefore indicators of global concentration.
To explore the climate archives that are the ice caps, scientists drill through the ice until they reach bedrock, from which they extract a column of ice (called an “ice core”). The closer you get to the bedrock, the older the ice. In 1999, for example, cores taken from the Russian Vostok station enabled scientists to go back in time to 800,000 years ago.
Changes in atmospheric GHG concentration
The results of the most recent studies can be found in the latest IPCC report, which shows just how special the recent period has been. The recent rise in atmospheric concentrations of greenhouse gases is unprecedented in the last 800,000 years.
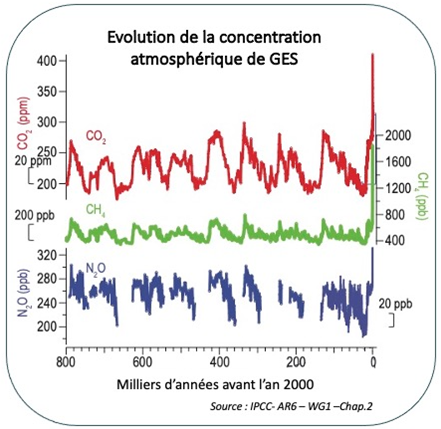
Source IPCC Sixth Assessment Report (2022) – Working Group 1 – Chapter 2
Comparing greenhouse gases
Why compare them
As we saw in Part 1, there are different types of GHGs, from different sources and with different impacts on the climate. In order to make decisions on an individual, corporate or national scale, we need to be able to compare GHGs in a common unit. In practical terms, this means being able to answer the question: “Which is worse, eating a steak or driving 10km in a car? The answer isn’t easy, and presupposes being able to say what’s worse between a molecule of CH4 emitted by French cattle and a molecule ofCO2 emitted by burning oil on a freeway.
Firstly, geographical homogeneity means that GHG emissions can be compared regardless of their place of origin. Some pollutants are very local, such as sulfur dioxide (SO2), which causes acid rain in the area where it is emitted. In this case, a particle of SO2 emitted in the middle of the Atlantic does not have the same effect as if it were emitted in Paris. Conversely, as explained in Part 2, GHGs are stirred up in the atmosphere and distributed all around the planet. It is therefore irrelevant where they are emitted:CO2 emitted in France and China can be added together.
However, not all GHGs have the same impact on the climate. Methane has a much more powerful greenhouse effect than carbon dioxide, but remains in the atmosphere for much less time.
Definitions: atmospheric residence time and warming power of greenhouse gases
Residence time is the average length of time a molecule of this gas will remain in the atmosphere.
In fact, GHGs do not remain there indefinitely, since there are physical or chemical processes that reduce the concentration of each GHG until an equilibrium is reached. For example, rain removes water vapor and returns it to the earth’s surface. Methane disappears in a chemical reaction to formCO2.CO2 can be absorbed by plant photosynthesis or dissolved in the ocean. Finally, CFCs can disappear if hit by electromagnetic radiation from the sun, which breaks the molecular bonds.
Half ofCO2 disappears in 100 years (and the other half can remain for several thousand years), methane in an average of 12 years, N2Oin 121 years and halocarbons in several thousand years. The longer a gas remains in the atmosphere, the more problematic it is, since it causes a greenhouse effect over a longer period.
The second parameter that characterizes a GHG is its power.
Not all GHGs capture the same share of the earth’s infrared rays, and therefore not all cause the same warming. It’s a kind of “instantaneous power” that doesn’t depend on its residence time. The more warming a gas is, the more one molecule of that gas at a given instant will cause the atmosphere to warm.
Understanding what a “tonne of CO2 equivalent” represents
Calculating the Global Warming Potential (GWP)
GWP is a measure of a GHG’s warming power over time. It takes into account both the instantaneous power of a GHG and its residence time.
Specifically, the GWP of a gas is equal to the warming power of one kilogram of that gas over a certain period, divided by the warming power of one kilogram ofCO2 over the same period.
By definition, the GWP of CO2 is equal to 1, and that of the other gases therefore depends on the duration chosen in the definition of the GWP. In concrete terms, the GWP of a gas over 100 years says “how many times more” a mass of this gas will warm the atmosphere than the same mass of CO2 over 100 years.
For example, methane is 82 times more warming than CO2 over 20 years, but only 10 times more warming over 500 years. From this point of view, the shorter the GWP horizon, the more serious methane emissions are compared withCO2 emissions. This is reflected, for example, in the priority given to reducing methane emissions from cattle herds over decarbonizing road transport. The choice of this timeframe is therefore a political one, as it establishes a de facto hierarchy between the various greenhouse gases, as well as placing a value on the well-being of future generations. Indeed, the shorter the time horizon, the less account is taken of the global warming that will take place in the future.
GWP of the main greenhouse gases at 20, 100 and 500 years
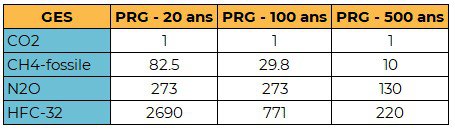
Source Source – IPCC Sixth Assessment Report – Working Group 1 – (Chapter 7 – Table 7.15)
The 100-year GWP is used to define the tonne of CO2 equivalent.
In the last major international climate agreement, the Paris Agreement adopted at the end of COP 21 in 2015, it was the 100-year GWP that was retained for defining and monitoring GHG emission reduction targets, arguing that this duration corresponded to a balance between the short and long term.
The 100-year GWP is used to define the tonne of CO2 equivalent (tCO2-eq). The tonne of CO2 equivalent is defined for a gas (CO2, CH4, N2O etc.) as the mass of CO2 that would have to be emitted to obtain the same global warming in 100 years as with one tonne of this gas. In practice, we simply multiply the mass of the gas emitted by the value of its GWP at 100 years.
For example, to obtain the 100-year warming of one tonne of CH4, we would have to emit 29.8 tonnes of CO2. So, 1 CH4= 29.8 tCO2-eq. Similarly, 1 tonne of N2O = 273 tCO2-eq.
Another unit is sometimes used: the tonne of carbon equivalent. Knowing that 1 tonne of CO2 contains 0.2727 t of carbon atoms alone, the tonne of carbon equivalent is calculated using the correspondence: 1 tCO2-eq = 0.2727 tC-eq. The difference between CO2 equivalent and carbon equivalent is simply a multiplication factor.
Global anthropogenic greenhouse gas emissions between 1990 and 2019
Once emissions have been converted into tonnes of CO2 equivalent, they can be added up and compared. The following graph shows the breakdown of global anthropogenic GHG emissions by type of gas since 1990. It can be seen that the main GHG is carbon dioxide (both fossil and from deforestation), followed by methane and nitrous oxide.
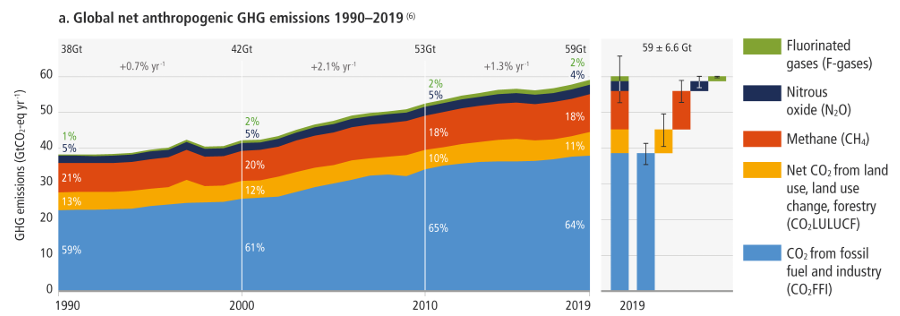
Source Source: IPCC Sixth Assessment Report (2022) – Working Group 3 – Summary for decision-makers.
Measuring emissions at different scales: from global to local
Emissions on a national scale
The international legal reporting framework focuses on emissions emitted from a given territory.
The signatory countries of the United Nations Framework Convention on Climate Change (UNFCCC), adopted at the Rio Earth Summit in 1992, agreed in the Kyoto Protocol of 1997 to oblige all so-called Annex 1 countries to reduce their emissions of greenhouse gases. 3 to produce an annual inventory of their GHG emissions, applying the methodological principles defined by the Intergovernmental Panel on Climate Change (IPCC).
We therefore have emission levels by country since the 1990s. These inventories only cover territorial emissions, i.e. those occurring within national borders.
Worldwide greenhouse gas emissions by region
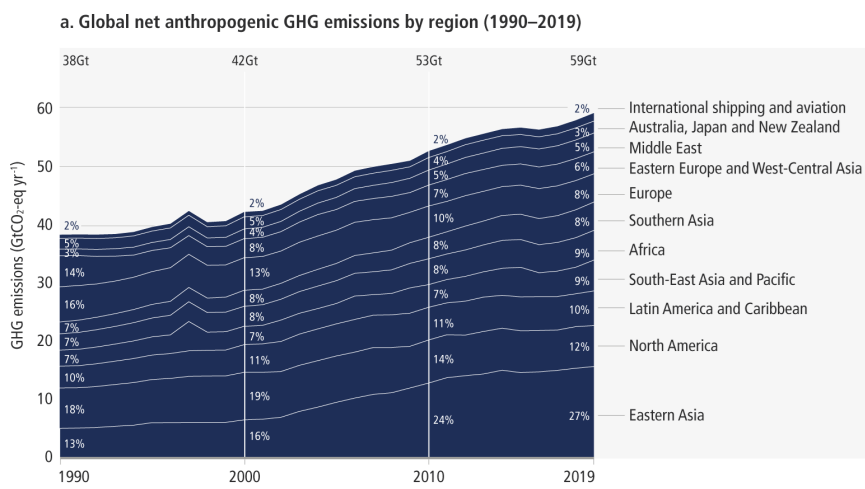
Source IPCC Sixth Assessment Report (2022) – Working Group 3 – Summary for decision-makers (p12).
The carbon footprint measures emissions linked to consumption.
The carbon footprint measures the total GHG emissions induced by the consumption of a good or service. It can therefore be used to quantify the carbon dependency of an entity (a country, a community, a company, a consumer). A country’s carbon footprint differs from its emissions inventory in that it takes into account emissions that have taken place elsewhere in order to produce the goods that will be consumed in that country. It measures domestic emissions, those induced by imports, and also subtracts the GHGs emitted for a product that is ultimately exported.
Comparison of carbon footprint and territorial emissions in France in 2018
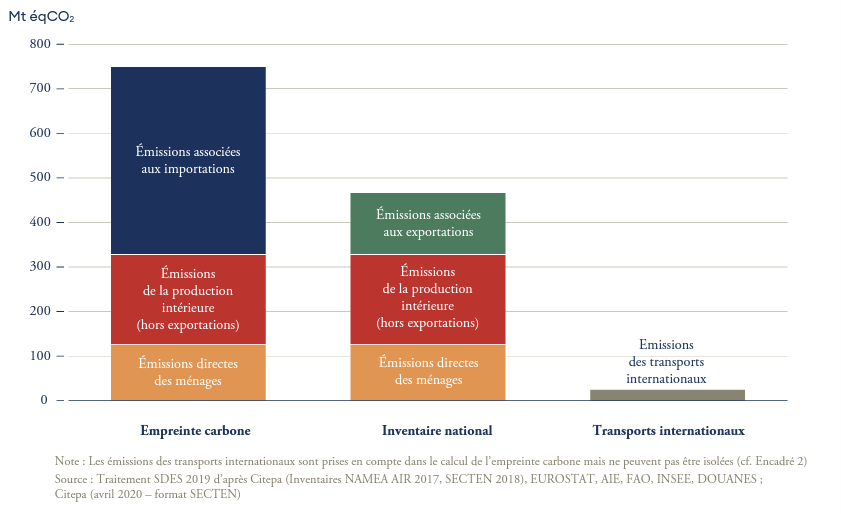
Source Maitriser l’empreinte carbone de la France (Figure 3), Rapport du Haut Conseil pour le Climat (2020)
Find out more
For an exhaustive list of available GHG databases, see our resources section.
Emissions inventories
- GHG emissions inventory for Annex 1 countries
- Inventories from other countries (much less detailed)
- French inventories on the CITEPA website
Data visualization
Emissions from businesses and local authorities: the carbon footprint
What is a carbon footprint?
A carbon footprint is a quantified inventory of the GHGs emitted over the course of a year by a given entity (company, local authority, etc.). The carbon footprint methodology was developed by Jean-Marc Jancovici in 2004 and distributed by Ademe, before being taken over in 2011 by the Association Bilan Carbone. It is a diagnostic tool for measuring a company’s or local authority’s dependence on fossil fuels and, more generally, on the GHG emissions it generates.
The GHGs taken into account are carbon dioxide, methane, nitrous oxide and halocarbons (HFCs, PFCs, SF6). Water vapor is not taken into account, as the residence time of anH2Omolecule in the atmosphere is only a few days.
Emissions can be of two types:
- Direct, if carried out by the entity on the sites it occupies
- Indirect, if they have been carried out by other entities, to meet a need of the entity concerned (suppliers, employee travel) or if they have been made possible by it (energy consumption of products sold, etc.).
We distinguish three emission scopes, from the most direct to the most indirect:
- Scope 1: emissions produced by the company’s equipment directly on site (e.g. cement production, which chemically emitsCO2 ).
- Scope 2: emissions generated off-site but induced by the production of energy that will be consumed on site (notablyCO2 emissions from the production of electricity by thermal power plants but consumed on site).
- Scope 3: all other indirect emissions linked to upstream activities (purchase of materials and equipment, etc.), and downstream activities (use of products sold, recycling and end-of-life of products, etc.).
How to carry out a carbon footprint?
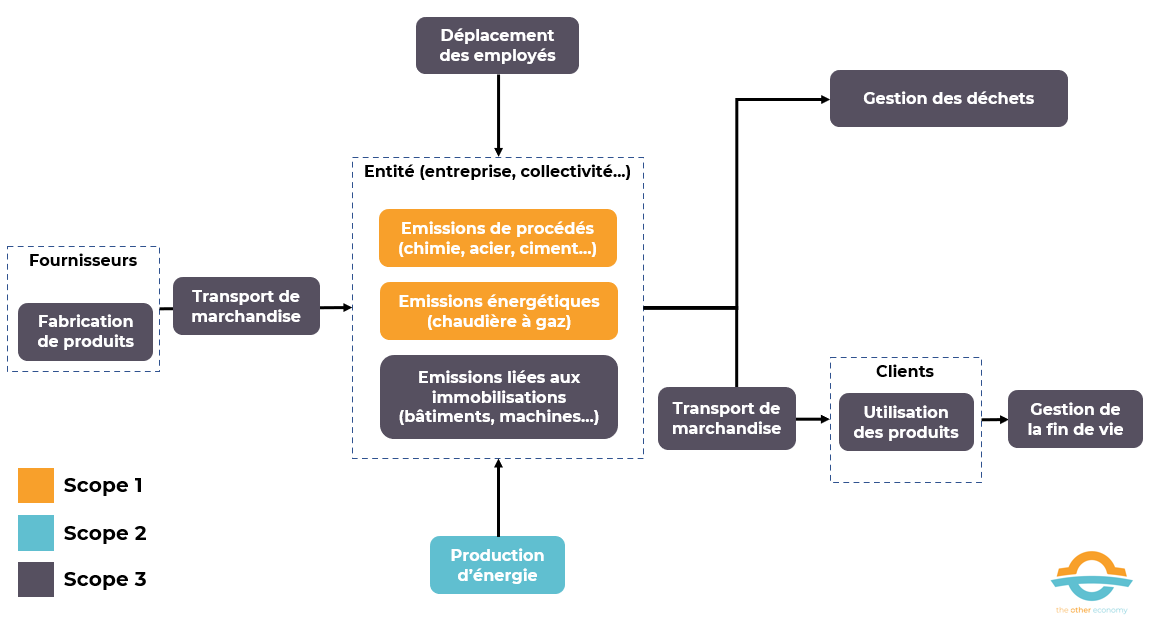
The most common methodology involves defining a scope of analysis, identifying GHG-emitting activities (heating, electricity, purchases of materials, transport, etc.), determining the quantity consumed by each “activity” and multiplying this quantity by the associated emission factor, which is provided by Ademe. 4.
For example, Ademe provides the emission factor for one kWh of electricity consumed in France in 2021, so multiply this quantity by the total kWh consumed by the company. The image above identifies a number of typical emissions-generating activities for a company.
Current status of obligations to publish carbon footprints (and similar methods)
France is not the first country to require companies to publish their greenhouse gas emissions. It is, however, the country that has gone furthest in this respect, since regulations now require the largest companies to disclose scope 3 emissions (see box).
This obligation, which has been gradually introduced into law since the early 2000s 5is not, however, a guarantee of effective reporting. By 2021, only 35% of structures required to produce a greenhouse gas emissions report had done so (43% if only companies are counted). 6
The Citizens’ Climate Convention (CCC) has examined the issue and proposed a number of measures, including replacing the €10,000 fine with a more binding fine based on sales.
Regulatory requirements in France
In France, every 3 or 4 years (depending on the type of player), companies with more than 500 employees and public administrations of a certain size must draw up a greenhouse gas emissions balance sheet (BEGES), along with an action plan to reduce them. These so-called “regulatory” assessments must be carried out according to a formalized methodology that includes Scopes 1 and 2. Since 2022, significant indirect emissions (covering a large part of scope 3) must also be published. 7.
Reports and action plans are published on a dedicated website. Failure to publish the report carries a €10,000 fine (€20,000 maximum in the event of a repeat offence).
It should be noted that the largest companies (threshold specified here) must also publish an annual extra-financial performance declaration (DPEF) alongside their management report, including “the significant greenhouse gas emissions generated by the company’s activity, in particular through the use of the goods and services it produces”.
Source Consult the regulatory texts: Article L. 229-25 of the French Environment Code sets out the general framework for BEGES, and article R229-47 specifies their scope (the scopes). Article L225-102-1 of the French Commercial Code introduces the obligation to publish extra-financial performance declarations for the largest companies (the thresholds are specified in Article R225-104 and also concern the obligation to disclose scope 3 in BEGESs) andArticle R225-105 specifies the information to be disclosed.
At European level, the requirement for extra-financial reporting is included in Directive 2013/34/EU on the annual financial statements, consolidated financial statements and related reports of certain types of companies.
* Introduced in 2014 (by Directive 2014/95 known as the Non-Financial Reporting Directive – “NFRD”), this obligation is however rather unspecific and only concerns the largest companies, which must include ” in the management report a non-financial statement including information, to the extent necessary for an understanding of the development of the business, performance, situation of the company and the impact of its activity, relating at least to environmental issues, social and personnel issues, respect for human rights and anti-corruption “. Guidelines to help companies disclose non-financial information were published in 2019. They are more precise (notably on GHG emissions reporting) but are only indicative, not binding.
*Adopted in January 2023, Directive 2022/2064 on the publication of sustainability information by companies (known as the Corporate Sustainability Reporting Directive “CSRD”) has introduced major changes concerning extra-financial reporting.
- the scope of application has been broadened: all listed companies (including SMEs), as well as unlisted companies above two of the following three thresholds (250 employees; €40m net sales and €20m balance sheet total) are now concerned;
- Sustainability reporting will be published in a dedicated section of the management report (previously it was possible to produce a specific report);
- reporting standardization is reinforced: EFRAG (the European Financial Reporting Advisory Group) has been commissioned by the Commission to create harmonized European sustainability reporting standards (known as “ESRS” European Sustainability Reporting Standards), comprising standards applicable to all companies (adoption scheduled for June 2023), sector-specific standards and standards specific to SMEs (June 2024);
- verification of information by a statutory auditor or an independent third-party body (at the choice of the States) is made compulsory.
In November 2022, EFRAG published a draft of 12 standards applicable to all companies affected by the directive (the final version is due to be adopted by the Commission in June 2023). GHG emissions reporting (ESRS E1 standard) covers scopes 1, 2 and 3.
The CSRD directive will be phased in from January 1, 2024. In 2025, only the largest companies (>500 employees, >40M€ sales and/or >20M€ balance sheet total) will be required to produce extra-financial reports in accordance with the new standards (for the 2024 financial year). The obligation will then gradually be extended to other companies.
Find out more
- The Directive on financial and non-financial reporting by European companies (Directive 2013/34/EU – consolidated version).
- Directive 2014/95 (known as the Non-Financial Reporting Directive – NFRD), which introduced mandatory extra-financial reporting in 2014.
- Directive 2022/2064 (the Corporate Sustainability Reporting Directive, or CSRD), which expands the scope of companies covered and standardizes reporting.
- A very clear explanation of the new features introduced by the CSRD directive can be found on the Autorité des Marchés Financiers website.
- The draft of 12 standards applicable to all companies published by EFRAG.
At the international level, the report of the Task Force on Climate-related Financial Disclosures (TCFD), published in 2017, established a framework for corporate climate reporting shared at the global level. This initiative followed the highlighting of systemic financial risks linked to global warming (which we present in the module on finance). The aim is to enable investors to better assess the climate risks borne by the companies in which they invest. While this is an interesting approach, particularly as it gives a much more strategic dimension to climate reporting, it remains voluntary.
Last but not least, some private-sector players are also demanding reporting on corporate greenhouse gas emissions. This is the case, for example, with the Carbon Disclosure Project (which collects data for sale to investors) and a number of so-called “responsible” funds.
Scope 3 in the carbon balance sheet
Scope 3, which includes indirect emissions, is often overlooked by companies, who argue that it poses the problem of double counting (for example, emissions linked to car use are included in scope 3 by automotive companies and by oil companies).
In practice, scope 3 often accounts for the bulk of a business activity’sCO2-eq emissions.
Illustrative examples of the breakdown of GHG emissions between scopes for various branches of the French economy
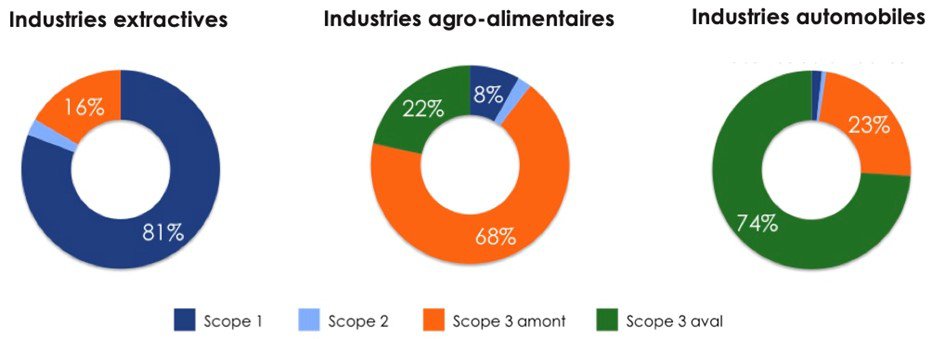
Source Carbone 4
The aim of the carbon footprint is to measure dependence on GHG emissions, so emissions must be taken into account throughout the chain. The carbon footprint partly answers the question: how sustainable can the business be if GHG emissions were banned? What’s more, if a company were to buy one of its suppliers, its carbon footprint would not change, since the activity remains fundamentally the same and still emits the same amount of GHGs. However, if scope 3 is omitted, the company’s balance sheet changes significantly.
In addition, including scope 3 creates incentives for companies and their suppliers to offer products and services that are as carbon-free as possible.
Finally, double counting is not a problem in itself. It only poses a concern if we are trying to add up carbon balances, as we do, for example, to determine the carbon balance of a securities portfolio or an economic sector. Methods have been developed to cancel out any double counting in such cases.
Find out more
Assessing individual emissions
It is possible to measure the average emissions of a country’s inhabitants. This gives an initial idea of the weight of demographics and lifestyle on a country’s emissions.
The following table, for example, compares emissions per capita on the different continents, using three types of perimeter: territorial GHG emissions per capita, territorialCO2 emissions per capita (“production-based CO””2“” emissions”) and carbon footprint per capita (“consumption-based CO”“2“” emissions”).
Regional carbon emission indicators by production and consumption
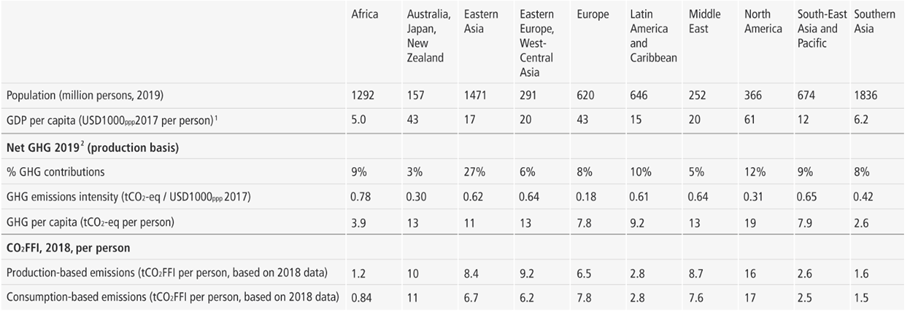
Source IPCC Sixth Assessment Report – Working Group 3 – Summary for decision-makers (figure 2)
The comparison between territorial emissions and the carbon footprint is also instructive. For example, according to the Haut Conseil pour le Climat’s carbon footprint report, French territorial emissions in 2018 were around 5t per inhabitant per year, whereas the carbon footprint is 10t per inhabitant per year, i.e. twice as much. This is due to the fact that a large proportion of the products consumed in France are produced abroad.
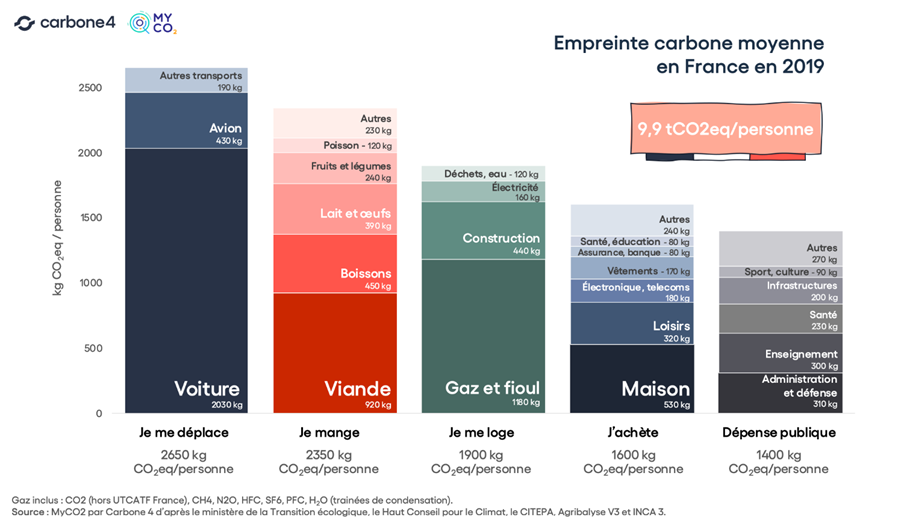
An individual can also calculate their own carbon footprint, i.e. all the emissions they are responsible for through their consumption. This footprint measures all theCO2 released into the atmosphere to enable us to live, travel, feed and entertain ourselves. It depends in part on the energy system of the country in which we live, but above all on our consumption patterns. There are a number of calculators available to give you an accurate picture of your individual carbon footprint, and to help you understand the impact of your various activities.
In 2019, the average carbon footprint of a French person can be broken down into 5 main factors
– 2.7 tonnes of travel, mainly by car and plane.
– Food, with 2.4 tonnes, mainly due to meat consumption.
– Housing, at 1.9 tonnes, for example via gas and oil heating.
– Consumption, at 1.6 tonnes, due to our purchases and leisure activities.
– Public administration, at 1.4 tonnes, which provides a public service (education, health, defense, etc.).
Find out more
Additional resources on carbon footprint
- Interactive lectures to understand the orders of magnitude of carbon by calculating your personal carbon footprint
- Calculate your carbon footprint and other Ademe tools (impact, transport, what to do with waste, how to lose a ton, etc.).
- Socialter magazine takes a look at individual and collective sobriety measures to reduce our carbon footprint.
How do you allocate greenhouse gas emissions?
As we have seen from the various examples, accounting for emissions means attributing them. But emissions present a problematic duality. On the one hand, there is a physical reality: emissions, theCO2 molecule that appears after a chemical reaction in a given place at a given time. On the other, there’s the social reality we read about every day: countries, companies and individuals. Linking the two requires an attribution convention. But there are many possibilities, so a choice has to be made. This choice is eminently political, as the responsibility for reducing emissions lies primarily with the person who bears the allocation.
Let’s take the example of a coal-fired power plant that generates electricity using the heat generated by burning coal. TheCO2 emitted can be attributed to :
- To the government that authorized the plant’s construction
- To the company operating the plant
- Individuals holding the company’s capital
- To the consumer of the electricity produced
- To the company or country that mined and sold the coal
- All these players at once
If we attribute emissions to the companies (public or private) that extracted and sold this coal (or fossil fuels in general), we can come up with statements like “90 companies responsible for 63% of cumulative emissions since 1751“. This can be problematic if we consider that oil companies are not the only ones responsible for emissions linked to the combustion of the oil they sell.
In a study published in 2022, Greenpeace chose to attribute corporate emissions to their shareholders, enabling them to assert that “63 French billionaires emit as much GHG as half the French population“. This view makes the financial assets of individuals responsible for the emissions of the entities in which they are involved.
The carbon footprint attributes emissions to consumers, not producers. This implies that it is the consumer who is responsible, and therefore has the power to act. Politically, it justifies all measures requiring companies to inform their customers (labels, etc.).
On a less political level: a cow emits a large amount of methane gas during digestion. If it produces milk all its life and then meat when slaughtered, how much of the CH4 should be given to the milk and how much to the meat? Should this be done in proportion to the mass of each product (in which case the final weight of the meat will be crushed by all the milk produced)? Or in proportion to the price? It’s hard to give an “obvious” answer.
All these examples show the importance of the way in which emissions are attributed to different actors or products. A slight difference in rules has significant consequences for carbon accounting, and therefore for the political actions linked to it. This attribution is inseparable from a vision of responsibility and fundamentally moral issues.
That said, there’s no reason why aCO2 molecule can’t be attributed to several players. Multiplying carbon emission allocations also multiplies decarbonization levers. As an individual, it’s in my interest to act as a consumer, as a citizen through my political commitment and my choice in the polling booth, as an employee when I choose the company I work for and the shares I hold within it, and as a saver through the choice of financial products in which I invest my money.
- Human activities, however, indirectly modify theH2Ocontent of the atmosphere. Indeed, climate disruption leads to a rise in atmospheric temperature, resulting in greater evaporation of water, and therefore a rise in the concentration of water vapour, which reinforces the greenhouse effect. This is what we call a positive feedback, i.e. a consequence of a cause that accentuates the primary cause. ↩︎
- TheCO2 content of the atmosphere is governed by the carbon cycle, i.e. the slow passage of carbon from one compartment of our planet (atmosphere, lithosphere, biomass, hydrosphere) to another.CO2 is therefore only eliminated from the atmosphere because it is absorbed by other compartments (the ocean and biomass in particular: these are referred to as “carbon sinks”). These exchanges, relatively balanced in nature, have been disrupted by human emissions. ↩︎
- Parties (i.e. signatory countries) to the UNFCCC are divided into 4 groups: Annex 1 (developed countries, including the EU), Annex 2 (Annex 1 countries that are also OECD members), non-Annex 1 (developing countries) and least-developed countries. ↩︎
- Other databases exist, such as Ecoinvent, and specific calculations can be made if required (average emission factor in existing databases, to be replaced by a more precise emission factor). ↩︎
- These include the New Economic Regulations Act of 2001 (art. 116), which introduced for the first time an environmental reporting obligation for large companies, the National Commitment to the Environment Act (known as the Grenelle 2 Act) of 2010 (art. 75), and the Energy Transition for Green Growth Act of 2015 (art. 173). ↩︎
- Evaluation 2021 de la Réglementation des Bilans d’Emissions de Gaz à Effet de Serre, Ademe (2022) ↩︎
- except for unlisted companies with net sales or total assets of less than 100 million euros, and listed companies with net sales of less than 40 million euros or total assets of less than 20 million euros. ↩︎