
This text has been translated by a machine and has not been reviewed by a human yet. Apologies for any errors or approximations – do not hesitate to send us a message if you spot some!
The links between GDP and energy are strong, as spectacularly demonstrated by the oil shocks of the 1970s and the energy crisis that began in late 2021. For an engineer, this link is obvious: no economic production without energy. But an economist is likely to have a different answer… As we shall see, some economists have estimated, for example, that a complete embargo on Russian gas would only have a 0.5% impact on German GDP, which is far from the reality.
The neoclassical analytical framework now most widely used by economists has paid very little attention to the role of energy in economic production. If energy is considered secondary by a whole section of the profession, it’s not least because of a relatively simple mathematical theorem which concludes, in essence, that what doesn’t cost much isn’t important. This is the cost-share theorem, which links the contribution of energy to GDP to the share the energy sector represents in production expenditure. With the energy sector accounting for between 5% and 10% of total wealth produced, economists have concluded that energy is not essential to economic production.
Empirical analysis has amply demonstrated that this result is false, and concludes that energy consumption is essential for GDP. As the cost-share theorem is purely mathematical, the error can only come from its assumptions. We will explain why these assumptions do not correspond to reality. For example, there is every reason to believe that GDP growth is not possible at this stage without additional energy consumption. But this observation, based on historical data, is linked to the current economic organization and our conventions (notably concerning GDP itself), which nothing prevents us from transforming so that our way of life is much less “energy-intensive”.
Energy seems essential to keep our production system running.
Our production system is energy-intensive
Energy is a physical quantity that can be used to measure “change” in a system: heating it, moving it, deforming it and so on. It’s energy that sets things in motion, and so keeps carmakers, travel agencies, service stations and the SNCF going. Energy is what heats homes, offices and factories. It also enables gas to change state, liquefying it to run refrigerators or transport gas in supertankers. Energy also makes it possible to initiate chemical reactions, needed for example in steel mills or in the production of essential molecules such as nitrogen, ammonia, oxygen or hydrogen. It can also be used to rearrange molecular bonds (to deform materials), to move a body in a gravitational field (to lift an elevator) or in an electromagnetic field (to drive an electric motor), or even to generate light (to light a bulb).
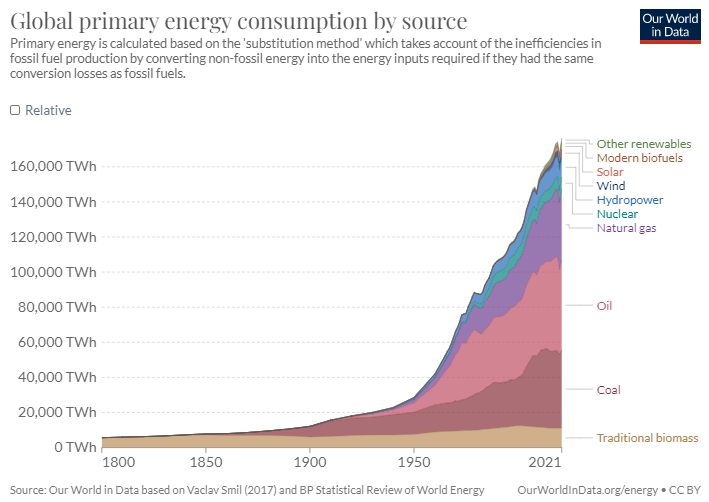
From this point of view, since the thermo-industrial revolution, the productive system has essentially become a set of machines that transform raw materials into consumer goods and services, at the cost of energy consumption, while producing waste (liquid, solid or gaseous…). Of course, human labor remains indispensable, but it has to be said that, without machines, we’d be reduced to “pre-industrial” activities (manual agriculture aided by animals, handicrafts and trade in hand-made goods). Producing today means using energy. This entanglement explains why we have never produced so many goods of all kinds and, at the same time, consumed so much coal, oil and gas. 1 .
Machines not only replace human effort, they multiply it by 200 on a global scale, and by more than 400 for a French person in 2012. Humans are no more than pilots of machines, which also provide access to goods and services that would otherwise be unattainable: skyscraper construction, car, train and plane travel, cheap household appliances and so on.
GDP is highly correlated with our energy consumption
Going a step further, we can take a close look, year after year, at the amount of energy consumed for each level of GDP reached worldwide. The results are clear: at first glance, the relationship is almost linear. While correlation does not imply causation (GDP could be perfectly correlated with the quantity of A4 sheets produced without fundamentally relying on paper), it is a first clue that energy is probably essential.
Primary energy consumption as a function of GDP (one point represents one year)
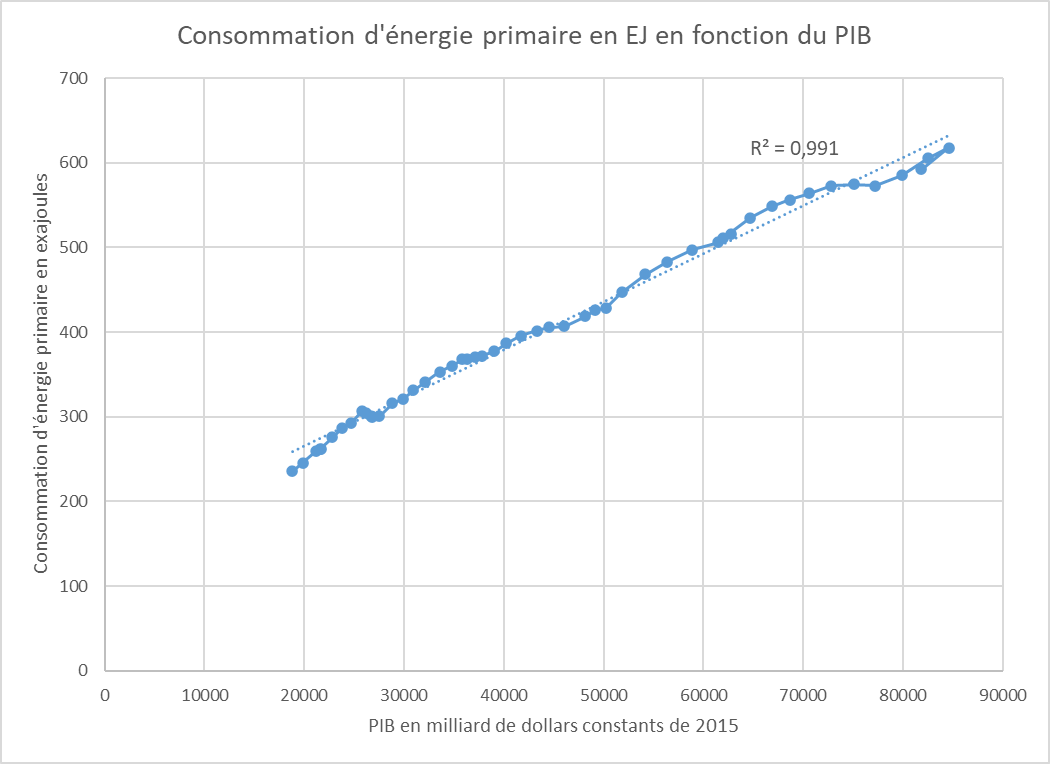
Source Based on IEA data for energy consumption and World Bank data for GDP
More precisely, as we showed in the Kaya equation fact sheet, the ratio between energy and GDP, which designates the energy intensity of GDP, has fallen slightly over the past half-century (by around 1% per year). This means that the global economy is progressively using slightly less energy per point of GDP.
This relative stability in the relationship between GDP and energy is unusual in that there is no accounting equality that would a priori bring these two quantities together. One is physical, the other monetary and partly conventional (see GDP module). This doesn’t mean that energy and GDP are inevitably equal, but it does show that energy is now an absolutely major component of our economy.
Wealth produced per unit of primary energy consumed
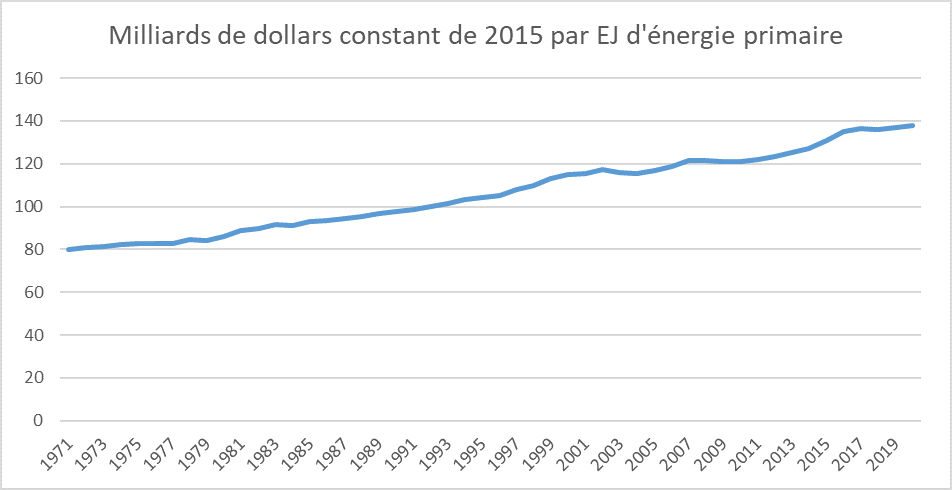
Source Based on IEA data for energy consumption and World Bank data for GDP
Energy crises have a strong impact on GDP
Energy crises are characterized by a decrease in supply (voluntary or uncontrolled) coupled with an increase in prices, leading to an economic slowdown. These crises generally pose two types of challenge, both of which adversely affect the economies concerned.
The first challenge is “conventional” (linked to our monetary and economic conventions): price increases, which can sometimes be very sharp (as in the case of gas prices for winter 2022). These price distortions disrupt the economy, bankrupting companies or forcing them to slow down considerably. They reduce household purchasing power, blur long-term visibility and considerably slow down investment. For example, the Duralex glassworks was put on standby during the energy crisis of 2022.
This first challenge can be partially cushioned by public authorities through price controls or subsidies targeted at households and businesses (see fact sheet: Does the price of energy affect consumption?).
The second is a physical challenge that’s hard to escape: there’s a shortage of energy, so production can’t match expectations. As a result, part of the physical capital (the machine park) goes unused and is brought to a standstill.
However, it is difficult to assess the impact of the recent energy crisis on GDP, since many other factors are constantly influencing economic output. We can nevertheless observe that French GDP has beenrevised downwards by 1.5% by the European Commission between spring 2021 and autumn 2022, and by 1.2% for the eurozone as a whole. Real domestic income, which measures the “purchasing power” provided by GDP, has been revised downwards by 2.7% for Germany and 3.4% for the Eurozone.
Crude oil price trend between 1861 and 2021, in current and 2021 dollars
The oil shocks of 1973 also affected the GDP of the world’s major economies. These shocks were due to a sudden change in oil supply, and therefore to a sharp rise in the price per barrel.
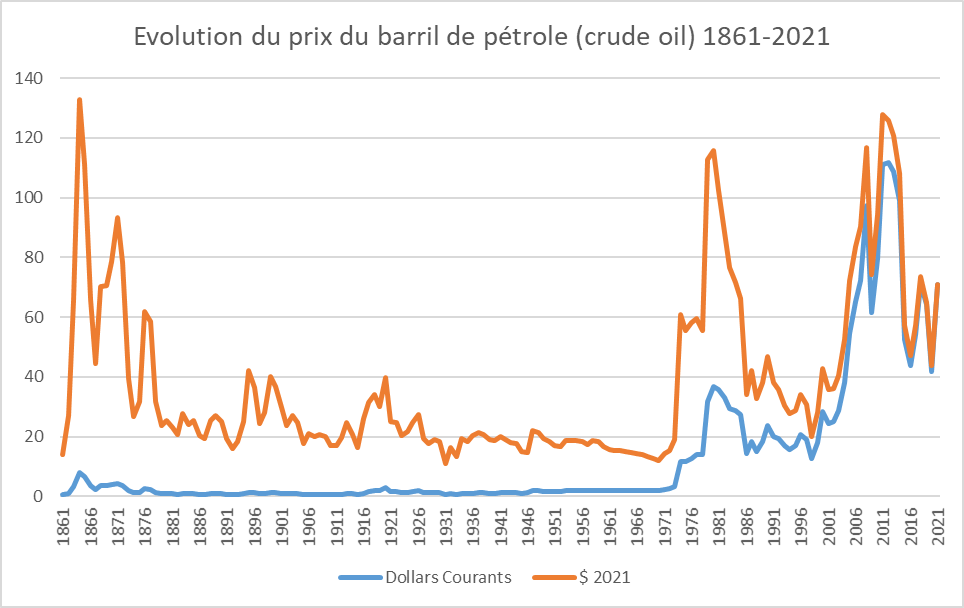
Source BP data
In 1973, per capita GDP growth was 4.5% for France, 4.2% for Germany and 4.8% for the USA. In 1975, it was -1.2%, -0.2% and -1.3% respectively. Growth resumed thereafter, but from 1979 onwards, GDP stagnated again, and even fell for several years.
GDP per capita in constant dollars at base 100 between 1960 and 2000
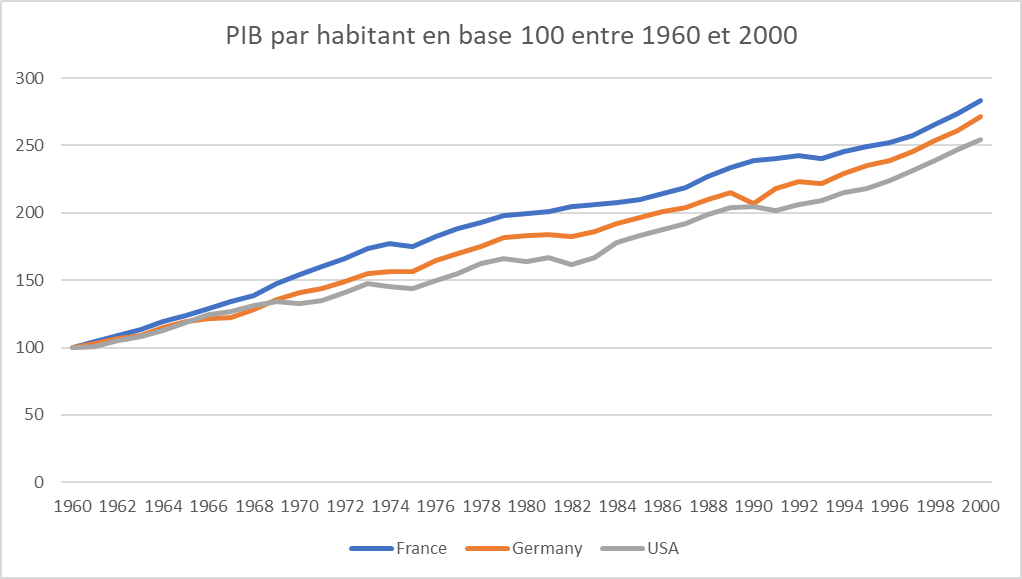
Source Author’s calculation based on data from Our World in Data
Notwithstanding the empirical consequences of energy crises, neoclassical economists do not take them into account in their calculations. We’ll see in the next section what their reasoning is based on.
According to the prevailing macroeconomic theory, GDP depends little on energy consumption.
Macroeconomic theory models GDP as a production function
In economics, a production function is a relationship between factors of production X1, X2, X3 etc. (capital, labor etc.) and the total quantity produced (noted here as Q, which designates production achieved, not production sold). To represent the economy as a whole (GDP) by such a production function is to use a mathematical model, in this case an extremely simplified one, whose consistency, relevance and empirical robustness can and should be debated. The conclusions that can be drawn from such a model can only be validated if the model is validated – we’ll see in part 4 that this is not the case. But first, let’s take a look at the reasoning behind this surprising, if dominant, thesis of a weak link between energy and GDP.
For the moment, we haven’t explained what X1, X2 etc. might be. If we are interested in the production function of a baker, we can imagine that the factors of production will then be the quantity of flour, water, yeast, working hours, electricity consumed and machines owned. For the economy as a whole, we find in the work of economists the “quantity of hours of work”, more simply called ” labor “, noted L (for “Labor”) and the “quantity of machines” called ” capital “, noted K (for “Kapital” in German). Other factors can also be added, such as patents and industrial know-how, natural resources or the amount of agricultural land, for example. To be able to measure capital via a single value, we need to be able to add steel bars to rolling mills. Similarly, to obtain a single measure of labor, we need to add the work of a secretary to that of a bus driver. The most common choice is to measure these factors of production by their monetary value (we can therefore add €1 of steel to €1 of rolling mills). Note that in this reasoning, the capital used for the production function is productive capital (machinery, infrastructure, equipment) and not financial capital (shares, loans, etc.). 2 . It’s not a loan or a share that produces directly.
Two examples of production functions
The most classic production function is the Cobb-Douglas function. This postulates that Q = a * (X1b1) * (X2b2) * … * (Xnbn). So, if only one of the factors of production is zero, then output is also zero, regardless of the value of the other factors. In this case, the factors of production are said to be “imperfectly substitutable”. A little less X1 can be offset by a little more X2, provided X1 is not zero.
We can also assume that the production function is a Leontieff function: Q = minimum (b1*X1; b2*X2; … ; bn*Xn). Here, production is equal to the minimum output of each production factor. Beyond a certain threshold, each factor becomes useless. Conversely, keeping all factors at a certain level and reducing just one will reduce total output by the same amount if the latter is a limiting factor.
There are many other possible functions, each based on hypotheses that reflect different conjectures about our economic organization. Indeed, to model economic production by means of mathematical equations is to explain how wealth is created (is it enabled by one factor rather than another? can factors be replaced or are they all necessary? etc.).
Choosing the factors that enter into the production function is not trivial. Assuming that the quantity produced is a function of labor and capital alone implies that any fixed quantity of labor and capital results in the same output. However, it’s easy to imagine that, depending on the type of economic organization, the skills deployed, the legal framework and the infrastructure available (transport, energy, telecommunications, etc.), production will be more or less important for the same quantity of labor and capital. Two car factories using the same amount of labor and capital will not necessarily produce the same quantity of cars: their working methods, culture, market access, know-how, location in a territory with or without legal institutions and functional infrastructures are all factors that strongly influence their production.
Obviously, a mathematical function cannot take into account the infinite number of factors that govern production. The aim is to select a small number of factors that account for a large proportion of what we observe. That said, the debate is far from over on the existence of a production function that would effectively account for the output of an economy as a whole. We will address this point in Part 4.
Production elasticity
One of the most widely used functions in economic literature is the Cobb-Douglas function, taking into account labor L and capital K, i.e. Q = a*(Lb)*(Kc) with a, b and c constants depending on the economy under consideration. Theproduction elasticity of each factor is directly given by their exponent (here, b and c). This can be verified mathematically by deriving the production function. As a reminder, the elasticity of a factor tells us how much output varies in percentage terms, when the quantity of that factor increases (or decreases) by 1%. 3 . For example, if c=0.3, a 1% decrease in the quantity of capital “K” will result in a 0.3% drop in total output. If b=1.8, a 1% increase in the quantity of labor “L” will result in an increase of 1.8%.
The cost share theorem can be used to estimate the parameters of this production function
While economists don’t claim to know the exact formula of the production function, most of them do claim to know its fundamental characteristics. To do this, they use an important theorem of the neoclassical analytical framework: the cost-share theorem.
The reasoning is as follows: if the production function exists, the “factors of production” that have enabled production to exist must be remunerated. This remuneration, which comes from the income generated by the sale of production, is distributed among the “contributors” of the factors of production, and, to put it quickly, we call the remuneration of the factors of production what these contributors receive in return for their contributions. In this model, there are no companies, no other institutions, and no taxation. As mentioned above, this is an extremely simplified model of economic reality, which is infinitely more complex.
We can therefore imagine that if one factor is paid more than the others, it’s probably because this factor is an important contributor to production. Conversely, if a factor is cheap, it may be that it doesn’t contribute that much. The cost-share theorem formalizes this intuition and can be demonstrated by a variety of reasonings, all based on strong assumptions.
More formally, according to this theorem, the share of the cost (and therefore the remuneration) of one factor of production in relation to the costs of all the others is equal to its elasticity in the production function. Put another way, if the elasticity of the labor factor is 0.6 4 then we should expect labor remuneration to represent 60% of production costs, and vice versa. 5 .
Demonstrating the cost share theorem
The most direct demonstration assumes that the economy as a whole can be represented by a representative economic agent who decides to maximize his profit, i.e. the monetary value of his production function minus the costs arising from the various production factors. In this case, the optimal allocation is indeed the one where the share of the cost of each production factor (its remuneration) is equal to its elasticity in the production function. A version of this demonstration is available here.
Another, slightly more complex demonstration assumes that companies are in perfect competition and adjust their production to maximize individual profits. By aggregating all individual behaviors, we arrive at the same result (at the cost of a questionable mathematical shortcut). A version of this demonstration is available in paragraph 2.1 of this research article by Gaël Giraud.
Applied to the economy, the cost-share theorem deduces that energy is not important.
The cost-share theorem can be applied to contemporary economies by considering the “energy” production factor. In theory, the share of wealth captured by the energy sector (i.e. the wages paid to workers in energy companies, and the income from capital injected into these same companies) would give us the elasticity of energy in GDP, i.e. its contribution to economic output.
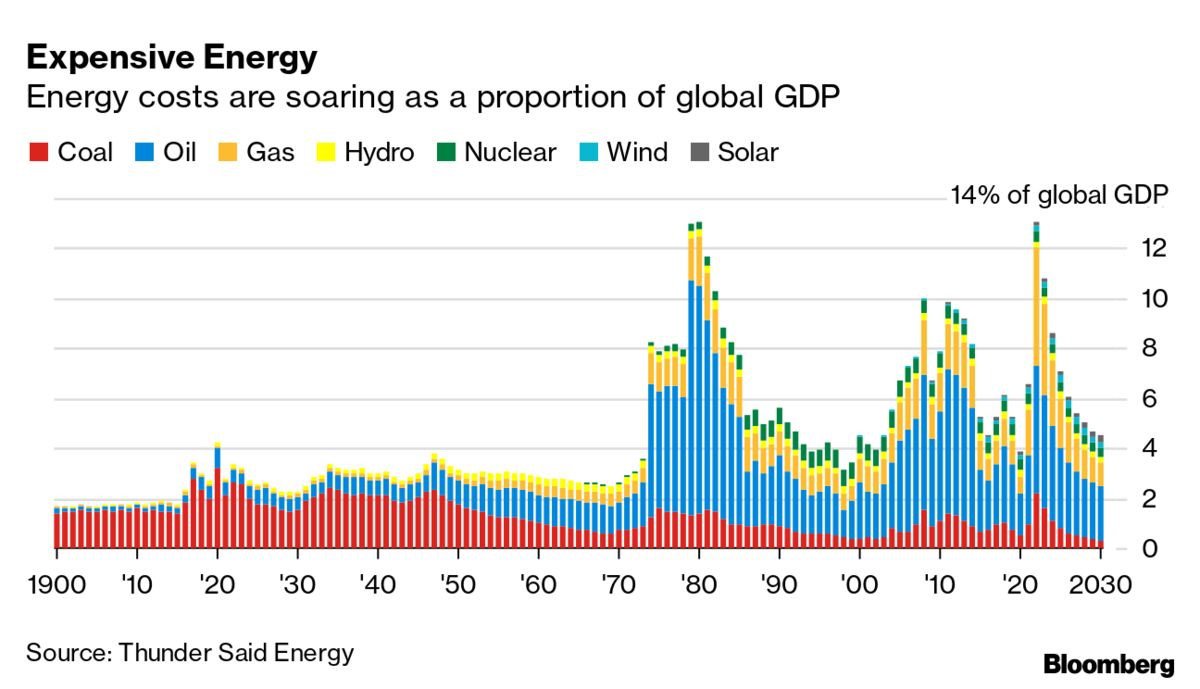
It is difficult to measure this share precisely, for several reasons (on a national scale, imports have to be taken into account, and on a global scale, data are not readily available). One possibility is to measure the ratio between energy expenditure and GDP in a given territory, which gives an order of magnitude of the share of wealth captured by energy companies.
Whether on a global scale or in the United States, for example, this ratio fluctuates between 5 and 10% (and has risen to 14% during energy crises). So, in normal times, energy companies manage to capture at best 10% of the wealth they produce. 6 . The elasticity of energy in GDP would therefore be, at most, 0.1. According to the cost-share theorem, a 10% reduction in energy consumption would therefore reduce GDP by 1%.
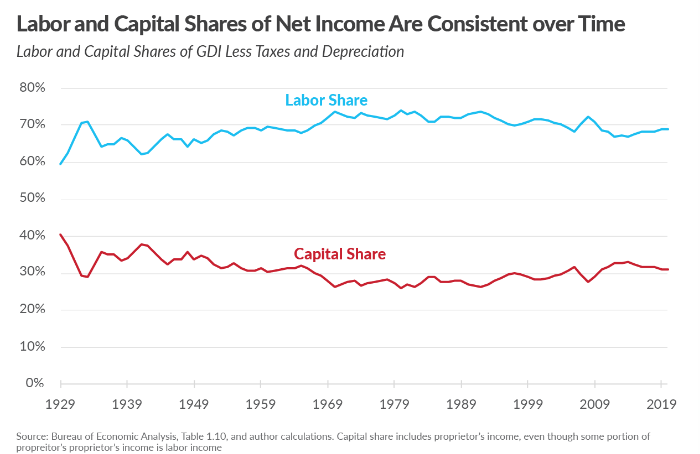
Conversely, capital returns 7 and labor (as a whole, or even minus labor and capital useful for energy production) account for a significant share of GDP. It’s rather difficult to draw a clear line between remuneration linked to labor and remuneration linked to capital (how to deal with self-employed entrepreneurs, intellectual capital from research, etc.), but we can remember that on average, labor captures between 50 and 70% of total wealth produced, while capital captures between 30 and 50%. In the United States, for example, labor has accounted for 65% of gross domestic income in recent years, and capital for 35%. 8 . In France, the figures are very similar.
At this stage, the cost-share theorem would lead us to conclude that energy is not very important for the economy, since it is not expensive and therefore has little influence on the production function. Conversely, capital and labour would be the two major factors of production that need to be taken into account.
Accounting erases the role of natural resources
If economists only consider labor and capital (in production functions, but also in national accounting), it’s also because nature doesn’t charge for energy or for the natural resources we draw from it free of charge. From an economist’s point of view, energy is a purchase from an energy supplier, the sale of which enables the latter to pay wages, remunerate capital, and itself buy raw materials from other companies (whose costs break down in the same way). This takes us all the way back to the primary producers, who do not pay nature to extract oil or gas (they may pay rents to landowners, which is a remuneration for capital).
In macroeconomic terms, the monetary value of production sold is only reflected in wages and capital remuneration: production sold = capital remuneration + wages. What we call the price of energy is simply the sum of wages and capital remuneration paid in the energy value chain (from extraction to final distribution).
This observation is true for all natural resources: we only pay people, in the form of wages or capital remuneration (in the form of profits, capital gains and rents). This is one of the reasons why economists have reduced everything to the pairing of labor and capital, thus erasing the role of natural resources.
The effect of energy on GDP greatly underestimated
In early 2022, leading economists published a study estimating the effect of a complete German embargo on Russian gas. 9 . According to them, the disruption of gas supplies would have a relatively minor impact on the German economy, generating, all other things being equal, a loss of 0.3% of GDP for one of the models used, and between 0.5% and 3% of GDP for the other, while the average cost to the EU would represent between 0.2% and 0.3% of GDP.
However, according to the German research institute IFW Kiel, which spoke at the end of 2022, the Ukrainian crisis has resulted in a GDP 4% lower than envisaged in the winter 2021 economic forecasts.
These methodologies suffer from a number of shortcomings 10 and grossly underestimate the role of energy in industry. And yet, this study has enjoyed a high profile in the media. It was supported by other economists, such as Paul Krugman or Esther Duflo and Abhijit Banerjee, to encourage Europe to act for Ukraine, and was heard by politicians. The study was also taken up by a note from the Conseil d’analyse économique.
The economists behind these estimates have assumed that Russian gas is substitutable by other factors of production (other sources of energy, labor or capital). This overlooks the fact that gas-powered equipment cannot instantly be converted to run on oil or coal. What’s more, replacing the energy input of gas with human labor is simply insane (an army of cyclists will never pedal enough to reach the temperatures of gas furnaces). This economic study is just one example of the disconnect between macroeconomic models and reality, especially when it comes to energy. 11 .
Empirical analysis shows a much higher elasticity between GDP and energy consumption
Energy is a major production factor, according to econometric studies
Before explaining the theoretical problems of the cost-share theorem in section 4, we present here empirical economic results, based on observation and relatively few assumptions, which propose a very different estimate of the elasticities of energy, labor and capital.
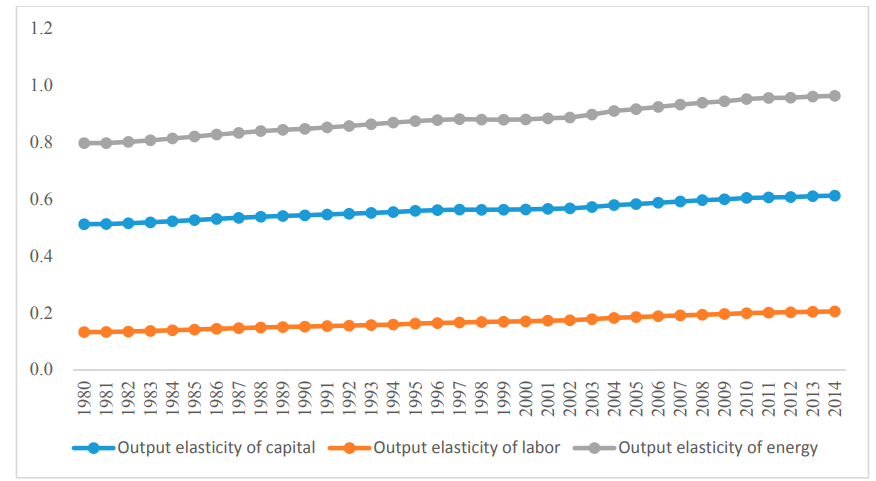
In a 2014 article, Gaël Giraud and Zeynep Kahraman study the relationship between GDP and energy in 33 countries for the period 1970-2010. 12 . They find an elasticity of between 0.6 and 0.8 for energy (compared with around 0.1 according to the cost-share theorem, i.e. 6 to 8 times less), 0.1 for capital (compared with around 0.4 according to the cost-share theorem) and zero elasticity for labor (compared with around 0.6 according to the cost-share theorem). According to this work, energy therefore plays an overwhelming role in relation to labor and capital, which have only a minor influence on wealth formation. This is a complete reversal of the conclusions drawn from economic analyses based on the neoclassical framework.
Measuring the elasticity of capital, labor and energy
Other studies have been carried out on this issue. All those who have adopted an empirical posture, based on observation of reality, have come to the same conclusion: energy has a much higher elasticity than that predicted by neoclassical theory. Elasticities have been calculated for China, for example 13 and the result is similar: the elasticity of energy in GDP is around 0.9, well above that of capital or labor.
We can therefore conclude that, contrary to prevailing economic theory, energy is a major factor of production. Empirical studies show that reducing energy consumption by 10% would reduce GDP by 6 to 9%.
Elasticity is a local concept
It should first be pointed out that elasticity, whether given by a mathematical theorem or by empirical analysis, is a “local” notion, i.e. relative to small variations (typically less than 10%). 14 . Elasticity cannot tell us what happens if energy consumption falls by 30%, 50% or 80%.
Beyond the threshold of small variations, we can’t predict what will happen. Faced with a sharp drop in energy supply, for example, an economy could become resilient, or, on the contrary, suffer threshold effects that plunge it into complete chaos. Conversely, an economy might find a small energy surplus useful, but wouldn’t know what to do with the extra 50% of oil it decided to procure overnight.
This is also the case for labor and capital. If empirical analysis shows that increasing or decreasing the quantity of labor by 2, 5 or 10% doesn’t change much in terms of GDP (because elasticity would be zero), we can’t deduce from this that we can put everyone on paid leave ad vitam aeternam. It’s undeniable that a minimum level of work is necessary, as is the constitution of sufficient capital.
But then, is the notion of elasticity useless? No. Even if an elasticity is only locally valid, it can tell us something about the limiting or non-limiting nature of a production factor. If the elasticity of labor is zero, it may be that there is a surplus of unused labor (which would be in line with David Graeber’s thesis in “Bullshit jobs”). Conversely, the high elasticity of energy invalidates all economic models that do not take natural resources into account.
Furthermore, it is likely that elasticity will only increase with the magnitude of an energy shock. In other words, if econometric models predict an elasticity of 0.6 for an energy shock between -1% and -10%, we should expect a higher elasticity for a shock between -10% and -20%, and so on. The elasticity we measure for small shocks is actually the most optimistic version of what would happen for large energy shocks. This is because an economy will tend to cut the most energy-intensive sectors first (those where one euro of value added requires the most kWh of energy). The bigger the shock, the more the less intensive sectors will be affected (those whose one kWh of energy generates many euros of added value).
Why the cost share theorem is wrong
We have just seen that the results of neoclassical economic theory are not in line with empirical facts. We might have expected this from a striking counter-example: the agricultural sector. According to the French Ministry of Agriculture and Food, agriculture accounts for 3.4% of French GDP. According to the cost-share theorem, a 20% reduction in food production should therefore have a negligible impact on GDP (20%*3.4% = 0.68%). Can we be sure? It’s hard to imagine that such a reduction in food production would have no impact on other economic sectors, and therefore ultimately on GDP. In the same way, drinking water costs practically nothing, whereas we’d be prepared to pay a lot of money for it if we didn’t want to die of thirst.
The proof of the theorem is based on valid mathematical reasoning. If it is false, then it is necessarily because certain assumptions do not hold. There are several demonstrations of the theorem, but all are based on at least two essential assumptions.
The first is that producers are in perfect competition, which implies that factors of production are remunerated at their marginal productivity. 15 (marginal productivity is another name for the elasticity of a factor in the production function). Obviously, this assumption does not correspond at all to the real world. At best, economic players try to maximize their profits, but are then faced with various constraints: geopolitical, legislative, social, etc. The energy market is by no means free and competitive. It is extremely political and monopolistic (remember that OPEC is a cartel). These numerous constraints change the mathematical formulation, and so the demonstration is no longer possible. 16 .
The second assumption is that the economy is in equilibrium. At each point in time, it is assumed that all economic players have had time to adapt their choices to maximize their income. However, we are never really at equilibrium: economic players are constantly reassessing their choices in the light of the new information they are constantly acquiring.
Moreover, the cost-share theorem is used precisely to assess the impact of a shock (whether energy, capital or labor). This is complete nonsense, since the impact of a shock lies in the shift in equilibrium it induces, in the loss of reference points and in disorganization. To quantify the consequences of a loss of equilibrium, we rely on a theorem that assumes equilibrium… which is absurd.
All things are never equal
Elasticity is used to measure the effect of a variation in one of the factors, all other things being equal. We want to know, for constant labor and capital, the impact on GDP of a 10% increase or decrease in energy consumption. However, it is likely, in view of what we mentioned earlier, that “all other things being equal” is only virtual and exists only in mathematical reasoning.
In a prosperous economy, all factors of production tend to vary in concert. And vice versa, in an economy hit by recession. It’s rare to see a one-sided shock to a single factor.
In reality, it’s impossible to vary energy consumption without varying the quantity of labor or capital. A machine cannot run without energy, and the people who operate it are out of work. In this case, the exact value of elasticity is of little use, since we never observe it. So, even if energy had a low elasticity of 0.1 as predicted by the Cost-share theorem, but labor and capital fell sharply when energy consumption fell, then energy would de facto play a far more important role than the 0.1 figure suggests.
The more fundamental problem of the production function
It seems natural that the “quantity” of labor or capital should influence our economic output. On the other hand, it is far less natural to measure this quantity via a single variable that aggregates the hours of engineers with those of lawyers or teachers. The problem is identical for the “quantity” of capital. How do you aggregate steel mills with container ships or gas power plants? Economists have a simple answer: they measure the monetary counterpart of capital and labor. So, in the final analysis, we’re not measuring the quantity of labor, but total wages, which isn’t quite the same thing. For physical capital, we add up the costs of the various pieces of equipment. Factors of production, as an aggregate quantity of various objects, therefore depend on prices and monetary conventions.
The main factors of production used in the most widespread economic theory are labor, capital and technical progress (which includes technology, human organizational skills, etc.). Natural resources are rarely included, and when they are, they are almost always viewed through the prism of energy alone. 17 .
Economists have tried, in vain, to prove the existence of a production function.
There is no solid evidence that production functions effectively account for economic output. Robert Solow claimed to have demonstrated the existence of an aggregate production function that would give a remarkable account of his data on US economic output between 1909 and 1949. Indeed, it appeared that his model, based on a Cobb-Douglas-type production function, perfectly captured his dataset.
However, as soon as it was published, a young doctoral student, Warren Hogan, strongly criticized Solow’s demonstration and showed mathematically that it was false and proved nothing at all. Indeed, Hogan realized that, given Solow’s statistical treatment of data, any completely random data would also have corroborated the model, which is absurd. 18 . Solow awkwardly tries to respond, but can only half-heartedly admit his error. Solow’s demonstration, like Hogan’s devastating critique, appeared in a renowned economics journal. Yet Robert Solow was awarded the Nobel Prize in Economics in 1987 for his work on growth, which was based on the existence of this production function. Today, the aggregate production function is a tool still in use, even though no one has been able to provide solid proof of its effectiveness in accounting for reality. The problem has been ignored, not least because it’s a handy tool for building macroeconomic models.
In addition to relying on the existence of a production function allegedly demonstrated by Solow, the demonstration of the cost-share theorem also assumes that this production function is “regular” in a certain mathematical sense (its derivative must be continuous). This assumption is highly debatable, as the following example shows.
Why the cost share theorem needs a “regular” production function
Let’s imagine a relatively simple economy that operates with machines (capital), machine operators (labor) and fuel for these machines (energy), and requires the simultaneous presence, in equal quantities, of these three factors. The production function is then a Leontieff-type function: Q = minimum (a*K; b*L; c*E), which is not at all “regular”. 19 .
Let’s try to understand why the cost-share theorem is likely to fail in this case. Let’s take a company that produces and sells €100 worth of goods. It has to decide how to divide this profit between its investors, its employees and its energy supplier. Neoclassical economics has a ready-made answer to avoid negotiation: remunerate each factor at its marginal productivity. An additional unit of labor (or capital or energy) would have no effect, since the other two factors would not follow. The marginal productivity of each production factor is zero. The company therefore concludes that none of the factors deserve remuneration.
But if the employees decide to withdraw, the company loses its €100 of production and will have surplus machinery and fuel. This is also the case if investors demand repayment of their contributions. 20 or if the supplier stops delivering oil. From this point of view, each factor of production can legitimately demand €99, otherwise it would leave. But the company only has €100 to divide between the three factors… The paradox is ignored by neoclassical theory, which overlooks the interdependence of production factors.
Economists play merrily with accounting concepts
Finally, economists blithely mix physics and economics in this type of model. Capital can be understood in two different senses: passive capital, which briefly refers to shares and loans to be repaid (or put another way, sources of finance), and active capital, which refers to machinery, equipment and other intangible elements (such as patents or trademarks). It is “active” capital that produces, but it is “passive” capital that is remunerated (and which can be more or less easily measured in monetary terms). Passive” capital doesn’t need energy to function, whereas “active” capital obviously does.
The two are linked, as it is often assumed that capital (“liabilities”) must finance fixed assets (“active” capital), but this is not necessarily the case: money is fungible, and resources on the liabilities side finance all assets. What’s more, the conditions for remunerating the funds contributed to the company vary (from one company to another, from one year to the next for the same company, and from one type of provider to another) according to parameters that are not physical. There is therefore a discrepancy between the marginal productivity of machines and the return on borrowings, itself distinct from that on equity…
Furthermore, neoclassical economic theory assumes that companies sell everything they produce. In the real world, companies can’t always sell as much as they’d like; they often operate in a competitive market with demand that may be well below the companies’ cumulative expectations. The marginal productivity of a factor of production, even if it is excellent and higher than the market price, may be useless if demand is already satisfied.
The link between energy and GDP is not inevitable
The importance of energy in GDP is out of all proportion to a fundamental – yet unfounded – theorem of neoclassical theory, the cost-share theorem. On the contrary, empirical studies based on observed data show a very high elasticity, in the range of 0.6 to 0.9, which supports the observation that economic growth is driven by growth in the number of machines in operation (which therefore consume energy).
This is not to say that the link between energy and GDP is a law of nature or a foregone conclusion. This observation is valid today (but not necessarily tomorrow), for the current definition of GDP (which is very materialistic, but which we might wish were more qualitative and social) and for our current economic organization (which it is possible to change). It’s up to us to disprove and invalidate this profound link between GDP and energy. We have room for progress in our use of energy (both in terms of sobriety and efficiency) and even greater room to make our happiness less dependent on overconsumption of material goods. And we have yet to implement real public policies aimed at making our economic system resilient to energy shocks, based on sobriety rather than excess.
- Oil, coal and gas alone account for 75% of our primary energy consumption (and 67% of our final energy consumption in “direct” fossil fuel consumption, and 80% including fossil fuel electricity). ↩︎
- In accounting terms, productive capital is counted on the assets side of a company’s balance sheet (fixed assets), while financial capital is counted on the liabilities side. There is no accounting equality between the two. To find out more, consult the fact sheet on the different meanings of the term capital, and the module on corporate accounting. ↩︎
- For a fuller definition of elasticity, see Does the price of energy vary consumption? ↩︎
- In which case a 10% increase in the quantity of labor increases production by 6%. ↩︎
- Note that this elasticity is also called “marginal productivity”. It is deduced from this reasoning that a worker’s wage should be equal to his marginal productivity(which is obviously debatable). ↩︎
- The share captured by energy providers is even lower in France, where electricity is still inexpensive to produce. ↩︎
- Here, capital is taken in the sense of a liability (such as bank loans) and does not refer directly to the quantity of machines that are the physical tools of production. ↩︎
- As with energy, it is difficult to measure empirically the share of wealth captured by labor (or capital). The ratio between the sum of income from labor (or capital) and gross domestic income gives an order of magnitude. ↩︎
- “What If? The Economic Effects For Germany Of A Stop Of Energy Imports From Russia”. 2023. Cesifo.Org. https://www.cesifo.org/en/publications/2022/working-paper/what-if-economic-effects-germany-stop-energy-imports-russia. ↩︎
- See François Geerolf, The “Baqaee-Farhi approach” and a Russian gas embargo – some remarks on Bachmann et al. Sciences Po OFCE Working Paper, n° 14/2022. www.ofce.sciences-po.fr/pdf/dtravail/OFCEWP2022-14.pdf ↩︎
- See François Geerolf’s interview on this subject for more details https://g-r-s.fr/francois-geerolf-il-se-passe-dans-la-realite-linverse-de-ce-que-prevoient-les-modeles/ ↩︎
- Gaël Giraud, Zeynep Kahraman. 2014, “How Dependent is Growth from Primary Energy? The Dependency ratio of Energy in 33 Countries (1970-2011) ↩︎
- Lin, Boqiang & Liu, Kui. (2017). Energy Substitution Effect on China’s Heavy Industry: Perspectives of a Translog Production Function and Ridge Regression. Sustainability. 9. 1892. 10.3390/su9111892. ↩︎
- As a reminder, the elasticity between A and B allows us to know, if B varies by x%, by how many percent A varies. This “prediction” only works for small variations, of the order of a few percent. In fact, it’s quite possible that the very value of elasticity will change if the variations are too great. For example, reducing your sleep time by 10% will degrade your ability to concentrate by, say, 10% (elasticity of 1), reducing your sleep by 50% will degrade your concentration by much more than 50%, and probably by 100% (elasticity of 2). ↩︎
- That’s if companies know how to calculate the marginal productivity of their factors, which is far from self-evident. See the homo economicus sheet ↩︎
- The result then depends on “shadow prices”, which correspond to the costs of the various constraints and disrupt the formula given by the cost-share theorem. Section 2.3 of Gaël Giraud and Zeynep Kahraman’s article demonstrates this. ↩︎
- The ThreeME model used by ADEME is one of the few that disaggregates natural resources into different energy sources, and takes into account the main materials the economy uses to function, see here. ↩︎
- The Solow model’s R-squared score, which lies between 0 and 1 and measures the quality of a model, was 0.9. Such a score has never been observed for other economic models, whose score very rarely exceeds 0.5. This abnormally high score should have made Solow doubt the construction of his model. ↩︎
- In fact, its derivatives are not continuous and not defined at certain points. However, to demonstrate the cost-share theorem, continuous and well-defined derivatives are absolutely essential. ↩︎
- This is possible through a reduction in capital. ↩︎