
This text has been translated by a machine and has not been reviewed by a human yet. Apologies for any errors or approximations – do not hesitate to send us a message if you spot some!
If the price of an energy product rises, does its consumption fall? If so, by how much? Does the answer depend on the type of energy or the type of consumer, business or household?
The question is important because it has essential implications for public policies aimed at reducing energy consumption, for mechanisms to protect purchasing power during uncontrolled rises in energy prices, and for economic forecasts aimed at estimating the evolution of energy consumption. With each new energy crisis, for example, politicians have to choose between direct control of energy prices (by lowering taxes or freezing prices) or subsidies in the form of cheques to households, allowing prices to fluctuate freely – two options with very different implications.
Economists use a key tool to answer this type of question: elasticity. This fact sheet explains what elasticity is and what recent economic literature has to say about the concept, before suggesting some very concrete policy implications.
What is elasticity in economics?
The definition of elasticity
In economics, elasticity measures the variation in a first quantity caused by the variation in a second quantity. Elasticity is then defined as the ratio between the percentage change in the first quantity and that in the second.
More precisely, if we want to measure the elasticity of y with respect to x, then we need to have a small variation in x, denoted dx, and be able to observe its causal effect on the variation in y, denoted dy. Thus, dx/x is the percentage change in x, and dy/y the percentage change in y. The formula is “elasticity = (dy/y) / (dx/x) “.
We most often speak of the price elasticity of consumption of a good. In this case, the question is: “If the price of the good varies by 1%, by how many percent does the quantity of the good consumed vary? In this case, y is the quantity of the good in question, and x is its price.
In concrete terms, if the price elasticity of fuel is -0.6 for a French household, this means that if the price of fuel rises by 10%, consumption can be expected to fall by 6%, all other things being equal. If the price elasticity of gas is 0, this means that gas consumption is independent of the price of this energy – gas is said to be “inelastic”. The price elasticity of a good can be positive, but this is much rarer. In this case, consumption increases when the price rises (this is known as the Veblen effect). 2 ).
Substitutable and complementary goods: cross-price elasticity
We can also talk about cross-price elasticity. The question then becomes: “If the price of product n°1 increases by 1%, by how many percent does consumption of product n°2 increase?”. This measures complementarity or substitutability between two products. If an increase in the price of product n°1 leads to an increase in the consumption of product n°2, this means that these products are substitutable. If it leads to a decrease, it means they are complementary.
The notion of substitutable or complementary goods applies particularly to energy, as certain energy sources are more or less replaceable on an economic scale. Oil, coal and gas are the three main sources of primary energy, accounting for almost 80% of the global energy mix. Each of these sources has its own specific characteristics and is not used under the same conditions. Oil is easily exchanged between the world’s different countries, while gas is mainly consumed in the region where it was extracted, as transportation is complex and costly.
These primary energy sources are then transformed to produce the final energies, i.e. those used by the consumer (e.g. electricity, gasoline, heat). Coal, for example, is used to generate electricity and can therefore be partially substituted by gas, which is also used as a fuel in power plants (assuming both coal-fired and gas-fired plants are available). Conversely, oil, because of its high energy density, is mainly used to manufacture the fuel (gasoline, diesel, kerosene, heavy fuel oil) that powers our cars, planes and ships. At present, there is no easily accessible and massively developed substitute.
It is important to understand the technical and economic characteristics of energy sources, as they strongly structure the response to a price constraint or supply shock.
1.3 How do you measure the price elasticity of a good?
Measuring the price elasticity of a good is far from obvious. It is not a naturally observed parameter. Statistical methods must therefore be applied to empirical data in order to obtain an estimate.
The main difficulty is that we want to measure the variation in demand caused by a price change. However, demand can change for a multitude of reasons, independently of price. It is therefore necessary to isolate, from all other sources of variation, that which comes solely from a price shock.
Econometric models are often used to measure elasticities. They are statistical tools based on real data, with relatively few assumptions. In simple terms, an econometric model assumes that there is a linear relationship between a data item of interest and a set of factors. The model estimates the parameters of this linear relationship by applying statistical methods to historical data used as an example. In particular, it is possible to use an econometric model to estimate the relationship between variation in demand and variation in price, all other things being equal. In this way, we can isolate the effect of price on demand, independently of all other factors. This effect is precisely elasticity.
What price elasticities are found for the different energies?
What is taken into account: the price and consumption of final energy
Energy as we know it on a daily basis (fuel at the pump, the electricity that powers our light bulbs or the heat produced by our radiators) is not available as it is in nature. Primary energy sources are those found without human intervention: oil, gas, uranium, wind or solar energy. Conversely, final energy is that which is accessible to an end user. The transition from primary to final energy involves a complex chain: extraction, purification, chemical transformation, transport, distribution and so on. The energy that is finally accessible to us represents only a fraction of the primary energy extracted, because of all the necessary interventions, which themselves consume energy or generate losses.
If we talk about the price elasticity of electricity, we are therefore considering the final price of electricity (which includes the financing of power plants, distribution costs, taxes etc.) and the final consumption of electricity (which therefore assumes a different consumption of primary energy to produce this electricity), and the same for gas or oil.
The weight of energy expenditure in household consumption
Energy enables people to get around (via petrol or diesel), heat and hot water (via electricity, gas, coal, oil or wood), or access all the services provided by electricity (household appliances, electronics, lighting). Energy was also needed to manufacture all the goods and services that people consume on a daily basis, as well as to construct buildings and infrastructure.
Household energy expenditure and share of budget
Fuel (mainly petroleum-based) and the various energy consumption items for housing (electricity, gas, heating oil, wood etc…) each accounted for around 5% of the expenditure of an average household in France in 2019. The weight of energy expenditure obviously varies according to income, a point we’ll develop later.
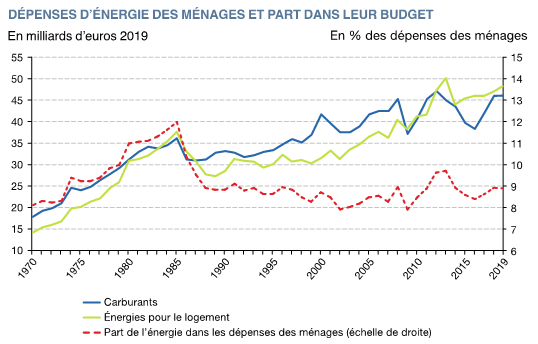
Source Chiffres clés de l’énergie, Datalab of the French Ministry of Ecology, 2021.
Breakdown of final energy consumption by French households in 2019
As can be seen from the following graph, the vast majority of French households use energy for heating and transport.
MISSING DATAVIZ: repartition-de-la-consommation-denergie-finale-par-les-menages-francais-en-2019Source Accounts of physical energy flows in France from 2014 to 2019 (downloaded in November 2022)
Long-term elasticity and short-term elasticity
When we measure the variation in energy consumption following a variation in its price, we may well wait 1 day, 1 month, 1 year or even 20 years before observing the effect. We speak of short-term elasticity when we’re interested in the effect over a few days, and long-term elasticity for the effect over a few years.
The time horizon has a major influence on the value of elasticity. For example, an increase in the price of petrol will have an immediate effect, as some people may already change their mode of transport (mainly urban populations) or limit their journeys, reduce speed or organize carpooling with colleagues. In addition, there is a long-term effect linked to the investment. This may involve private investment (possibly supported by subsidies), such as the renewal of the car fleet (which takes around 15 years) for more fuel-efficient cars or cars using other technologies (electric cars). It can also involve public investment in mass transit systems or bicycle-friendly facilities. Similarly, an increase in the price of gas has both a short-term effect (lower thermostat) and a long-term effect (energy renovation). In all cases, the long-term elasticity is always higher than the short-term elasticity, because it aggregates all the effects.
Long-term energy price elasticity for households
Numerous studies have been carried out, all of which tend to show that households are indeed sensitive to energy prices. The various studies presented below all focus on long-term elasticity
With regard to energy consumption in housing, a study 3 found an elasticity of -0.16 for electricity and -0.36 for fossil gas. The Energy Information Administration 4 has calculated that, according to its simulations 5 the elasticity in 2021 would be -0.5 for electricity and -0.23 for gas in the USA.
In France, INSEE conducts “family budget” surveys that reconstruct the entire household accounting system. An initial study 6 on 2007 data shows that households have a price elasticity of -0.11 for the various energies that power their homes 7 . A second study 8 based on 2011 data, confirmed this order of magnitude, finding an elasticity of -0.2.
These two INSEE studies also provide an estimate of the price elasticity of the fuel used to power our cars, with figures of -0.5 and -0.51 respectively. Other studies have been carried out on a larger scale around the world. One of them 9 gathered data from 132 countries over the period 1995-2008 and found a long-term price elasticity of -0.35 for fuel, while another 10 found an elasticity of -0.25.
What’s in it for companies?
The margins for adaptation are obviously not the same for a company as for an individual. The distinction can therefore be interesting.
Unfortunately, it is difficult to measure the price elasticity of different energy sources for the productive sector. Aggregated data at national level do not always distinguish between households and businesses. On the other hand, large-scale surveys such as those carried out by INSEE very often concern households, as it is much easier to survey individuals who “all look alike” than companies, which may be very different.
However, a few studies have focused on industry. The OECD data study 11 tends to show that for industry, the price elasticity of fossil gas is -0.24 and -0.04 for electricity. There is little data on coal. Only a recent study 12 shows that the elasticity is between -0.3 and -0.7 for China over the period 1998-2012.
Price has only a slight influence on energy consumption
What can we learn from all these figures? Quantifying elasticity is not an easy task, and many factors can interfere with its measurement. This is why studies give different values, sometimes ranging from simple to double. What’s more, the value of elasticity varies greatly depending on the country, the period and, above all, the energy under consideration. That said, we can draw some conclusions that all the studies corroborate.
First of all, it’s easier for households to limit their travel (and therefore their fuel consumption) than it is to limit the energy costs of their homes. 1 . This is understandable: many of our journeys can be avoided (leisure, vacations), and those that can’t (work, school) can be replaced by carpooling, public transport or cycling. On the other hand, no matter how expensive gas (or electricity) is, it quickly becomes unpleasant to heat your home below 18°C. A report by the Agence nationale de l’habitat (ANAH) on fuel poverty highlights the fact that energy bills are the first to go unpaid by certain low-income groups when they can no longer afford to meet all their basic needs. In the UK, the “Don’t Pay” movement was born out of rising energy prices, and calls for people not to pay their energy bills. Above a certain amount, the elasticity becomes zero.
Secondly, although they are not zero, the price elasticities of travel and housing are not very high. Energy consumption is therefore said to be inelastic. In order of magnitude, increasing the price of electricity and gas by 100% will only reduce consumption by 20%. This shows that energy today fulfils almost vital functions that households find hard to do without.
The political implications of energy price elasticity
Elasticity varies according to the energy considered
These observations call for some analysis of their political implications.
Firstly, as we saw in the previous section, the elasticities measured are quite low. So we shouldn’t rely solely on price increases to reduce our energy consumption. With an elasticity of -0.2, reducing consumption by 80% (which corresponds to the planetary objectives if we want to stay below 2°C) implies increasing the price by 400% (assuming that the price elasticity remains constant with the price increase, which is probably not the case). Needless to say, this is neither feasible nor desirable.
Secondly, households do not reduce their consumption in the same way for the same price change, depending on the energy under consideration. As we saw in section 2, gas consumption is likely to be more price inelastic than oil consumption. However, if public authorities wish to limit CO2 emissions through energy taxes, the effect will be all the weaker the more price-inelastic the energy source concerned.
Hoping to reduce gas consumption in homes will therefore be futile if we rely solely on price increases. Some changes require more support than others. For example, thermal renovation of buildings represents a heavy financial and mental investment for individuals (knowing what to do, finding craftsmen, bearing the costs of the work, etc.). Public authorities therefore need to focus their educational and support efforts where change is least obvious.
On the other hand, an economic agent will only change his behavior if the price change actually reaches him. However, most electricity suppliers’ current contracts have a very static pricing structure (to find out more about electricity supply, see our articleon the retail electricity market). As the price elasticity of electricity is not zero in France, variable pricing according to the time of day could be an interesting lever to encourage households to defer their consumption at times of peak demand. Tariffs of this type have existed for a long time (peak/off-peak tariff, EJP tariff), but the trend is to eliminate them in order to expose households more directly to wholesale market prices, which is not without risks.
13
. However, care must be taken not to expose households to too much price volatility, against which they could do nothing.
Energy price elasticity is not the same for all population categories
The average price elasticity of an energy source can cover disparities between different social classes.
For example, INSEE data show that price elasticities for transport and housing rise towards zero for the most affluent households living in urban areas. Households in D1 (the first income decile, i.e. the poorest 10%) living in rural areas have a price elasticity of -0.54 for fuel, while Parisian households in the tenth income decile (the last income decile, i.e. the richest 10%) have a price elasticity of -0.17.
With regard to energy used in the home (gas, electricity, etc.), the elasticity is -0.2 for all D1 households in large cities, compared with almost 0 for D10 classes. Clearly, a household belonging to the wealthiest decile of the population will change almost nothing in its heating or electricity consumption, whatever the rise in the price of these energies.
As a result, not all households participate to the same extent in the effort to reduce energy consumption following a price rise. As the underprivileged are more sensitive to a price rise, they are the ones who will reduce their consumption more, thus suffering more from discomfort (fewer leisure trips, lower thermostats, etc.).
Symmetrically, the introduction of an energy (or carbon) tax does not represent the same financial effort for all households. Even if they react more to a price increase, the same study shows that the financial contribution of French people in D1 would represent 2.5 times more of their income than for French people in D10. In a way, the most modest are paying twice for price rises. Firstly, because their behavior changes, and this can be painful, and secondly, because their total budget is heavily impacted.
These differences in elasticity according to household income or location therefore need to be taken into account when raising energy prices (whether deliberately or inadvertently), in order to support the most disadvantaged.
The importance of planning price increases
As we saw in section 2. C, there is a difference between short-term and long-term price elasticity. A meta-analysis 14 of 101 econometric studies measured a gasoline price elasticity of -0.26 in the short term and -0.58 in the long term.
Some changes in behavior take time (you don’t change your car overnight when the price goes up), which means that a price increase needs to be planned and announced in advance to maximize its impact while limiting social discomfort. In addition, public support for private investment (e.g. assistance with the purchase of an electric bicycle, a more energy-efficient car or home insulation) and public investment (e.g. renovation of the public building stock, construction of infrastructure for cycling and public transport) are essential to reinforce this price elasticity in the long term.
How to cushion energy price rises?
Since the winter of 2021-2022, shocks to gas, electricity and petrol prices have forced governments to take measures to limit the impact on households and businesses. Two solutions are regularly put on the table: a subsidy of a certain amount, independent of each person’s initial energy consumption(the famous “energy voucher”) or a direct reduction in the price of energy (via a reduction in taxes or via a regulated price, the famous “tariff shield”). Both options have their own implications.
If we opt for a subsidy, the measure can be targeted at the households that need it most, thus reducing the cost of the measure for public finances. Furthermore, all households continue to “feel” the price effect. In this way, they are still encouraged to consume less (which is useful if the price increase stems from a shortage of supply or a tax aimed at reducing energy consumption), while suffering a reduced financial shock (the subsidy can be used to offset the extra cost for those with limited means). The disadvantage is that it’s impossible to know exactly what each individual’s initial consumption is, so each person receives a subsidy that corresponds to an average. However, some individuals may find themselves at a disadvantage because they initially consume a lot of energy for a reason they can do nothing about in the short term (a long commuting distance, for example, or living in a thermal sieve), so the subsidy does not cover all the extra cost.
Distribution of CO2 emissions by standard of living
CO2 emissions for each individual are calculated using INSEE’s Family Budget survey. They are highly correlated with energy consumption. We can see that even within an income class (the deciles), the distribution is widely scattered around the average. This heterogeneity makes it impossible to satisfy everyone if the subsidy depends solely on income (and not on other factors such as the energy class of the dwelling occupied or the distance from home to work).
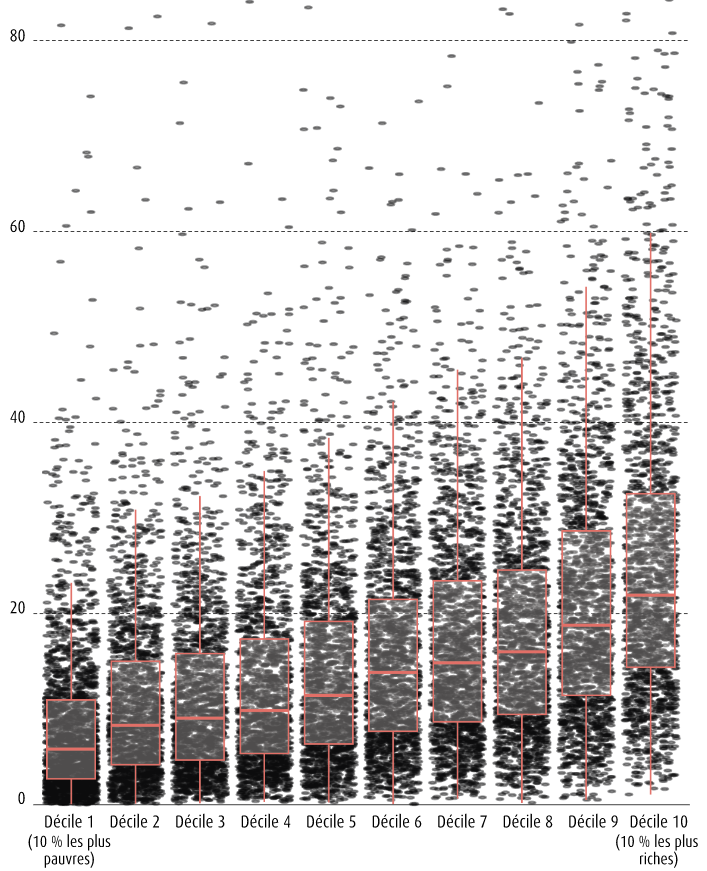
Source OFCE report
If the government opts to lower the price (via tax cuts or price-blocking regulations), any incentive to reduce energy consumption is nullified. The cost to public finances is all the greater because it is not possible to target these price cuts according to the income levels of energy consumers. The most affluent populations, who are much less in need of a financial boost than the most modest, are helped in the same way. On the other hand, disguising the price increase can lead to a worsening of the situation if the rise is linked to insufficient supply. On the other hand, the advantage is that no one suffers a budget shock, whatever the initial energy demand.
Finally, there are more structural options: investing in “decarbonizing” public infrastructures, helping economic players to invest as well, offering alternatives to current energy services (bicycle paths, heating networks, etc.). These options help to increase consumers’ long-term price elasticity.
A warning against hasty analysis of the link between price and energy consumption
Energy prices and consumption over time
Oil can be transported over long distances by pipeline or tanker. This represents between 6 and 7% of the total cost, which is relatively low and allows us to assume that there is a more or less uniform oil price worldwide at any given time.
If we look at the volume of oil consumed and the price per barrel over time, and consider the elasticities mentioned above, we would expect to see a decreasing curve. If the price is high, then consumption is low, and vice versa.
However, the volume of oil consumed worldwide does not seem to depend on price.
Crude oil prices and consumption
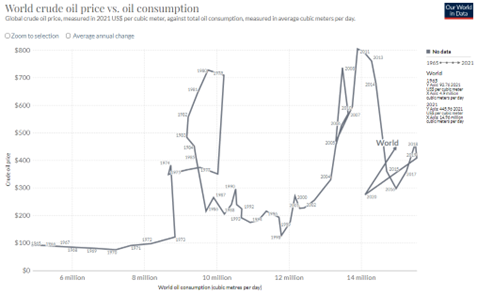
Source Our World in Data
Reading: in 1972, crude oil consumption amounted to 8 million barrels per day at an average annual price of 100 USD 2021 per cubic meter of crude oil.
Unlike oil, trade in coal is not very “fluid”. The price per tonne is fairly low, making long-distance transport highly uneconomical. Coal is consumed locally, in the regions where it is mined. Looking at consumption as a function of price on a global scale would therefore make no sense, since there is no “world” price for coal, only regional prices. But if we limit ourselves to Europe (where prices are relatively homogeneous), the conclusion is the same as for oil: coal consumption does not seem to depend on its price.
European coal prices and consumption
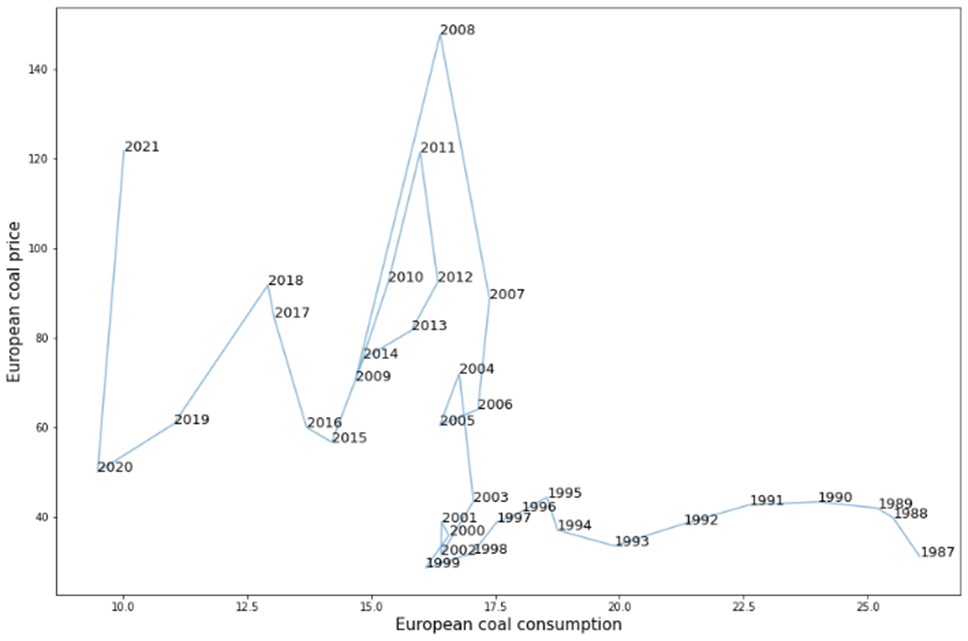
Source Statistical Review of World Energy, BP, 2022
Reading: in 2018, Europe consumed 13 exajoules (EJ) of coal at a price of $90 per tonne.
Does this mean that there is no price elasticity for energy?
We would like to take this opportunity to warn against over-hasty analysis of the link between energy prices and consumption. These graphs in no way allow us to conclude that the price of energy has no impact on the quantity consumed. There are several possible reasons for the discrepancy between the graphs and econometric studies.
The main reason is that elasticity is defined “all other things being equal”. It gives an idea of the evolution of consumption as a function of a change in price, the rest of the world being assumed to be static. We can construct a counter-example that shows the absurdity of this quick analysis. Assuming that the number of machines in use worldwide increases (as has happened at great speed over the last half-century), the demand for energy will mechanically increase. Assuming that the law of supply and demand applies, this should lead to an increase in prices. We would therefore see a simultaneous increase in prices and consumption. However, this does not prove that an increase in price leads to an increase in consumption.
Furthermore, consumers do not consume crude oil. They buy oil at the pump, the price of which in France depends 60% on taxation, 15% on refining, distribution, etc., and 25% on the raw material (crude oil). The final price of electricity is only 36% dependent on production costs. It is therefore normal to observe no net elasticity when looking at final energy consumption and the price of the primary energy source.
Another reason, closely related to the first, is that prices and consumption levels vary for a multitude of reasons. For example, the oil market is an oligopoly, subject to geopolitical tensions and market manipulation by the major producing countries. All these shocks add to the elastic relationship between price and demand.
In conclusion, price is just one of the variables affecting overall consumption. Other factors have an equally significant impact on what we observe on a macro-economic scale. This does not invalidate the existence of a price elasticity for different energy sources, but only confirms that it is relatively low.
- Note that this is true at the aggregate level, but not necessarily for everyone: some households can limit their travel, while others can’t at all. ↩︎
- This effect was highlighted by the economist and sociologist Thorstein Veblen. In the luxury goods sector, a fall in the price of a product reduces its attractiveness to consumers. Conversely, an increase in price can make a product more desirable, because it reflects a high social status. ↩︎
- Liu, Gang, “Estimating Energy Demand Elasticities for OECD Countries. A Dynamic Panel Data Approach“, Discussion Papers, no. 373, Statistics Norway, Research Department, Oslo, 2004. ↩︎
- The Energy Information Administration is an independent statistical agency within the U.S. Department of Energy. ↩︎
- Price Elasticity for Energy Use in Buildings in the United States“, US Department of Energy, January 2021. ↩︎
- Emmanuel Combet, Frédéric Ghersi, Jean Charles Hourcade, ” Taxe carbone, une mesure socialement régressive? Vrais problèmes et faux débats “, Working Paper n°13, CIRED, 2009. ↩︎
- Each consumer (here, consumers are households) has a specific price elasticity for a given good. The price elasticity of this good is therefore the average of the price elasticity of each consumer for this good. ↩︎
- Thomas Douenne, “The vertical and horizontal distributive effects of energy taxes: a case study of a French policy“, Paris School of Economics, 2018. ↩︎
- Paul J Burke, Shuhei Nishitateno, “Gasoline prices, gasoline consumption, and new-vehicle fuel economy: Evidence for a large sample of countries“, Energy Economics, Elsevier, vol. 36(C), 2013, p. 363-370. ↩︎
- Mohammad Arzaghi, Jay Squalli,. “How price inelastic is demand for gasoline in fuel-subsidizing economies?“, Energy Economics, vol.50, 2015, p.117-124. ↩︎
- Liu, Gang, “Estimating Energy Demand Elasticities for OECD Countries. A Dynamic Panel Data Approach“, Discussion Papers, no. 373, Statistics Norway, Research Department, Oslo, 2004. ↩︎
- Paul J. Burke, Hua Liao, “Is the price elasticity of demand for coal in China increasing?”, China Economic Review, vol.36, n°1, p.309-322. ↩︎
- This is dynamic pricing, which involves indexing the tariff paid by the consumer to the wholesale market price, and sending him the daily tariff schedule 24 hours in advance so that he can adjust his consumption. The problem is that this exposes consumers to the extreme volatility of the wholesale electricity market, while leaving them little room for maneuver in adjusting their daily consumption. Find out more about dynamic pricing and the retail electricity market. ↩︎
- Molly Espey, “Explaining the Variation in Elasticity Estimates of Gasoline Demand in the United States: A Meta-Analysis“, The Energy Journal, vol. 17, no. 3, 1996, p. 49-60. ↩︎