
This text has been translated by a machine and has not been reviewed by a human yet. Apologies for any errors or approximations – do not hesitate to send us a message if you spot some!
In the quest to reduce CO2 emissions, we regularly talk about different levers: demographics, degrowth, sobriety, energy efficiency and the energy mix. To understand the impact of each of these terms, it’s convenient to use the Kaya equation. Credited to Japanese economist Yoichi Kaya, this equation breaks down energy-related CO2 emissions (i.e., those resulting from energy consumption) according to a mathematical formula that is nothing more than a tautology, but provides an interesting line of interpretation. In Environment, Energy, and Economy: strategies for sustainability, he wrote in 1997 that the quantity of energy-related CO2 emitted into the atmosphere is equal to the carbon intensity of energy, multiplied by the energy intensity of GDP, multiplied by GDP per capita, multiplied by population.
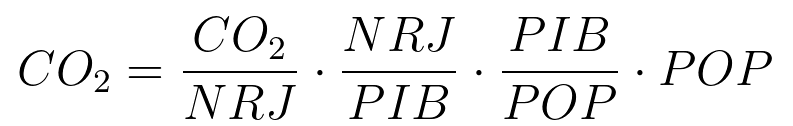
Demonstrating this formula is straightforward: starting from CO2=CO2, we multiply and divide the right-hand member by GDP, then by the quantity of energy, then by population, i.e.CO2 =CO2 * GDP/GDP * NRJ/NRJ * POP/POP. We then simply reorder the terms to obtain the equation itself. In this fact sheet, we will detail the observations that can be made from this formula, while underlining its limitations and the questions it raises.
CO2 energy is only part of the emissions that contribute to climate change
In 2019, CO 2 accounted for 75% of anthropogenic (human) greenhouse gas (GHG) emissions. Methane accounted for 18% of emissions (CH4 comes from ruminant digestion in particular), nitrous oxide for 4% (N2Ois formed in particular during the use of nitrogen fertilizers), and halocarbons for 3%.
In addition, CO 2 comes from a variety of physical sources:
– EnergeticCO2 = 81% of total CO2 emissions. It is emitted during the combustion of hydrocarbons or fossil fuels (coal, oil and gas).
– Land use change = 15% of total CO2 emissions. Soil and plants (especially trees) naturally storeCO2. They are said to be carbon sinks. Deforestation or soil artificialisation releases this storedCO2.
– The remaining 4% comes from industrial processes. For example, making cement involves decarbonizing limestone to recover calcium oxide, and this chemical reaction producesCO2.
In total, CO 2 emissions considered in this data sheet therefore represent only 61% of the climate problem. Kaya’s equation therefore only looks at part of the problem.
To find out more, consult our sheet Counting greenhouse gas emissions.
Source: IPCC Sixth Assessment Report (2022) – Working Group 3 – Chapter 2 – Figure 2.5 and 2.7
What Kaya tells us about the past
Global breakdown of CO2 emissions
The Kaya equation provides a framework for understanding pastCO2 energy emissions. The Global Carbon Project website provides data on population, GDP at purchasing power parity, energy consumption andCO2 emissions, at different scales and for several years.
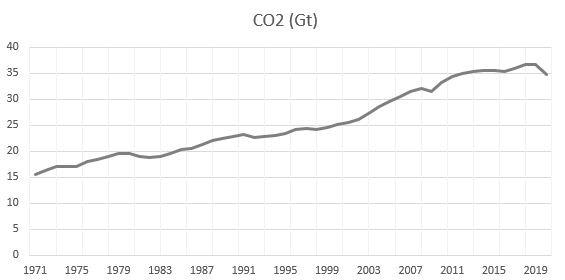
We can see that globalCO2 emissions have risen sharply over the last 50 years, from 15 Gt in 1971 to over 35 Gt in 2019. Let’s now look at the decomposition of these emissions on the factors of the Kaya equation.
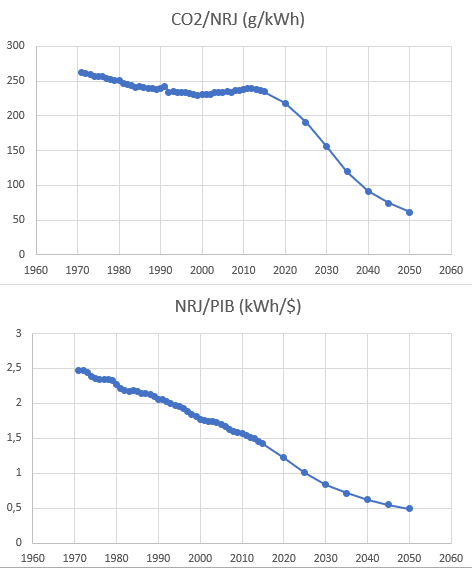
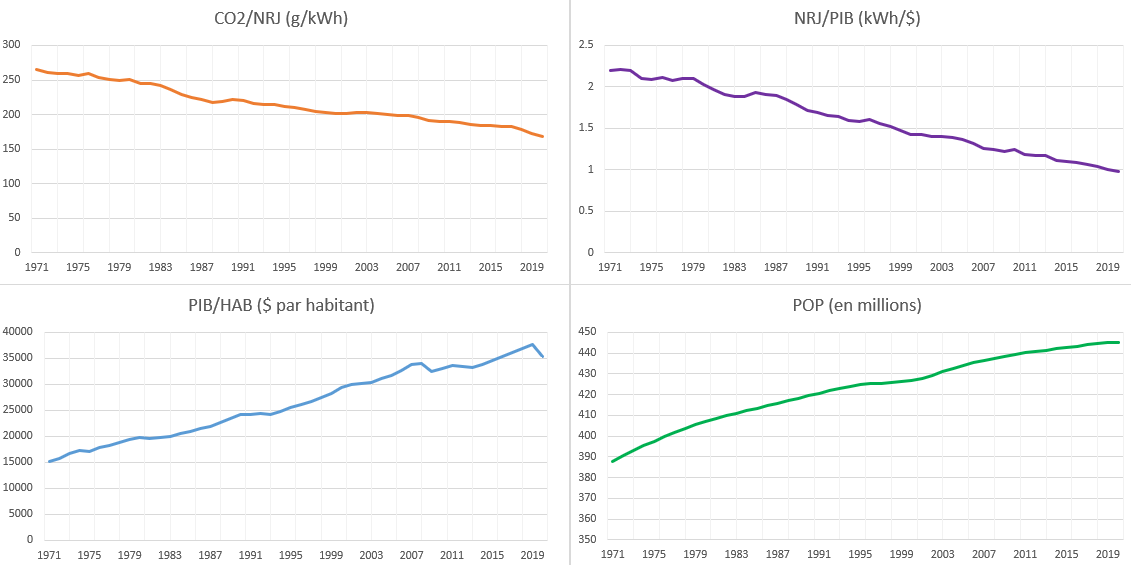
Carbon content of energy, energy intensity of GDP, GDP per capita and population worldwide
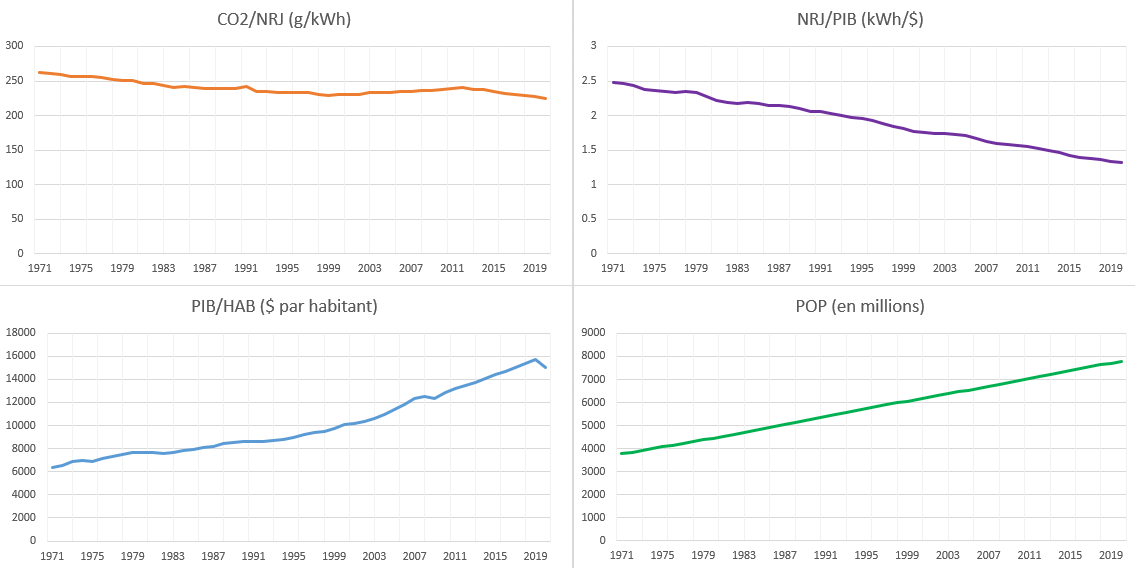
Source Global Carbon Project 2021
The carbon content of energy (CO2/NRJ) has fallen only slightly in 48 years, from 260g/kWh in 1971 to 230g/kWh today, a reduction of 11.5% in 50 years (equivalent to a 0.25% reduction per year).
The energy intensity of GDP, on the other hand, has fallen more rapidly, from 2.5 kWh/$ in 1971 to 1.3 kWh/$ in 2019, a 48% reduction (i.e. 1.3% per year), and in a relatively stable manner.
The population has risen from 3.7 billion in 1971 to 7.8 billion in 2019, an increase of 110% (or 1.5% per year).
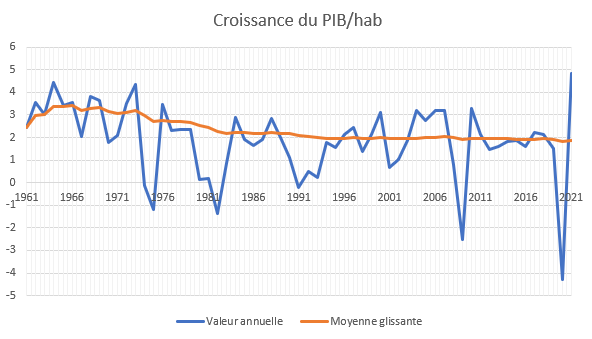
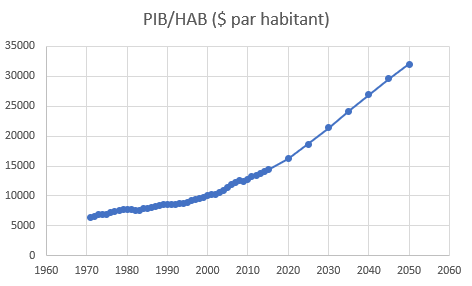
At the same time, GDP/POP increased by 137% over the period (or 1.8% per year).
Thus, the fall in GDP energy intensity, combined with a slight improvement in the carbon content of energy, has not been able to absorb the growth in population, GDP/POP and, ultimately, total GDP.
The factors in the Kaya equation have evolved at relatively low rates, and on a stable trajectory. This reflects the inertia of the economic system, and the difficulty of derailing certain variables.
Defining the carbon content of energy
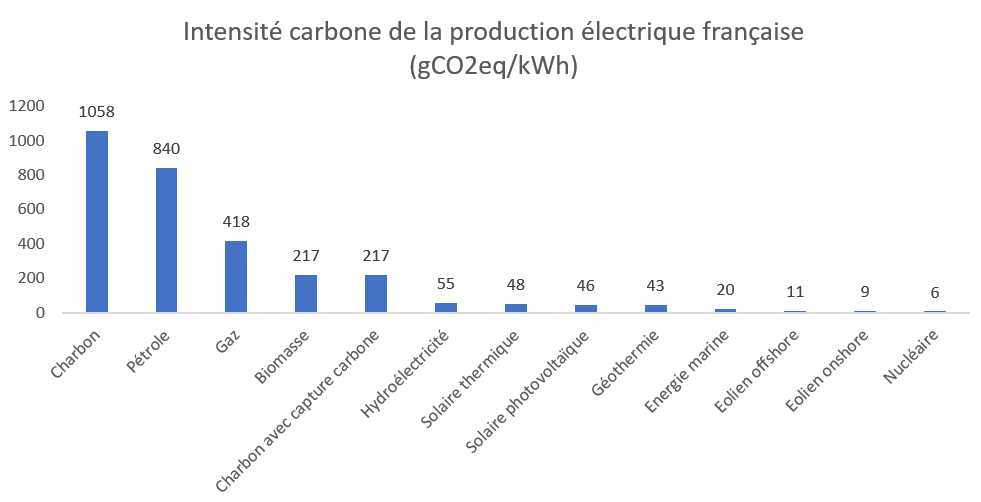
The first term in the Kaya equation is CO2/NRJ. This ratio is called the carbon content (or carbon intensity) of energy. It is the quantity of CO2 emitted for each unit of energy produced. It varies according to the energy sources used.
Strictly speaking, only fossil fuels (coal, oil, gas) emit CO2 when they are burned.
However, when we consider the entire energy production/consumption cycle, all energy sources today generate emissions.
The energy we use every day to move around, heat our homes, light our homes, power our machines and cook our food is not directly available in nature. Before they reach us, so-called primary energy sources have to be extracted from underground (oil, gas, coal, uranium, wood) or from living organisms (wood), or captured in nature (the energy of the wind, the sun, the force of gravity, the tides), then transformed into usable energy (heat, electricity, gasoline, fuel oil, etc.), and finally transported to end users. This is known as final energy.
When we measure the carbon content of energy, we take into account the entire life cycle, including the upstream stages: extraction (for fuels), transport, processing (treatment, refining, transformation of primary energy) and finally distribution to the end consumer. Where applicable, emissions generated by the construction (and dismantling) of production facilities must also be taken into account. This is particularly the case for electricity, with the construction of power plants (gas-fired, coal-fired, nuclear) or solar panels, wind turbines and so on. Finally, for fossil fuels (oil, gas, coal), emissions generated by their combustion during use by consumers or to produce other energy sources (electricity in particular) must also be taken into account.
The energy mix is the distribution of our energy consumption across different sources. 5 . Today, oil, coal and gas account for over 80% of the world’s primary energy consumption.
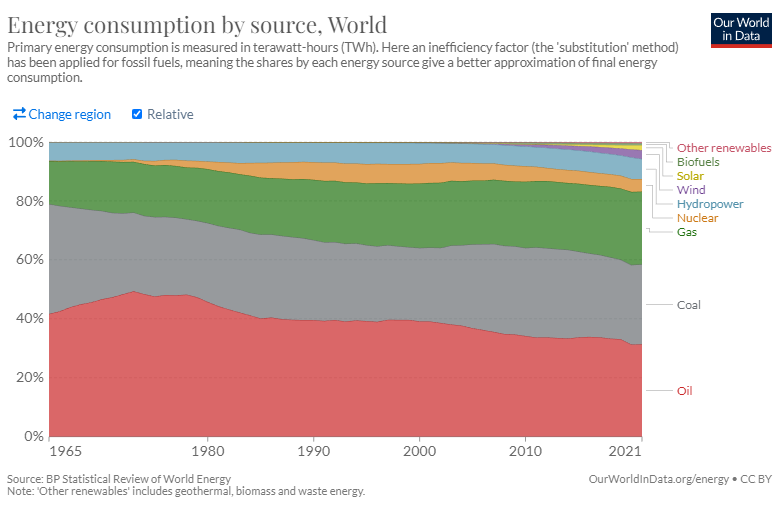
By multiplying the consumption share of each energy source with its carbon content, we obtain the average carbon content of an energy mix (hence theCO2/NRJ term in the equation). This can be reduced either by developing technologies to limit the carbon content of the predominant energy sources, while maintaining a constant energy mix. 4 or by increasing the share of already low-carbon energies in our mix.
However, choosing a more “virtuous” mix largely depends on the total amount of energy you want to have. Indeed, low-carbon energies have limited potential by 2050: there is a “scarcity of green energy”. Nuclear power’s potential is limited by the industry’s ability to build new reactors, and hydropower’s potential is almost exhausted in several countries. 3 . If we only consumed a tenth of our total energy consumption, dams would suffice and our mix would be low-carbon without too much effort. Conversely, decarbonizing the energy mix while increasing total primary energy consumption is a doubly complex task. The greater the amount of energy consumed, the more difficult it is to decarbonize.
Definition of energy intensity
The 2nd term in Kaya’s equation is NRJ/GDP, which represents energy intensity, i.e. the amount of energy that needs to be produced to obtain one monetary unit. Today’s economy needs energy to produce goods and provide services. This energy is used to transform raw materials, initiate chemical reactions and transport objects and people over long distances, all of which are inseparable from the creation of wealth.
As for the average carbon content of energy, which can be obtained by multiplying the carbon content of each type of energy by its share in the energy mix, overall energy intensity could be obtained by multiplying the energy intensity of each economic sector by its weight in the economy, which reveals 2 ways of making GDP proportionally more energy-efficient: improving the energy intensity of the dominant sectors, or giving priority to less energy-intensive sectors in our economy.
Firstly, some sectors are intrinsically more energy-intensive than others: the chemical, paper and metal industries require a lot of energy for every euro “produced”, while services and electronics require little. Generally speaking, the greater the proportion of human labor compared to the use of machines, the less energy the service or good produced will consume. It is therefore possible to influence the energy intensity of an economy by prioritizing certain sectors over others, and more particularly by promoting sectors that are intensive in “human time”.
Secondly, within the same sector, we can also play on the energy efficiency of associated goods or services. Numerous policies exist to promote energy-efficient products, such as the obligation to inform consumers via energy labels on household appliances, or the obligation to communicate the DPE (Diagnostic de Performance Energétique 2 ) for housing. Economic players also have an interest in improving the energy efficiency of their processes and the goods they sell, since greater efficiency means lower energy costs for the company. The aeronautics industry, for example, has succeeded in multiplying the energy efficiency of its aircraft by 2 since 1970.
Finally, we can also improve the energy intensity of GDP through a form of sobriety, by limiting energy consumption in activities that have little correlation with the measurement of GDP. For example, reducing the set temperature for home heating or lowering the speed limit on freeways to 110 km/h will consume much less energy, with a limited impact on GDP.
Definition of GDP per capita
GDP is a measure of an economy’s new output over the course of a year. It is a symbolic indicator (it enables powers to be compared with each other), which serves as a benchmark (a country’s spending is often compared with its GDP), which is operational (international funds are often distributed in proportion to GDP), and political (GDP is used to control public spending).
GDP per capita measures a country’s standard of living and estimates average household consumption over the course of a year. Its growth is often sought by public policy-makers, not least because higher GDP per capita is identified with “social well-being”, which is debatable above a certain level (see our module on GDP).
One way of lowering GDP per capita is to opt for sobriety, i.e. to consciously choose to stop part of our production or consumption in order to limit the impact on the well-being of our inhabitants. For example, we could choose to ban the production of cars weighing more than 3 tonnes: this would cut directly into GDP, without greatly reducing the comfort of life for the population, who could always switch to lighter cars. In this case, however, it is important to prevent the “car” budget saved by a household buying a smaller car from being transferred to other goods and services. We’ll talk about this “rebound effect” below.
Population and demographics
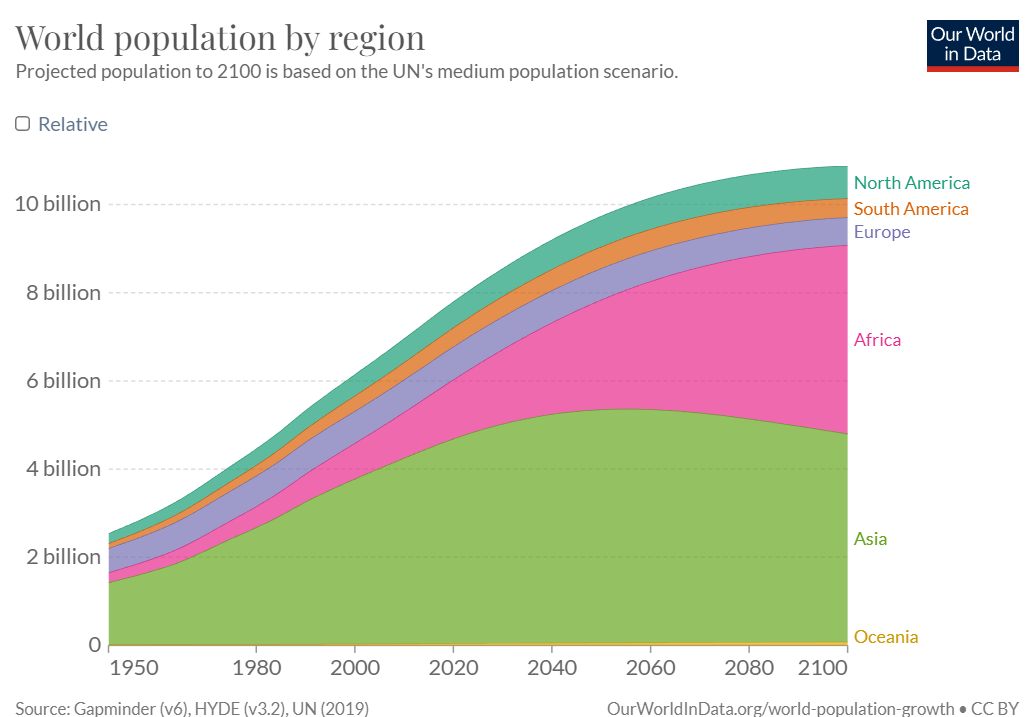
Humanity today numbers 7.7 billion people. Over the period 2015-2020, there were an average of 140 million births and 57 million deaths per year (according to World Population Prospects 2019). The net demographic balance is therefore around 80 million per year. By way of comparison, Covid-19 has directly killed fewer than 3 million people a year since its appearance in February 2020 , according to the WHO.
Demographics is highly inertial, and its evolution is virtually fixed for the next 30 years, so we can only marginally control it. According to the UN, there will be almost 10 billion of us by 2050.
This last parameter is the only extensive one. The Kaya equation breaks downCO2 emissions into intensive parameters (energy intensity of GDP, carbon content of energy and GDP per capita) and an extensive parameter: population. We therefore makeCO2 energy emissions depend directly on population size, modulating our social choices and our potential for technological progress.
What Kaya tells us about the future
How to limit global warming to 2°C
To stay below 2°C global warming, the IPCC tells us that we need to reduce our GHG emissions by around 5% a year until 2050, i.e. a total division by 4.
At the same time, the UN estimates that the world’s population will grow by around 0.7% a year to reach 10 billion by 2050, a total increase of 25%.
GDP/POP has been growing at around 2% a year for the past few years, excluding periods of crisis (overpricing or covid-19). Let’s assume that this trend continues: over the 28 years to 2050, that would be an increase of 74%.
At this point, the left-hand side of the Kaya equation increases by 5% per year, while the right-hand side increases by 2.71%. We therefore need aCO2/GDP reduction of 7.5% per year to achieve this. Dividing this target equally between the carbon content of energy (CO2/NRJ) and the energy intensity of GDP (NRJ/GDP), we need to reduce these terms by 3.8% each, every year.
As a reminder, we have succeeded in reducing the energy intensity of GDP by 1.3% per year over the last 50 years, and carbon content by 0.25%. Going from 1.3% to 3.8% (and a fortiori from 0.25% to 3.8%) is a very ambitious goal, and requires a significant change of pace.
If we can’t, we have a choice: face up to the disastrous consequences of climate disruption, or play on other factors (since nobody wants to organize genocide and demographics are highly inertial, all that’s left is GDP per capita).
By refusing to abandon GDP growth, we are implicitly betting that we will achieve a goal far removed from what we have been able to achieve over the last 50 years.
IEA scenarios
The International Energy Agency’s World Energy Outlook provides energy forecasts for the coming years. These are the world’s benchmark forecasts, providing a decarbonization pathway to 2050. Energy-climate scenarios involve a large number of physical and socio-economic variables. Some of these variables are structuring, and must be given particular attention if we are to test the plausibility of a scenario.
International Energy Agency
The International Energy Agency(IEA) is an international organization founded by the OECD in 1974. It was created in response to the 1973 oil crisis, with the mission of securing, supervising and coordinating oil supplies. Today, the IEA provides analyses, forecasts and data on energy production and consumption. The IEA’s work increasingly integrates climate issues and the need for an energy transition.
The World Energy Outlook (WEO) is a family of scenarios published each year, and used as a reference throughout the world. The scenarios are built using the World Energy Model (WEM), which uses exogenous data (GDP, demographics, etc.) and calculates a balance of energy supply and demand to produce a projection of endogenous data (the share of renewable energies, total energy consumption, etc.). For the first time, WEO 2017 includes a “sustainable” scenario, with the constraint of limiting global warming to 2°C.
We can retrieve data from the World Energy Outlook scenario and compare it with historical data by breaking it down using the Kaya equation.
Historical and projected CO2 emissions according to the WEO scenario
Source World Energy Outlook and Global Carbon Project 2021 scenario data
The IEA scenario assumes a very rapid reduction inCO2 emissions, which represents a complete break with current trends. The IEA also assumes that GDP/POP will grow strongly. This wish, perhaps desirable, implies an extremely sharp reduction in the carbon content of GDP.
History and projections of GDP per capita according to the WEO scenario
Source World Energy Outlook and Global Carbon Project 2021 scenario data
This is reflected on the one hand in the carbon content of energy, which decreases in this scenario at a speed never seen before, and on the other hand in the energy intensity of GDP, which must decrease more sharply than it already does. These breaks in slope between what has been observed historically and what needs to happen to support “green growth” give this scenario a certain implausibility. The IEA’s case is not isolated: many other scenarios produced by various bodies assume strong GDP growth, as well as a drastic drop inCO2 emissions. Mathematically, this implies unverified assumptions about the speed of decarbonization of GDP, which have yet to be corroborated by history.
History and projections of the carbon content of energy and energy intensity according to the WEO scenario
Source World Energy Outlook and Global Carbon Project 2021 scenario data
Danger of relative metrics
Kaya’s equation has the merit of showing that we need to play on all the terms of the equation if we hope to reduceCO2 energy emissions. Decarbonizing our energy mix or improving the energy efficiency of industrial processes won’t save us if GDP continues to rise.
It is therefore dangerous to communicate only about relative decarbonization measures: the Earth doesn’t care about the percentage of renewable energies in our mix, what it cares about is the quantity of fossil fuels we consume and theCO2 emitted in return.
This relatively simple observation is frequently contradicted by the CSR communications of many companies. For example, Total’s “Sustainability & Climate Progress 2022 Report” states that the share of renewables in their energy sales will be 15% in 2030, up from 5% in 2020. At the same time, Total also forecasts an increase in oil and gas sales by 2030. The 2 pieces of information are not incompatible. However, the relative measure that is Total’s energy sales mix hides the physical reality: Total actually intends to sell more fossil fuels in 2030 than in 2020.
Kaya in various sectors
Kaya in transport
The Kaya equation has the advantage of being applicable to a particular sector, provided that the methodology is adapted to the specific features of the area under study.
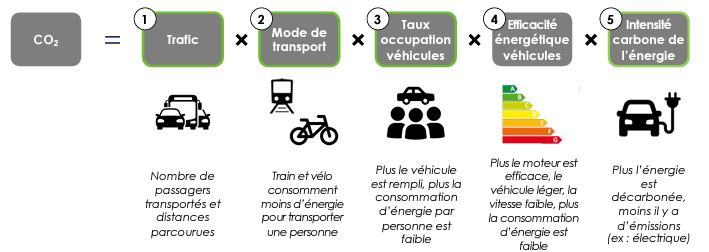
Without going into the details of the calculation, the Kaya equation for transport breaks down the sector’sCO2 emissions according to: total traffic, modes of transport (i.e. the distribution of demand on each mode of transport: car, airplane, bicycle, etc.), load factor (the number of passengers per vehicle), energy efficiency (the amount of energy consumed to move a weight over a distance), and energy carbon intensity (the mass ofCO2 emitted per quantity of energy consumed by each mode).
The advantage of this formulation is that it highlights the various levers that can be used to reduceCO2 emissions from transport, while being clear about the possible impacts of each. For example, an energy efficiency gain of 10% on a mode of transport that accounts for 80% of usage is far preferable to a gain of 50% on a mode of transport that accounts for only 5% of usage.
This breakdown also enables us to understand a posteriori what has structured the evolution ofCO2 emissions from transport, and therefore tells us where to act first.
Changes in transport emissions broken down by various factors
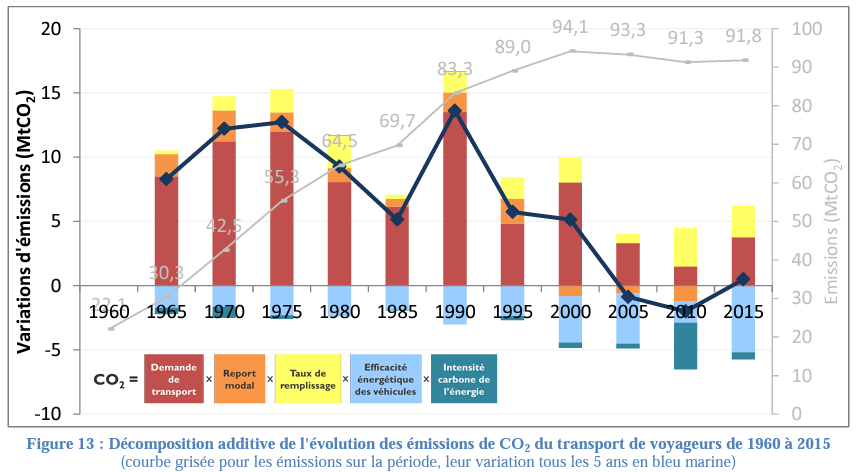
Source Les transports face au défi de la transition énergétique, thesis by Aurélien Bigo (2020)
Kaya in the home
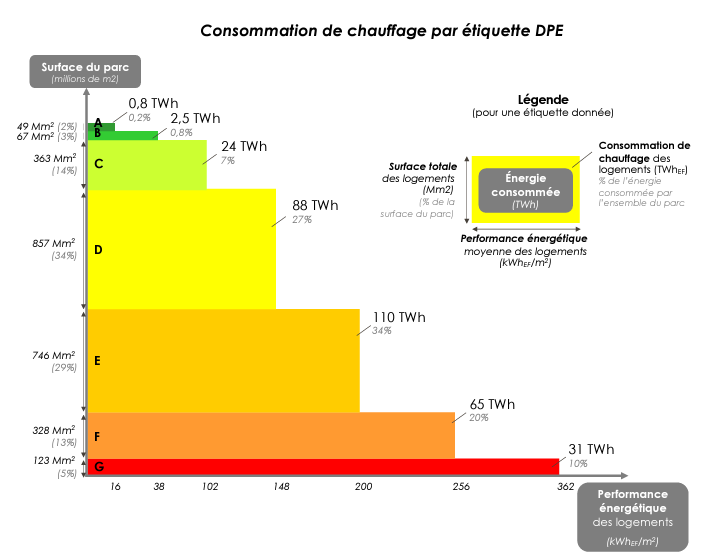
The housing sector can also be the subject of a “Kaya” approach. This breaks down heating-related emissions into the surface area to be heated, the amount of energy required per m² of surface area and the carbon intensity of the energy consumed. We could even go one step further and break down the energy performance of the home by insulation performance and the home’s set temperature.
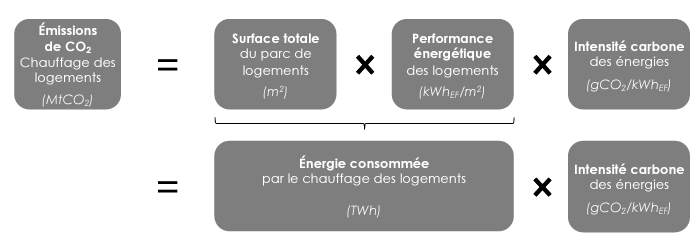
The amount of energy consumed, which is the product of surface area and energy performance, can also be represented by the DPE label. 2 . This representation clearly highlights the categories of homes that consume the most energy, either because they are poorly insulated, or because their energy class is strongly represented in the totality of homes.
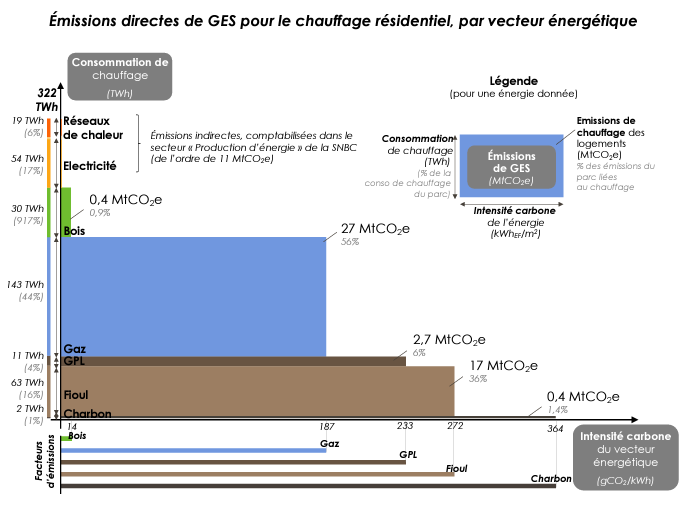
The same exercise can be carried out, this time directly representing total GHG emissions according to the type of energy vector used to heat the dwellings, and the total quantity of energy consumed per vector class (which therefore depends on energy performance weighted by surface area).
Find out more
On Kaya in the accommodation
Kaya in agriculture
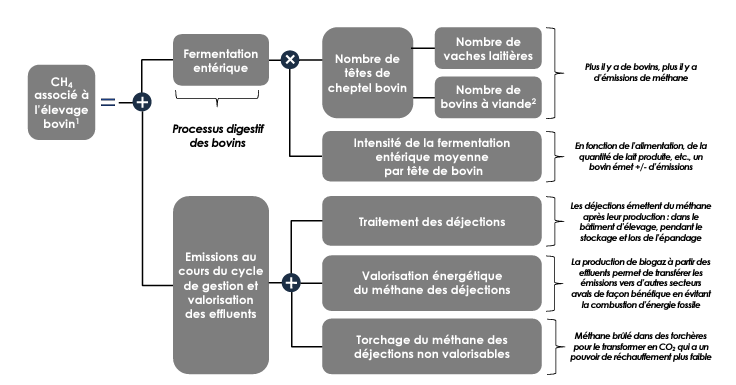
Breaking down methane emissions from agriculture using a “Kaya” approach is still possible, but a little less straightforward.
Bovine CH4 comes from different sources acting in parallel. Methane is emitted by the digestion of dairy and beef cattle, as well as by the storage and spreading of manure. We must also take into account methane that is “flared” (i.e. burned on the farm) and transformed intoCO2, and subtract methane produced and sold to other sectors that use it as biogas to replace fossil fuels.
Find out more
On Kaya in agriculture
Kaya’s limits
Factor dependence
The first limitation of Kaya is the apparent independence of the factors. The equation gives the impression of breaking downCO2 emissions into levers that can be controlled separately. However, this is absolutely not the case, and there are numerous counter-examples.
As we saw earlier, it’s not easy to hope to increase the total amount of energy consumed while keeping its carbon content constant, or even to reduce it. There is a scarcity of low-carbon energy, making it increasingly inaccessible as “easy” sources such as dams and existing nuclear power plants are exhausted.
As far as demographics are concerned, it’s mainly the rich who emit the mostCO2 today. Limiting demographics in developing countries will certainly reduce POP, but GDP/POP will increase by almost as much.
In France, for example, emissions per household vary by a factor of two depending on the decile of the standard of living. Households belonging to the poorest 10% emit less than 15t ofCO2 per year, while those belonging to the richest 10% emit 32t per year.
Average French household emissions by income decile
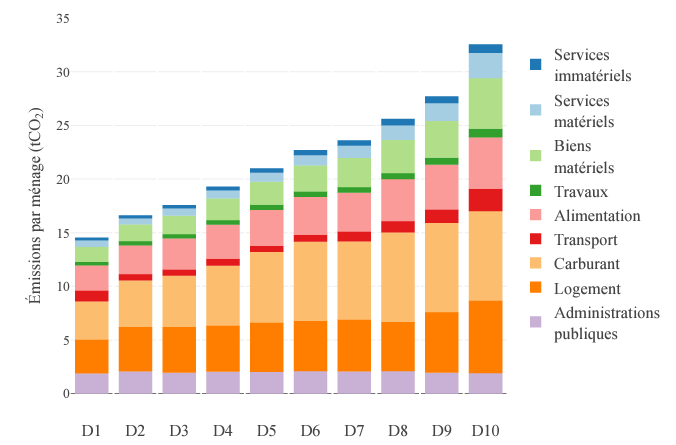
Source Who emits CO2? A critical overview of ecological inequalities in France, OFCE Review (2020)
Finally, improving the energy intensity of GDP can lead to a rebound in GDP, the so-called rebound effect. This occurs when energy consumption gains are less than proportional to individual efficiency gains. For example, light bulbs have steadily consumed less energy for each lumen product 1 . However, this energy efficiency gain has made it possible for light bulbs to be used in all households, for public lighting to be used, and for people to leave a room without turning off the lights. We’ll explain the rebound effect in more detail in another section, but it’s important to remember that improving the energy efficiency of our industrial processes won’t necessarily lead to a reduction in their energy consumption. Similarly, if legislation imposes a tax or quota onCO2 emissions, the reduction in the carbon content of energy may well lead to a rebound in total energy consumption.
Pay attention to the scope of analysis
The Kaya equation can also be applied to a limited geographical area.CO2, GDP, NRJ and POP data for various countries are available here. This allows us to break down EuropeanCO2 emissions using Kaya factors.
Europe’sCO2 energy emissions have been falling over the past twenty years, from just over 3.5 Gt in 2000 to almost 3 Gt in 2018.
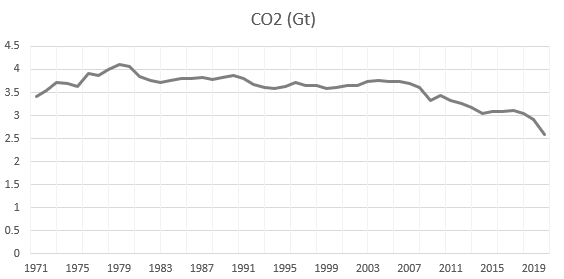
This decrease is explained by the fall in the carbon content of energy, from 200g/kWh in 2000 to 170g/kWh in 2018, but above all by the fall in the energy intensity of European GDP, from 1.5 kWh/$ to just 1 kWh/$.
Conversely, demographics, which are still on the rise, and growth in GDP per capita have slowed the decline in carbon emissions.
Carbon content of energy, energy intensity of GDP, GDP per capita and population of Europe
Source Global Carbon Project 2021
The European case is certainly encouraging, but it does not prove that it is possible to combineCO2 emissions reduction and GDP growth. Firstly,CO2 emissions are still far too high to limit climate change. But above all, the fall in the energy intensity of GDP is partly explained by the gradual relocation of energy-consuming and polluting industrial activities outside Europe. Our situation has improved to the detriment of others. China, India and Brazil, for example, have much higher energy intensities than Europe.
It provides a political vision
In the end, it’s just an equation, but one that provides a political vision.
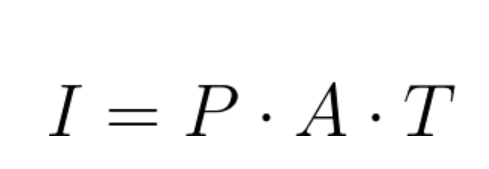
IPAT is another equation that probably inspired Kaya, but it extends to all forms of environmental damage: Impact = Population * Affluence * Technology. “Affluence” is wealth per person, and “Technology” is the damage caused by the manufacture of a unit of wealth (in Kaya’s case, this is the product of energy efficiency and the carbon content of energy, i.e. the carbon content of GDP).
The problem, according to Donella Meadows in this short article, is that the equation assigns blame for environmental impact: developing countries that can’t control their demographics (via P), Western countries that consume without limit (via A) and producer countries that turn to coal (via T). However, in her view, there’s nothing to say that these are the right culprits: consumption, technology and demographics don’t evolve magically. There are players who influence them and profit from them.
Kaya’s equation is just one vision, one way of looking atCO2 energy emissions. It doesn’t show the consumption of the rich and the primary needs, nor the private jet journeys and work trips, nor the luxurious villas and gas-heated council flats.
Find out more
On the Kaya equation
- The lumen is a unit of the international system for measuring luminous flux in a solid angle: it’s a kind of quantity of light. ↩︎
- The Energy Performance Diagnostic (DPE) provides information on the energy performance of a dwelling or building (with labels ranging from A for the most insulating to G for the least insulating), assessing its energy consumption and its impact in terms of greenhouse gas emissions. The DPE must be presented at the time of sale or rental of housing and tertiary buildings. From 2025 (class G), 2028 (class F) and 2034 (class E) respectively, it will be forbidden to rent out housing classified as G, F and E, colloquially known as “heatwasters”. Since 2022, class F and G homes have also been subject to a rent freeze. ↩︎
- France exploits 90% of its economically viable hydraulic potential, see https://assets.rte-france.com/prod/public/2021-03/Bilan electrique 2020_0.pdf ↩︎
- CO2 capture and storage is often put forward as an essential solution (it is taken into consideration in scenarios compatible with the Paris Agreement). However, this technology is not yet deployed on an industrial scale for the volumes envisaged. ↩︎
- It’s important not to confuse the energy mix (which covers all energy sources) with the electricity mix (which covers only those energy sources used to generate electricity). ↩︎