
This text has been translated by a machine and has not been reviewed by a human yet. Apologies for any errors or approximations – do not hesitate to send us a message if you spot some!
Introduction
For decades, GDP growth, the flagship indicator derived from national accounting, has been at the heart of discourse on the progress of our societies and economic policy objectives. After the Covid crisis in 2020 (as after any crisis, indeed any war), the “resumption” of this growth was celebrated like the messiah.
However, we will see here that neither GDP nor its continued growth allow us to take into account planetary limits and social justice. 1 . We will also see that the construction of GDP raises methodological questions of a magnitude and importance that are generally underestimated. Finally, we’ll see that the driving forces behind macroeconomic dynamics (even for economists who regard economic growth as a central objective of economic policy) are still not well understood. 2 .
The question of growth obviously arises in very different terms depending on the stage of economic development. There is little doubt 3 that for “poor” countries, economic growth can be both socially and economically beneficial. It enables children and women to pursue a minimum level of education and become self-sufficient. It is a recognized condition for demographic transition. It is also the means to ensure a minimum level of medical and energy infrastructure.
Understanding the driving forces and limits of growth would be useful for countries that are going to bear the full brunt of the consequences of ecological crises. It would also be useful for the European Union and Japan, which seem to be mired (for almost 30 years in the case of Japan, and 10 years in the case of Europe) in a latent recession, rendering them incapable of launching a truly serious “green new deal”-type program, while anticipating a post-growth world where GDP will no longer be the appropriate indicator for assessing our economies.
Definitions
The aim of national accounting (NA) is to provide a global, quantified representation of the main dimensions of a country’s economy. The CN framework in force provides precise definitions of the main economic concepts and methods for calculating aggregates. 4 that characterize a national economy. Production, consumption, investment, GDP, unemployment, public debt, foreign debt, national wealth: all the figures that fuel political, economic and media discourse and public debate are derived from NC. At international level, the accounting framework currently in force is the 2008 SNA (System of National Accounts). In Europe, the ESA 2010 (European System of Accounts) applies.
Gross domestic product (GDP) measures the aggregate value added produced within the national economy, i.e. the total value of the production of goods and services minus intermediate consumption (goods and services transformed or entirely consumed during the production process). This indicator is therefore intended to measure the new value created through the productive activity of a national economy. InEssentiel 3, we’ll look at how GDP is calculated in detail, and how it can be interpreted in a number of different ways, which also makes it interesting.
Growth (or economic growth, or GDP growth)
GDP is published in value or current prices (i.e. nominal GDP) and in volume or constant prices (i.e. nominal GDP minus inflation). GDP growth refers to the change in GDP volume from one year to the next.
GDP per capita
To compare the economies of different countries, we use GDP by value (or by volume) as well as GDP per capita. It’s obvious that between a very large country (like the USA) and a small one (like Luxembourg), the level of GDP alone says nothing about the standard of living of the inhabitants. To be even more accurate, we evaluate GDP per capita in “purchasing power parity”, i.e., taking into account what incomes can buy.
This module benefited from the proofreading and comments of Didier Blanchet and Simon Chazel (the latter having also co-authored
Essentiel 8 on macroeconomic models
). Find here
the list of all TOE contributors
.
The essentials
GDP and its growth are central indicators of economic discourse and policy.
GDP is a measure of new production in a national economy over the course of a year.
This indicator, which came to prominence after the Second World War, still plays a major role in the orientation and evaluation of public policy. GDP and its growth are seen as the manifestation of the power of states, as a measure of the standard of living of their inhabitants, and as a sine qua non for achieving most public policy objectives (combating unemployment, financing social spending, ecological transition).
National accounting was born out of the great crises of the first half of the 20th century.
While the first attempts to estimate national income date back to the end of the 17th century, it wasn’t until the 1930s that national accounting really began to take off, in other words, the desire to provide a global, quantified representation of the main dimensions (production, income, employment, consumption, productive capital, debt, etc.) of a country’s economy.
The two world wars and the crisis of 1929 demonstrated to governments the importance of equipping themselves with tools for measuring the national economy.
The crisis of 1929 was an important moment in the development of GDP.
On the one hand, it calls into question the then-dominant view in economics that supply creates its own demand, and that public intervention should be kept to a minimum to ensure that the economy functions at its best. Not only were crises possible, but state intervention appeared necessary to overcome them. Inspired by the ideas of economist J.M. Keynes, the New Deal launched by U.S. President Franklin D. Roosevelt in 1933 was designed to boost the economy by increasing aggregate demand through public spending (public works, public employment, social spending).
On the other hand, the crisis of 1929 highlighted the inadequacy of the statistical apparatus available to public players. If government intervention in the economy was no longer taboo, it still needed to have the elements to guide and evaluate its actions. It was to meet this need that Simon Kuznets commissioned the U.S. Senate to produce a report on the evolution of National Income from 1929 to 1932. 5 . This work constituted the first (rough) calculation of an indicator approaching GDP.
The production base, a determining factor in power
The two world wars highlighted the importance of mobilizing a country’s productive base to sustain the war effort and win the war. This heightened the interest of work aimed at strengthening statistical tools. During the First World War, the first national accounts were drawn up in various countries 6 . Following the Bretton Woods conference in 1944, GDP became the reference indicator for measuring and comparing the size of economies.
The post-war period saw a deepening of this statistical and accounting production dynamic to accompany the reconstruction of Europe and, in the United States, the reorientation of war production towards peacetime goods and services, as well as their disposal. The Thirty Glorious Years, marked by strong growth, full employment and rising living standards, validated economic growth in the collective imagination as an instrument of social progress.
National accounting developed in parallel in various countries before being standardized internationally with the adoption of the 1993 System of National Accounts.
7
(which will be updated once to give the 2008 SNA).
The SNA is a highly detailed nomenclature that explains all the definitions, rules and conventions used to draw up a country’s national accounts and major economic aggregates. It applies to every country in the world, although certain countries and zones may adapt it to suit local conditions. In the European Union, for example, the European System of Accounts(ESA 2010) applies.
One of the great strengths of GDP, and of national accounting in general, lies in this universalism of standards and conventions, which makes comparisons over time and between countries possible.
This brief history shows the extent to which the development of national accounting (and its central indicator, GDP) is the result of the dramatic events of the first half of the 20th century. GDP, as an indicator, came into being because it was felt necessary to measure production in detail in order to emerge from the crisis and support the war effort, followed by reconstruction. Such concerns have not disappeared today.
“Alongside the mobilization of resources for the war economy, it was attempts to forge effective demand management as a way out of the economic slump caused by the financial crisis of 1929 that prompted the introduction of national accounting. The focus on GDP is therefore not simply a convention. It certainly stems from a singular historical trajectory, combining the experiences of the twentieth-century wars and the Great Depression. But these two sources derive from ever-present constraints: on the one hand, the balance of power within the “concert of nations”; on the other, the electoral weight of a policy to support employment. Continued growth is therefore partly a response to structural imperatives.
Nearly a century after its birth, GDP remains at the heart of economic discourse and policy.
In a 2013 study, the think tank The Shift Project ranked the different uses of GDP in order to assess the extent to which other indicators could replace it.
As can be seen in the box below, this classification gives the impression of an omnipresent “all-purpose” indicator, whatever the subject. It can be used to assess a country’s power (comparing countries according to their GDP in value terms) or wealth (comparing GDP per capita), to calibrate public policies (limiting public spending, setting environmental objectives, R&D targets), to draw up budget forecasts, or to calculate countries’ contributions to various international organizations.
GDP, an all-purpose indicator
Symbolic uses
GDP is used to create and share a common representation of a given concept (wealth, power, progress). These symbolic uses also manifest themselves in the desire to make it the standard of comparison for all economic data: education/GDP, health/GDP, investment/GDP.
Operational uses
GDP is used to trigger concrete action. For example: defining the contribution (and often the voting rights) of States to supranational budgets. 9 (European budget, IMF, World Bank); distributing international funds (European regional development funds or development aid distributed according to GDP/capita); drawing up budget forecasts (forecasts of GDP trends are used to estimate a level of budget revenue and therefore a spending capacity).
Political uses
GDP is used by national governments or supranational institutions to legislate or regulate (e.g. to control public spending). 10 setting targets for specific policies 11 ).
Source Les usages du PIB, The Shift Project, 2013
This multiplicity of uses of GDP clearly demonstrates the centrality of this indicator. Most heads of government see GDP growth as the primary objective of economic policy, and indeed of public policy in general. It is seen not only as a sign of a country’s power and wealth, but also of its ability to meet the many ecological and social challenges it faces.
In a nutshell, the reasoning behind this deeply-rooted belief is as follows: GDP growth would increase employment, purchasing power, investment capacity and innovation. These are all necessary conditions for improving well-being or collective well-being, and for solving ecological problems, thanks to science, technology and human ingenuity. These are clearly the arguments put forward by economists when talking about growth and ecology.
The need for growth to drive the ecological transition
First of all, it should be remembered that the vast majority of economists working on growth do not include the ecological question in their work (see the Economy, natural resources and pollution module).
Schumpeterians 12 believe that “green innovation” is the solution to the problem posed by the polluting nature of GDP growth. These supporters of “green growth” see it as the path to ecological transition, by enabling the necessary technical progress. We’ll come back to this inMisconception 6.
For the “socio-liberals”, growth means first and foremost more income, and therefore more resources to improve people’s lot and reduce social inequalities. The fight against climate change will not be possible without growth to compensate for the loss of income suffered by those who lose out as a result of the transition (which will eliminate jobs in activities dependent on fossil fuels).
For neo-Keynesians, reducing greenhouse gas emissions requires a great deal of investment, which in turn generates more growth, at least initially.
Despite growing recognition of the limits of GDP, it remains at the heart of policy objectives.
As we shall see inEssentials 5 and 6, GDP and the quest for its growth are the subject of much criticism: they are no guarantee of improved living conditions for populations, and growth is accompanied by massive environmental degradation.
Initially voiced by researchers and activists, the inadequacies of GDP as an indicator of a society’s good health are now widely recognized at institutional level, as demonstrated by European initiatives to go beyond GDP and place other objectives at the heart of public policy (see below). However, despite these positive developments, it has to be said that the objective of growth (now described as green, sustainable or inclusive) remains central.
The development of a “beyond GDP” strategy in the European Union
Institutional recognition of the limits of GDP began with research. In 2007, the European Commission launched the Beyond GDP initiative to develop “indicators that are as clear and attractive as GDP, but take greater account of the environmental and social aspects of progress”. In 2009, this led to the publication of the roadmap Beyond GDP: measuring progress in a changing world. 13 .
The same year saw the publication of the report by the Stiglitz, Sen and Fitoussi Commission on the measurement of economic performance and social progress, commissioned by the President of the French Republic. Composed of eminent economists, including several Nobel Prize winners, the commission’s work marked a milestone in the institutional recognition of GDP’s limitations, for while the criticisms were widely known, it was the first time they had been voiced by mainstream economists. The report’s recommendations on the measurement of well-being and sustainability will feed into the work of various European statistical bodies.
At the political level, the beginning of the 21st century is also marked by the increasing display of social and ecological objectives. This is the case, for example, with the EU 2020 strategy for smart, sustainable and inclusive growth, adopted in 2010 14 .
In its Conclusions of October 24, 2019, the Council of the European Union calls on the Member States and the Commission to “integrate concern for the welfare economy horizontally into national and Union policies, and place people and their well-being at the heart of policymaking.”
Taking office at the end of 2019, the Commission chaired by Ursula Van der Leyen is going one step further by making the Green Deal for Europe one of its six strategic priorities. In the wake of the COVID-19 pandemic, resilience 15 becomes “a new compass for EU policies.”
Despite these advances, growth remains the overriding objective
Thus, the rationale for including welfare economics in all public policies is that it “is of key importance for economic growth, productivity, long-term fiscal sustainability and social stability in the Union.” Theinfographic produced by the European Council to explain what welfare economics is shows the extent to which people’s well-being and economic growth remain intrinsically linked in official discourse.
The Green Pact for Europe is described by the Commission as a “new growth strategy” that “aims to transform the EU into a just and prosperous society, with a modern, resource-efficient and competitive economy, characterized by zero net greenhouse gas emissions by 2050, and in which economic growth is decoupled from resource use.”
Here is the trajectory presented by the Commission to achieve the climate neutrality objective at the heart of the Green Pact:
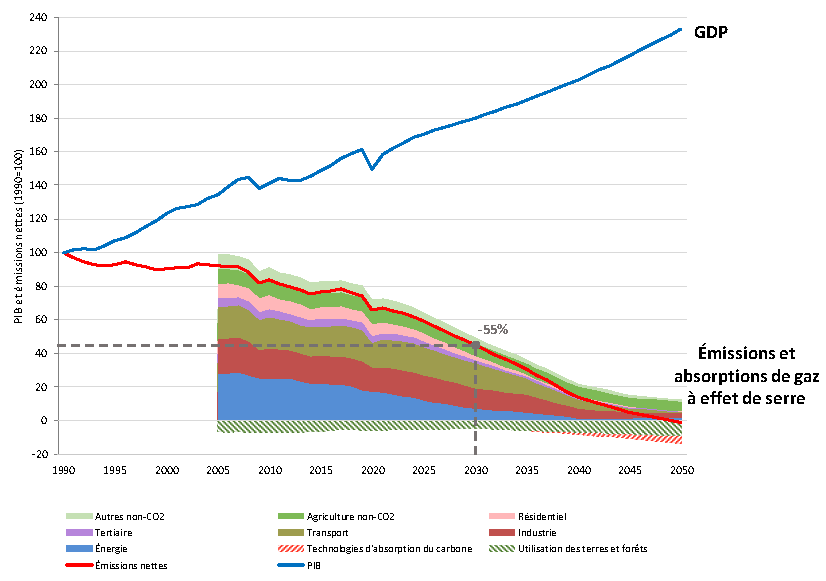
Source Stepping up Europe’s 2030 climate ambition – Investing in a climate-neutral future for the benefit of our people, Communication from the European Commission, COM/2020/562
As can be seen, GDP growth remains central to the analysis. The presence of such a graph in a document dedicated to climate policy illustrates the extent to which this objective is still perceived as at least equivalent to, if not a prerequisite for, the reduction of greenhouse gas emissions.
As a final example, in the Porto Declaration on social issues adopted on May 8, 2021, the Heads of State meeting within the European Council welcome “the fact that the European social partners have drawn up a joint proposal for an alternative set of indicators to measure economic, social and environmental progress, which would complement GDP as a measure of well-being at the service of inclusive and sustainable growth.” The legitimacy of alternative indicators is fully recognized, but growth remains the ultimate goal.
Find out more
- The uses of GDP, The Shift Project, 2013
- Antonin Pottier, “Will the new wealth indicators modify growth? Les limites de la critique du PIB”, Le Débat, 2018.
- Benjamin Brice, “Why are we so attached to growth?”, Blog Un autre cap, October 20, 2021.
- François Fourquet (ed.), Les comptes de la puissance: histoire de la comptabilité nationale et du plan, éditions Recherches, 1980.
European Union countries pursue austerity policies in the belief that they are “growth-oriented”.
While the objective of growth is common to most governments around the world, the policies designed to promote it can differ greatly from one country to another, depending on the prevailing economic thinking.
Keynesian policies versus structural reforms
During the “Trente Glorieuses”, Keynesian-inspired policies prevailed. These were based on the importance attached to aggregate demand and to the steering of the economy by the public authorities: strict control of the financial sector, wage enhancement and redistribution policies, stimulus via public spending (major works) in the event of an economic slowdown, proactive industrial strategies and so on.
Since the 1970s, neoliberal-inspired policies have become the norm. The aim is to “liberate” growth by acting on the supply side, by reducing regulations and constraints (particularly tax constraints) weighing on companies and investors, by deregulating financial markets, by implementing structural reforms concerning the cost, duration and organization of work, and by controlling public spending (which would weigh on companies’ costs and harm their competitiveness).
The European Union has gone the furthest in this direction: the economic principles involved in this type of policy have been enshrined at the heart of the European treaties, i.e. at the very top of the EU’s hierarchy of norms. 16
Potential GDP at the heart of European software
Since the Maastricht Treaty in 1992, European economic governance has revolved around two budgetary rules: member states’ public deficits must be below 3% of GDP, and their public debt must not exceed 60% of GDP.
These rules were then refined to take account of the fact that the public balance depends in part on the economic climate: an economic crisis can lead to a cyclical rise in the deficit (lower tax revenues, higher social spending, stimulus policies). As a result, European and national authorities have endeavored to calculate the structural public balance (i.e., the balance that would have been recorded if GDP had been at potential – see box), with the aim of achieving a balanced position.
Potential GDP
Potential GDP is an unobservable indicator designed to measure what a country’s GDP would be if production capacities (labor and productive capital) were fully utilized without generating inflation. Calculating potential GDP makes it possible to determine another unobservable indicator: the structural public balance.
Find out more with our fact sheet on potential GDP and structural deficit.
These considerations are not just theoretical or technical: they have a profound impact on European public policy, to ensure that each country’s economy reaches its maximum production potential.
The “right” public spending, the “right” economic policy measures, are those that bring our economy back into line with potential growth. The aim is to close the output gap, i.e. the gap between actual growth and potential growth.
From an economic point of view, it is indeed desirable to fully utilize the production factors of labor and physical capital (machines, factories). 17 . However, the methodologies used to calculate this gap are more than scientifically questionable (see the fact sheet on potential GDP and the natural deficit), as are the public policy measures put forward in European texts to reduce the output gap.
These are so-called “structural” reforms, essentially aimed at cutting public spending, making the labor market more flexible and promoting innovation. This is how the “lightening” of labor laws, the elimination of “rents”, the simplification of administrative procedures, the deconstruction of public services, etc. are justified. In short, the measures that have been at the heart of European leaders’ economic programs for decades.
Thinking they are pursuing growth policies, European governments are in fact pursuing austerity policies, which obviously pose major problems for investment in the ecological transition.
The calculation of GDP is based on a number of conventions
Here, we look at how GDP is calculated, detailing how each of the major institutional sectors (see box) contributes to its formation.
In particular, we will see that it is the result of numerous conventions, which are themselves interpreted by national accountants. This makes international comparisons far less straightforward than they might seem. We’ll also see just how informative an indicator GDP is, once you get down to the nitty-gritty of its breakdown.
Gross domestic product is the main aggregate measuring a country’s economic activity. It corresponds to the sum of gross value added newly created by the country’s resident economic units in a given year, valued at market prices.
It provides a measure of the new wealth created each year by the country’s productive system and enables international comparisons.
As the definition above illustrates, GDP is traditionally presented as a measure of a country’s productive activity. As we shall see, there are in fact three ways of calculating it: by production, by income and by expenditure. This is quite logical: the production of goods and services enables the distribution of income, which in turn is used to consume and invest.
The national economy and institutional sectors
In national accounting, the national economy is made up of all resident institutional units, i.e. the various economic agents with the capacity to hold goods and assets, incur debts, carry out economic activities and, in short, carry out economic transactions with other units.
A unit is said to be resident from the moment it carries out economic activities on the territory of the country for one year or more. This is not a criterion of nationality: an immigrant worker is part of the French national economy, but a Frenchman working abroad is not.
Institutional units are grouped into five main sectors: non-financial corporations, financial corporations, general government, households (this sector also includes sole proprietorships) and non-profit institutions serving households (NPIs).
Resident institutional units can maintain relations with non-resident units, which are grouped together in a 6th sector, that of the “rest of the world”.
Calculating GDP by production
GDP is not a measure of production in the strict sense, but of the value added (VA) generated by the various resident units of a national economy over the course of a year.
As its name suggests, VA is the value of production added to the national economy. To calculate it, it is therefore necessary to eliminate double-counting, i.e. goods and services sold by certain producers that are used in the production of other goods and services.
To calculate GDP you need :
- Add up the value of production (market, non-market or for own final use – see box) achieved by all producers over the course of a year.
- Then, to avoid double counting, subtract intermediate consumption (i.e. goods and services transformed or entirely consumed during the production process).
- Finally, to obtain GDP, we need to move from the base price (the price received by the producer) to the acquisition price (the price paid by final consumers). We therefore add taxes on products (taxes, such as VAT, paid by final consumers at the time of purchase) and subtract subsidies on products (subsidies paid to the producer to reduce the prices paid by final consumers).
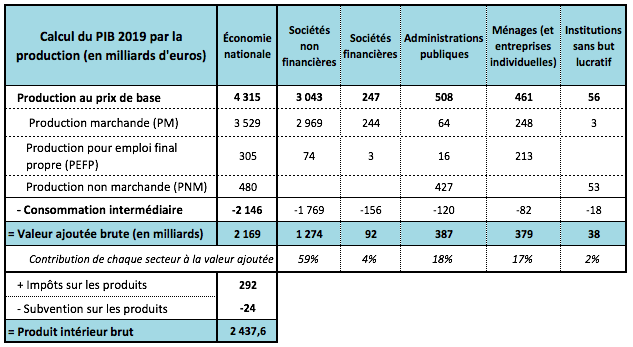
Source Comptes de la Nation 2020, Insee, Tableau économique d’ensemble 2019 (production account)
In 2019, France’s GDP totaled 2437.6 billion euros. Nearly 59% of value added was generated by non-financial companies, 18% by general government and 17% by households. It should be noted in passing that public spending does indeed represent a contribution to GDP, and not a deduction from it, as is often claimed.
Note that GDP can also be broken down not by institutional sector, but by branch of activity (agriculture, industry, services, etc.).
National accountants distinguish three types of production
Marketable production (MP) is sold or intended for sale on a market. It essentially comprises goods and services sold at an “economically significant” price (i.e. covering more than 50% of production costs) or included in producers’ inventories. 18 .
Non-market production (NMP) is provided free of charge (or at an “economically insignificant” price). It includes services that are not sold because they are indivisible (defense, police, public lighting, maintenance of natural areas) or because of political will (education, health, access to culture, etc.). It is essentially provided by public administrations.
Production for own final use (PEFP) is the production of goods and services for the producer’s own final consumption or investment. Only households produce PEFP for their own final consumption (agricultural products kept by farmers, housing services produced by owner-occupiers, domestic services resulting from the employment of paid staff). All sectors can generate FPEI for their own investment: research activities, software development, machine tool manufacturing, construction (including household housing), etc.). 19 .
How are production limits defined?
In SEC 2010 20 production is defined as “an activity carried out under the control, responsibility and management of an institutional unit which combines resources – labor, capital, goods and services – to manufacture goods or provide services. Production does not include natural processes without human intervention or control.” (p.58)
- The spontaneous growth of natural resources (fish in the ocean, primary forests, groundwater renewal, etc.) is therefore excluded from production. Conversely, the growth of fish in fish hatcheries, of farmed animals, of trees cultivated for their fruit or timber are all part of production. This explains why clear-cutting a primary forest or cultivating a nature reserve results in an increase in production (and is therefore counted positively in GDP).
- The unobserved economy 21 is theoretically part of production. For example, national accountants must try to include “underground” production 22 i.e. production not declared to avoid taxes (under-declaration of sales) or social security contributions (undeclared work), by making estimates based on indirect sources (such as tax adjustments). Certain illegal activities are also included in the production perimeter, as long as they are the subject of a “common agreement” (for example: theft is excluded, but the sale of stolen goods is included). The inclusion of drugs and prostitution has been the subject of much debate. 23
- Production also includes non-market activities and activities carried out for oneself (see box above). Here too, the limits of what is and what is not included in GDP are conventionally fixed. Thus, the production of goods (food, construction) by households for their own consumption is part of production. On the other hand, domestic services (cooking, cleaning, childcare, care of the sick and elderly) are not included in the calculation of production (unless they are performed by paid employees).
How is production value calculated?
While the value of market production is determined by selling prices, this is not the case for the other two types of production.
PEFP is “estimated on the basis of similar products sold on the market. This production therefore generates a net operating surplus or mixed income.” If there is no market price for similar products, PEFP “is valued at production costs, plus an amount corresponding to the expected net operating surplus or mixed income”. 24
The PNM is valued by summing production costs. 25 This method has been the subject of much debate among national accountants. 26 While it has the advantage of being based on measurable quantities, it remains largely conventional, and there could be other ways of evaluating it. For example, if, like the PEFP, the PNM included a producer’s margin (operating surplus or mixed income), its amount would be higher, which would lead to an increase in the GDP of countries in which public services play an important role.
Calculating GDP by demand (or by expenditure)
GDP can also be calculated as the sum of all final expenditure (i.e. excluding intermediate consumption) by resident units, plus the balance of trade in goods and services with the rest of the world.
This approach shows whether GDP is driven by final consumption or by investment. The trade balance shows the extent to which domestic demand depends on imports (if this balance is negative) or the extent to which foreign demand contributes to GDP (if this balance is positive).
For example, in 2019, final consumption accounted for around 77% of France’s GDP, and investment (GFCF – see box) for almost 23%.
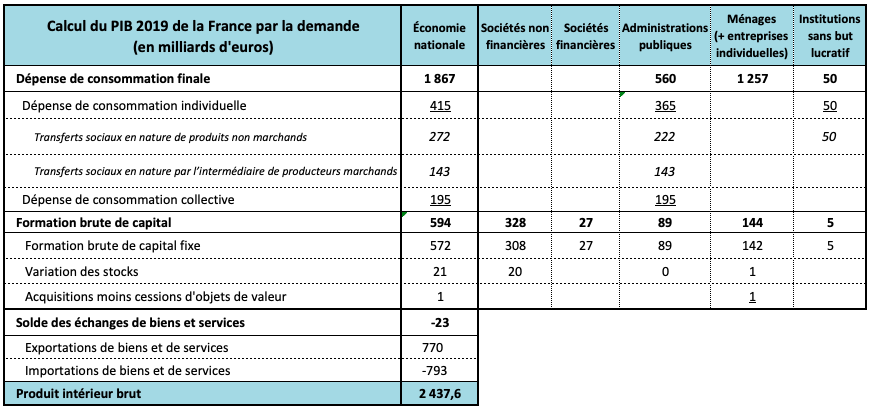
Source Comptes de la Nation 2020, Insee, Tableau économique d’ensemble 2019 (compte de d’utilisation du revenu et compte de capital)
Final consumption expenditure
It covers “expenditure by resident institutional units on the acquisition of goods or services that are used for the direct satisfaction of the individual or collective needs of the members of the community. ” 27
It is mainly generated by households, and includes all goods and services purchased (excluding housing, which is considered an investment) as well as those produced for own final use.
This approach to household final consumption is rather restrictive, as it excludes expenditure that benefits households but is borne by public administrations (education, health, culture, etc.) or non-profit institutions (see box).
Companies (financial and non-financial) have no final consumption expenditure. Their purchases of goods and services are used either for intermediate consumption (in which case they are excluded from GDP), for compensation of employees in kind (in which case they are charged to household final consumption), or for investment (see below).
Calculating general government final consumption expenditure
As we have seen, public administrations produce non-market services for the rest of society. As these services are not sold and therefore not acquired directly by other institutional units, national accountants initially consider that this non-market production (NMP) is consumed by the GGUs themselves.
We then obtain their final consumption expenditure by adding: i/ the value of the PNM 28 and ii/ the expenditure incurred by the APU with market producers to pay for goods and services provided to households (reimbursements for medicines, medical appliances, medical consultations, housing assistance, etc.).
It is then divided into two main categories:
– individual consumption expenditure covers spending for which the beneficiaries can be identified. This mainly concerns NPS for health and education services, as well as payments to market producers.
– collective consumption includes PNM, which benefits the entire community (defense, police, justice, general administration, etc.) and is therefore not individualizable.
The approach is the same for non-profit institutions: their PNM is allocated to their individual consumption expenditure.
Gross capital formation (GCF)
GFCF is obtained by adding gross fixed capital formation (GFCF), changes in inventories and acquisitions less disposals of valuables (jewelry, objets d’art, precious stones and metals held as a store of value).
Gross fixed capital formation (GFCF) is the name given to the productive investment made over the course of a year by the various economic players. It is made up of acquisitions 29 minus disposals of fixed assets (see box).
The different categories of fixed assets
Fixed assets are goods and services produced for use in production processes over the long term (more than one year).
They may be tangible (buildings, transport equipment, civil engineering works, machinery, information and communication technology (ICT) equipment, cultivated animal or plant biological resources) or intangible (software, research and development, intellectual property rights, acquisition of original recreational, artistic or cultural works). Durable goods acquired by households for their own consumption (household appliances, cars, TVs, IT equipment) are not included in GFCF but in final consumption. On the other hand, the acquisition of housing is counted in GFCF, as it enables households to produce “housing services” (via rental or own final use).
Source The list of fixed assets (and their evolution) can be consulted on the Insee website.
The boundary between investment (GFCF) and intermediate consumption is not set in stone
Intermediate consumption and investment both refer to goods and services used in the production process.
They differ in terms of time of use: in the first case, goods and services are entirely transformed or consumed during production; in the second, they are used over the long term.
As far as GDP is concerned, this distinction is of fundamental importance, since the value of intermediate consumption is deducted from production, whereas this is not the case for investment. However, the boundaries between these two concepts have evolved over time.
For example, the acquisition of military equipment 30 research & development services or software and databases was classified as intermediate consumption until 2014 (when the new European System of Accounts, ESA 2010, was implemented by the national accountants of European countries). Thereafter, these various items were classified under investment. This resulted, for example, in an increase in France’s GDP of around €46 billion in 2010. 31
GDP does not include consumption of fixed capital (wear and tear on machines, buildings and infrastructure).
GDP is supposed to measure value added, i.e. the new value created by production in a country. This is why the value of intermediate consumption is deducted.
By the same token, we should also deduct wear and tear on the stock of fixed capital (known as consumption of fixed capital – CCF). Machines, buildings and infrastructure deteriorate over time. Some equipment (especially ICT, software and databases) may become obsolete. All this represents a reduction in added value.
Consumption of fixed capital is, however, difficult to assess. Not all countries carry out this type of calculation, and those that do may use different methods. 32
It is therefore customary to use GDP as the key indicator, rather than NDP (net domestic product), even if the latter is also calculated by national accountants. 33 This means that the deterioration in fixed capital is not reflected, which is a problem, for example, when software and hardware purchases account for a large proportion of GFCF, as the lifetimes of these investments are short. GDP (which includes GFCF) can therefore grow faster than NIP, concealing the obsolescence of productive capital.
Calculating GDP by income
Finally, GDP can also be calculated as the sum of income distributed by producers during the production process.
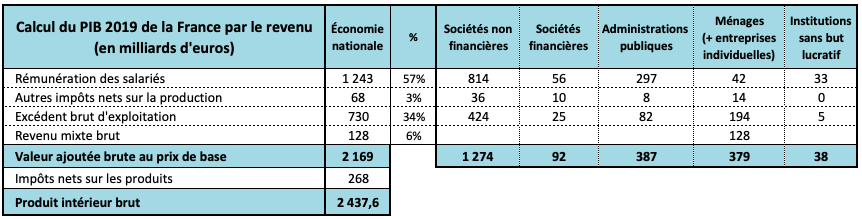
Source Comptes de la Nation 2020, Insee, Tableau économique d’ensemble 2019 (operating account)
The table above shows that income from employee compensation represented 1,243 billion euros in 2019, or 57% of value added. They were mainly paid to employees by non-financial companies (814 billion), then by general government (297 billion).
GDP is calculated by adding :
- Remuneration paid by producers to employees (including employer and employee social security contributions) ;
- Other net taxes on production 34 paid by producers to general government;
- Gross operating profit (EBITDA), which corresponds to what remains for the producer once direct production-related expenses have been paid (wages, net production-related taxes and intermediate consumption). It is an indicator of the profit that producers have made from their activity. It is obviously particularly important for non-financial companies (NFCs), since EBITDA is their main source of primary income, unlike households (where the main source is labor remuneration) or public administrations (where the main source is compulsory deductions). EBITDA enables NFCs to meet obligations that do not arise directly from production (paying interest on loans, paying corporate income tax), to invest and to pay dividends to their shareholders;
- Mixed income”, which corresponds to income from sole proprietorships 35 . It is said to be mixed because it includes, on the one hand (and for the most part) the remuneration of the self-employed work of sole proprietors and, on the other, the “normal” profit (EBITDA).
Don’t confuse GDP with National Income
GDP allows us to see which players are responsible for distributing income from production. However, it does not tell us what income is actually received by the various institutional sectors. For that, we need to look at gross national income. This measures the sum of primary income (from production and property) received by residents, whether this income is generated by the national economy or by the rest of the world.
To calculate it, you need :
- add to GDP income received from the rest of the world: this mainly concerns remuneration paid to resident employees by non-resident units, and property income (interest, dividends, etc.) paid to residents by non-resident units;
- subtract from GDP income paid to the rest of the world (remuneration and property income paid to non-residents).
Find out more
- Should we believe statistics? Very good video by Olivier Passet showing the conventional dimension of GDP.
- La comptabilité nationale, Jean-Paul Piriou, La Découverte, 2019
- Detailed statistics on the components of French GDP can be found in the Tableau économique d’ensemble (TEE) available each year in the Comptes de la Nation published by Insee.
- Statistics on the main components of GDP on Eurostat
Equating GDP with a country’s power or wealth is misleading.
What does GDP say about a country’s power?
As we said inEssentiel 1, wars were a powerful gas pedal in the creation of GDP and its affirmation as an indicator of a state’s power, or at least its ability to mobilize its productive resources to assert itself in the “concert of nations”. What is the situation today?
A simple analysis of the ranking of states by GDP shows that this indicator is insufficient to reflect political power.
Ranking of the world’s top 20 countries (+ the European Union) according to their 2020 GDP.
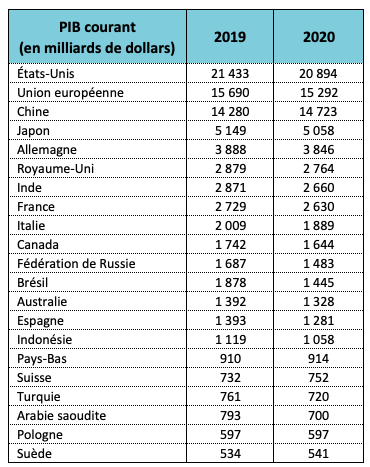
Consider the paradox of a geopolitically overpowered Russia, which in recent years has taken its revenge on the United States for the Cold War, but whose GDP is 50% lower than France’s (and whose per capita GDP is four times lower). Or, conversely, the European Union, which is still unable to influence the course of the world despite having a GDP equivalent to that of the United States and China.
Nor does GDP say anything about a country’s dependence on supplies from the rest of the world. This factor was particularly highlighted during the COVID-19 crisis, when globalized production chains were disrupted or even brought to a standstill, leading to disruptions in supplies of essential goods needed to respond to the pandemic (masks, paracetamol, test reagents, respiratory equipment, food production) or for the overall functioning of the economy (microchips).
The same applies to energy independence. It is invisible in GDP, even though we have known at least since the oil crises of the 1970s the extent to which energy is a determining factor in global production.
Finally, it’s important not to confuse a country’s economic power with the wealth of its inhabitants (measured by GDP, which we’ll see later is a very crude measure). The example of China is particularly enlightening in this respect. The world’s second-largest economy in terms of GDP, China has been enjoying growth rates that have Western leaders dreaming for decades. Does this mean that its inhabitants are among the richest on the planet? Certainly not. If we look at GDP per capita, in 2019 China ranked 79th if measured in constant dollars(see here) and 83rd in purchasing power parity(see here).
A country’s wealth is its heritage
As we saw inEssentiel 3, GDP is a measure of the value added generated in a given territory in a given year.
It is therefore first and foremost an indicator that measures a flow and not a stock of wealth.
It’s quite possible for a country’s GDP to grow year on year, then suddenly collapse because this growth was based on the exploitation of natural resources whose stocks have dried up. This is the well-known example of the island of Nauru after its phosphate mines were exhausted.
An individual’s wealth is not just his income, but also his assets (real estate and financial), his health, his knowledge, his know-how, his culture and the links he develops with others.
In the case of a country, heritage has many dimensions
Public assets are made up of financial assets and, above all, physical assets: infrastructure (water, electricity and telephone networks, roads and railways, ports and airports, etc.), community facilities, buildings housing public services (schools, hospitals, museums, barracks, etc.). Some of these assets, such as monuments and works of art, are not valued in monetary terms. Notre-Dame Cathedral in Paris is worth nothing, and neither is the Mona Lisa, until they are put up for sale (to pay off the public debt, for example!).
A country’s heritage also includes its private production system: industries, agriculture and services. To what extent does an economy produce the food, clothing, basic materials (paper, steel, cement, etc.), medicines, energy, machinery, furniture, IT equipment consumed by its inhabitants? To what extent does it depend on global supply chains? Is our productive system capable of producing goods and services of interest to other countries, and does it therefore give us the financial means to acquire what we don’t produce?
Wealth also includes the institutions that enable the economy and, more generally, life in society to function: a judicial system, a police force, an army, a health system, an education system, and so on.
Finally, a country’s wealth is based on the natural heritage (public and private) that will enable future production. A more or less artificial national territory, a more or less rich terrestrial and marine biodiversity, forests, water tables, mineral and energy resources, living or dead agricultural soils, nature reserves, coastal areas.
In short, we are bequeathing more or less significant natural resource potential.
None of this is reflected in GDP: our economic system has reduced the notion of wealth to a very narrow dimension!
GDP is not a good indicator of economic and social health
Omnipresent in public debate, GDP and its growth are often equated with a measure of an economy’s economic and social health.
Yet as early as 1934, Simon Kuznets, the architect of American national accounting and inventor of GDP, warned against its use as an indicator of well-being 37 . The limitations of GDP as a tool for diagnosing the state of a society have since been the subject of a great deal of research.
Comme le résume très bien l’économiste Eloi Laurent, “le PIB est trompeur quant au bien-être économique, aveugle au bien-être humain et muet sur la soutenabilité écologique. La croyance dans la croissance est soit une illusion soit une mystification.” Nous abordons ici les grandes lignes des critiques concernant l’économie et les aspects sociaux et dans l’Essentiel 6 les critiques en matière d’écologie.
What does GDP tell us about a country’s productive structure?
As an aggregate indicator, GDP provides little information on the structure of production. On the other hand, going into more detail about the data used to calculate GDP provides access to a wealth of information.
For example, it is possible to analyze the formation of value added by branch 38 (agriculture, industry, construction, market and non-market services) or by institutional sector (households, financial and non-financial companies, public administrations, etc.).
Does this dive into the details of GDP provide an accurate picture of the balance of power within the economy and the evolution of the productive structure? Nothing is less certain. As we shall see from the three examples below, GDP seems less and less well suited to describing the evolution of a country’s economy.
Financial companies
The following graph, for example, shows how little GDP reflects the rise of the financial industry since the 1970s. In France, the financial sector’s contribution to the French economy’s value added has hovered around 5% for 50 years, barely double that of associations. 39
GDP therefore completely fails to take into account the dizzying growth of the banking and financial sphere since the 1970s (see the Role and limits of finance module) and the growing power of these players over the productive sphere (see the Role and limits of finance module) and over public policy (see the Public debt and deficit module).
This situation is linked to the fact that the power of the financial industry is a consequence of the weight of financial assets, which is not reflected in GDP.
Institutional sectors’ share of value added in France from 1949 to 2020 (in %)
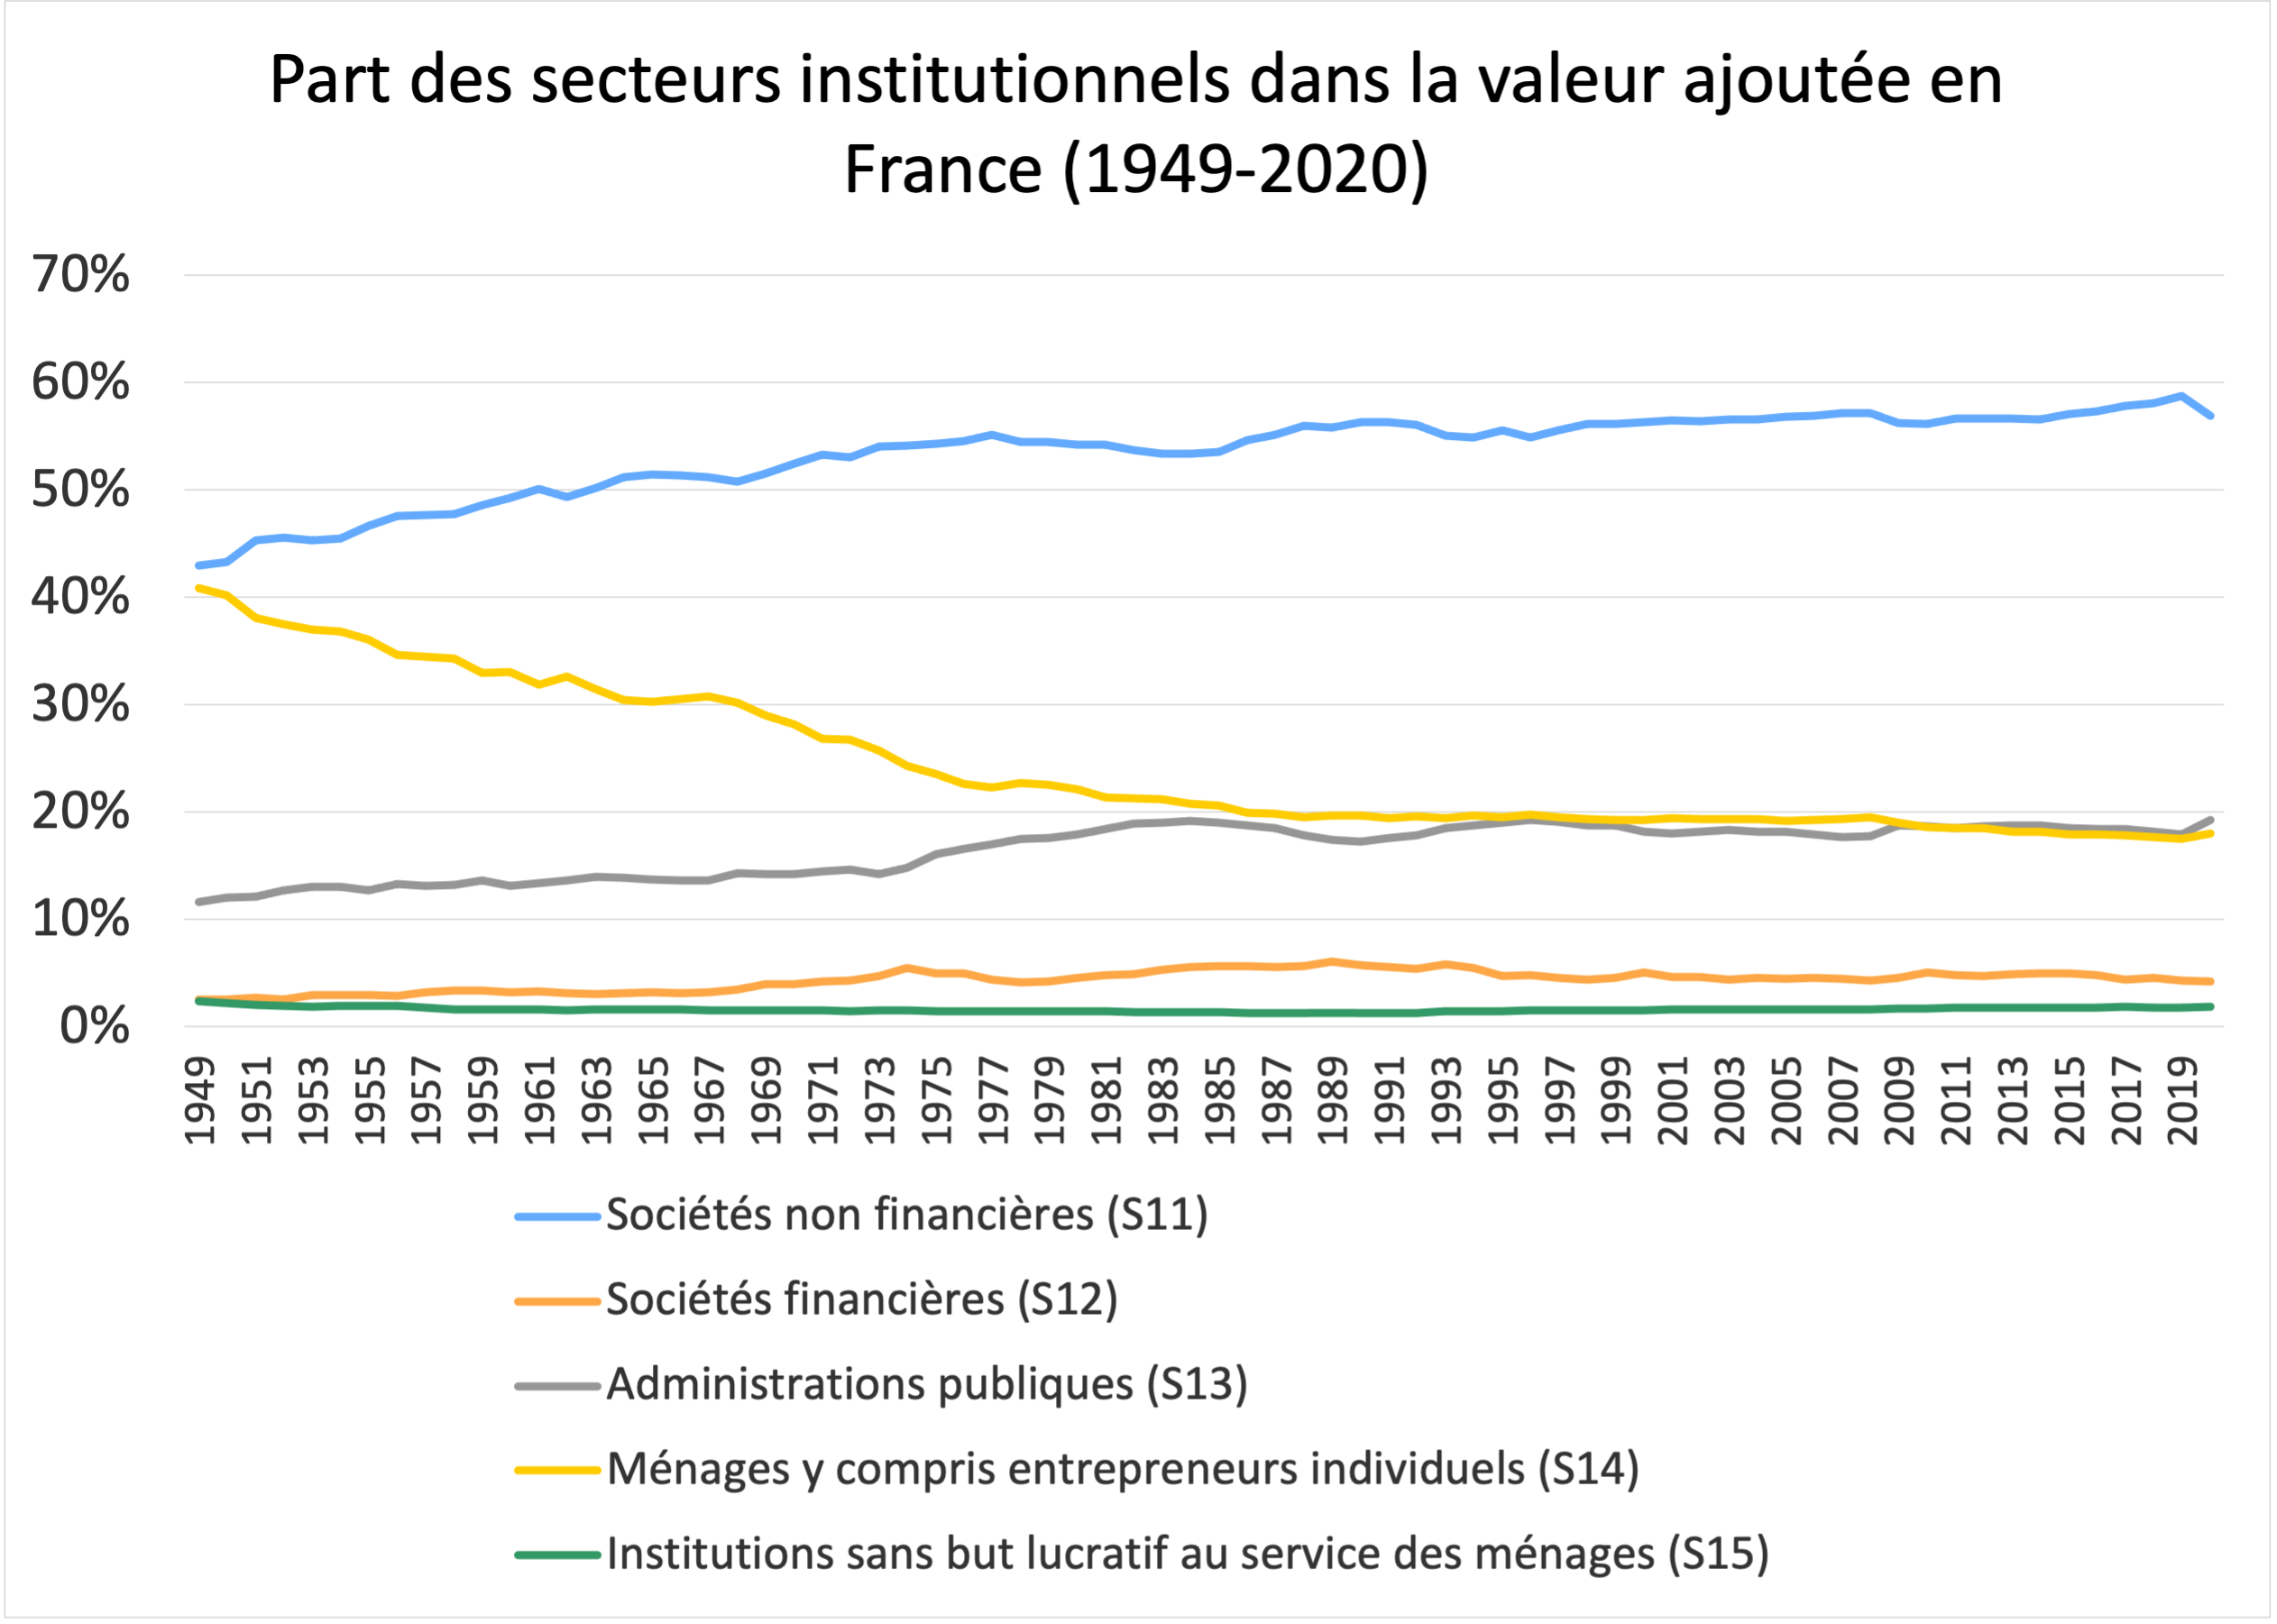
Source INSEE – National Accounts 2020 (Series 1.106)
The digital economy
The last decade has been marked by the emergence of the digital economy and its champions, the GAFAMs. 40 .
To date, the breakdown of GDP does not reflect this dynamic, as there is no “digital economy” branch in the national accounting classifications. The companies concerned are therefore classified in various other branches according to their main activity.
This situation is normal: statistical nomenclatures adapt with a certain time lag to changes in production structure. 41 . The current version of the System of National Accounts dates back to 2008, the year the first smartphone came out!
There are, however, a number of studies that attempt to assess the digital economy’s contribution to GDP. This is done, for example, by the Bureau of Economic Analysis in the United States.
GDP growth, growth of the digital economy and the digital economy’s share of GDP
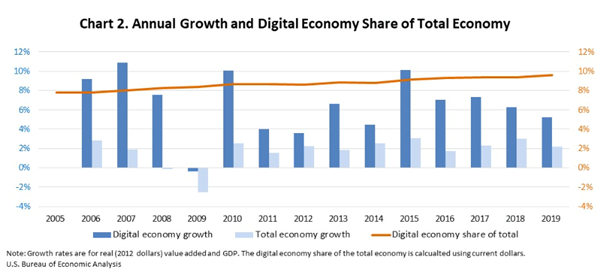
Source Updated Digital Economy Estimates, Bureau of Economic Analysis (June 2021)
According to calculations by the Bureau of Economic Analysis, the digital economy’s share of US GDP will have risen from just under 8% in 2005 to around 10% in 2019.
This work raises a number of methodological questions 42 that are far from being resolved. In particular, they come up against the fact that the power of digital companies, and in particular the GAFAMs, stems from a particular economic model: they provide “free” services, and in return capture and exploit the data of the users of these services. The primary source of revenue for Google or Facebook, for example, is advertising, whereas the real source of their power lies in their formidable capacity to capture data. This raises many questions that neither accounting nor GDP are able to answer today.
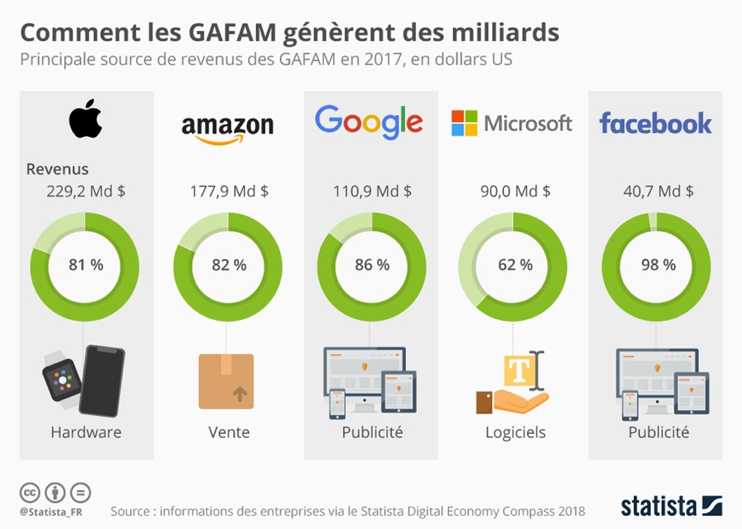
Source Les GAFAM, ces champions du numérique parfois compliqués à dompter, Cité de l’Economie (NB: in the above graph, revenue refers to sales).
The weight of multinationals
Finally, recent decades have been characterized by the emergence of multinationals. However, the national accounting system that has developed since the mid-20th century aims to track economic activity country by country, with GDP measuring production by resident units. 43 in each country.
As economist Jean-Paul Piriou clearly explains, this concept of residence “leads to neglecting the control exercised over certain resident units by resident units in other national economies. For national accounting purposes, IBM’s French subsidiary is part of the national economy (it is owned by IBM-USA, but its head office is in France), and Renault’s Spanish subsidiary belongs to the Spanish national economy. The residency criterion is therefore only partially realistic, as it does not allow for the integration of certain power relationships. Representing a national economy immediately makes it impossible to take into account the structuring of the global economy by transnational firms”. 44
Finally, the development of globalized value chains and the significant share of intangible assets (software, R&D, databases, brands) in production make it increasingly problematic to attribute production to a given territory. The example of Irish GDP is particularly enlightening on this point (see box below).
When Irish GDP surges, without associated production
“In July 2016, Ireland’s Central Statistics Office (CSO) revised the 2015 GDP growth rate sharply upwards, from 7% to 25.6% (CSO, 2016a). This upward revision was reflected neither in a similar revision of employment nor in physical capital accumulation. It is largely explained by the relocation, by a small number of large multinationals within their Irish legal units, of existing intangible assets (research and development, software, etc.), to the tune of 300 billion euros, rather than by the establishment of new production capacity.” This relocation was motivated by the particularly attractive tax conditions prevailing in Ireland.
In 2020, the problem persists. It’s the same type of phenomenon that gives the impression that Ireland has escaped recession, when in fact activity has been no more spared there than elsewhere in Europe. See Xerfi canal ‘s clear video on the subject.
Source Quote from L’énigme de la croissance du PIB irlandais en 2015 : tentatives de réponse, Économie et Statistiques, Insee, 2020
These various examples show the extent to which GDP seems less and less suited to fulfilling its original purpose: to measure the overall volume of a country’s production and to reflect the structure of production (by analyzing its components in terms of branches or institutional sectors).
For this reason, some national accountants 45 recommend moving from reporting GDP as an indicator of production to reporting GDP as a source of income (seeEssentiel 3). This would provide a clearer picture of what GDP measures, namely income flows that include revenues that can be extremely volatile (such as those linked to the location of intangible assets – patents, software, brands – of multinationals). However, this approach in no way resolves the question of power and power relations within the economic sphere.
GDP and well-being
It is undeniable that in poor countries, increasing the well-being of the population depends on increasing certain essential production (agricultural, industrial, health and education). More generally, economic growth conveys the idea of an increase in collective resources, and therefore in political and social room for manoeuvre, notably to improve people’s living conditions. As we shall see, however, the relationship between rising GDP and improved well-being is far from always proven.
GDP is not happiness: Easterlin’s paradox
Economist Richard Easterlin is credited with highlighting the paradox that bears his name. In a 1974 study 46 he compared the evolution of real income 47 and that of their “happiness” measured by declarative surveys in 19 countries for the period 1946 and 1970 (see box).
Its results show that, while richer people within a given country declare themselves happier than poorer people, this is not necessarily reflected by differences in income levels between countries.
On the other hand, in the United States, the 60%-plus rise in real income was not matched by a similar rise in the proportion of Americans who consider themselves “very happy”.
Subjective assessment of well-being
For some researchers, the concepts of quality of life or well-being are too subjective for objective indicators (i.e., based on physical data such as inequality, level of education or life expectancy) to achieve consensus. They therefore consider it preferable to rely on subjective indicators, based on people’s own opinion of their well-being.
These indicators are based on surveys of a representative sample of individuals, who are asked to rate their level of life satisfaction on a scale of 0 to 10 (overall, or in specific areas such as their financial situation or personal relationships). Conducted on a regular basis, these surveys enable responses to be compared over time (do people feel happier than before?) and between countries (where do they get the best scores?).
See, for example, the results of well-being surveys on the Eurostat website for the European Union, on the Insee website for France, and on the website of the Office of National Statistics for Great Britain. The Better Life Index, developed by the OECD, is made up of several subjective indicators.
This initial study has given rise to many others along similar lines.
Beyond a certain level, “more income” does not lead to “more satisfaction” or “more well-being”. An INSEE study conducted in 26 European countries shows, for example, that “rising living standards have a marked impact on life satisfaction up to 20,000 euros a year, which gradually fades between 20,000 and 40,000 euros. Beyond that, variations in living standards have a marginal impact on life satisfaction.” 48
GDP and social indicators
The “Trente Glorieuses” established the belief that GDP growth went hand in hand with improvements in a number of social indicators: job creation, reduced poverty and inequality, generalized improvement in purchasing power, higher life expectancy. Recent decades have shown, however, that such growth is by no means a sufficient condition for achieving these objectives.
For example, growth over the last few decades has not prevented mass unemployment from continuing in many countries, particularly if we consider the “unemployment halo”. 49 and not just unemployment in the strict sense.
GDP growth can be accompanied by rising inequality, as shown by the evolution of the Gini index in the United States, the world’s leading economy (see data on the World Bank website). 50 .
According to the OECD, “over the last thirty years, the gap between rich and poor has widened in most OECD countries, while the Gini coefficient has risen by three points, reaching an average value of 0.32”“. 51
A high level of GDP per capita does not necessarily translate into better performance on social indicators (level of education, health, social ties, etc.). Research on French regions has shown that there is no correlation between GDP per capita and social health index (see box). Ile de France, the richest region, is also among the worst rated by this indicator.
The Social Health Index (SHI) for France’s regions
The SSI is a synthetic indicator that integrates six dimensions (housing, health, education, social ties and security, work and employment, income) through some twenty variables. For example, for education, the variables used are the rate of non-graduates and the rate of 18-24 year-olds who are neither in education, training or employment.
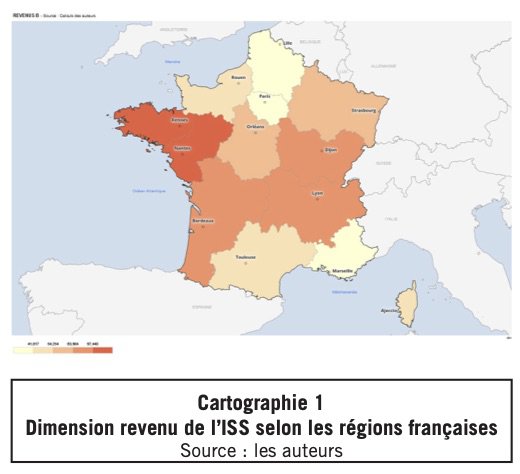
Source Florence Jany-Catrice, Grégory Marlier La santé sociale des nouvelles régions françaises et son évolution (2008-2016), 2020. Map interpretation: the darker the color, the higher the social health index.
As we saw inEssentiel 3, we decided not to include in the scope of production certain activities that we perform ourselves or for others without monetary exchange. Certain activities essential to the quality of social ties, such as voluntary work and domestic services, are therefore not included in GDP.
So, to increase GDP, it would be better to replace volunteers in associations with salaried employees; to put children in crèches and grandparents in retirement homes rather than have the former looked after by the latter; to buy ready-made meals rather than prepare them yourself; to pay for private lessons for your children rather than help them revise in the evening. Would it be better in terms of social health?
Finally, as we’ll see in the next section, over-exploitation of natural resources and pollution do not have a negative impact on GDP (on the contrary!), whereas the consequences of environmental degradation can be significant both locally and globally (via climate change, for example).
Growth in GDP goes hand in hand with growth in the exploitation and degradation of nature
One of the main criticisms of GDP is its environmental impact. Not only is GDP blind to the destruction of natural resources and major ecological imbalances, but the quest for growth also contributes to increasing them.
The dominant theories of growth generally focus on two factors of production: capital (in other words, all the equipment and infrastructure used by the economic system) and labor. They increasingly include “intangible capital” (inventions, patents, know-how), but “forget” natural resources (seeEssentiel 8 on macroeconomic models).
The reasoning behind this approach to growth is based on the idea that artificial capital (machines) could indefinitely replace natural capital. This approach, known as weak sustainability 52 However, it is clearly false: geo-engineering techniques will not replace natural climate regulation. 53 or bees and other pollinators by drones.
GDP is blind to the overexploitation of natural resources
It goes without saying that natural resources are the material and living foundation of all economic activity. We need water and arable land to raise livestock and grow food and textiles; wood and minerals to construct buildings, infrastructure and machinery; energy to heat our homes, cook our food, move people and goods, extract and transform matter and so on.
While the production and consumption process feeds on natural resources, much of it transforms them into waste and pollution (solid, liquid or gaseous) that is discharged into natural environments, disrupting and polluting ecosystems, turning the oceans into vast garbage dumps and destabilizing the planet’s climate.
Since the start of the industrial revolution, we’ve been drawing on the stock of natural resources, without GDP allowing us to see the limits. It’s simply not designed for this purpose: it only measures monetary flows generated by the production and exchange of goods and services.
We use water, soil, metals and energy, but the cost of building up these resources never appears on our bills. We pay only for the labor and rents involved in extracting, transporting, processing, marketing and advertising them, but never for the quantity of natural resources used, because Nature doesn’t charge for them…
What’s more, we benefit from a number of services provided by ecosystems (see the Economy, natural resources and pollution module) that are priceless in themselves. For example, we pay nothing for the water cycle, climate stability, the existence of an ocean conducive to life, photosynthesis or for the action of bees and other pollinators. Their disappearance, on the other hand, would have a very high economic, but above all human and ecosystem “cost”, of which we wouldn’t become aware until it was too late.
GDP is the driving force behind the destruction of nature
In addition to being blind to the dilapidation of our natural heritage, GDP and the quest for growth have until now been the driving force behind this destruction. When a primary forest is clear-cut, when a mine is put into operation, when industrial fishing fleets empty the oceans (while destroying the seabed), this generates jobs, goods and services sold – in short, GDP.
So, despite repeated warnings, global growth remains extremely well correlated with material and energy consumption, greenhouse gas emissions and, more generally, pollution and the destruction of nature (to the point where it is probably the best indicator of this destruction!
However, natural resources are not inexhaustible, either because they are finite on the planet (such as fossil fuels or minerals) or because they are renewed too slowly in relation to the amount we take from them (fish stocks, soil, fresh water, forests, etc.) (see the Economy, natural resources and pollution module). This is what the inhabitants of the island of Nauru and the cod fishermen of Newfoundland have learned the hard way.
On the other hand, the activities required to repair the problems generated by economic activity (known as “defensive spending”), far from weighing on GDP, actually increase it: cleaning up beaches after an oil spill, or soils following chemical pollution, building wastewater treatment plants, building dykes to protect against the waters following the destruction of coastal ecosystems (mangroves, coral reefs), providing care to repair the health consequences of pollution… all this generates economic activity and therefore GDP.
But you have to have the means to pay to repair the damage, otherwise all you can do is endure it, as is the case for many populations around the world. And not everything can be repaired. While some of the services we derive from ecosystems can be artificially reconstituted (water purification, for example), this is not the case for most of them. It is impossible, for example, to replace the climate stability essential to human survival.
When the costs of repairing ecological damage become too great for the human economy, GDP will inevitably start to fall.
A few examples of the excellent correlation between GDP growth, natural resource consumption and pollution
Numerous studies based on physical reasoning have demonstrated the strong correlations between GDP growth, consumption of natural resources and environmental degradation.
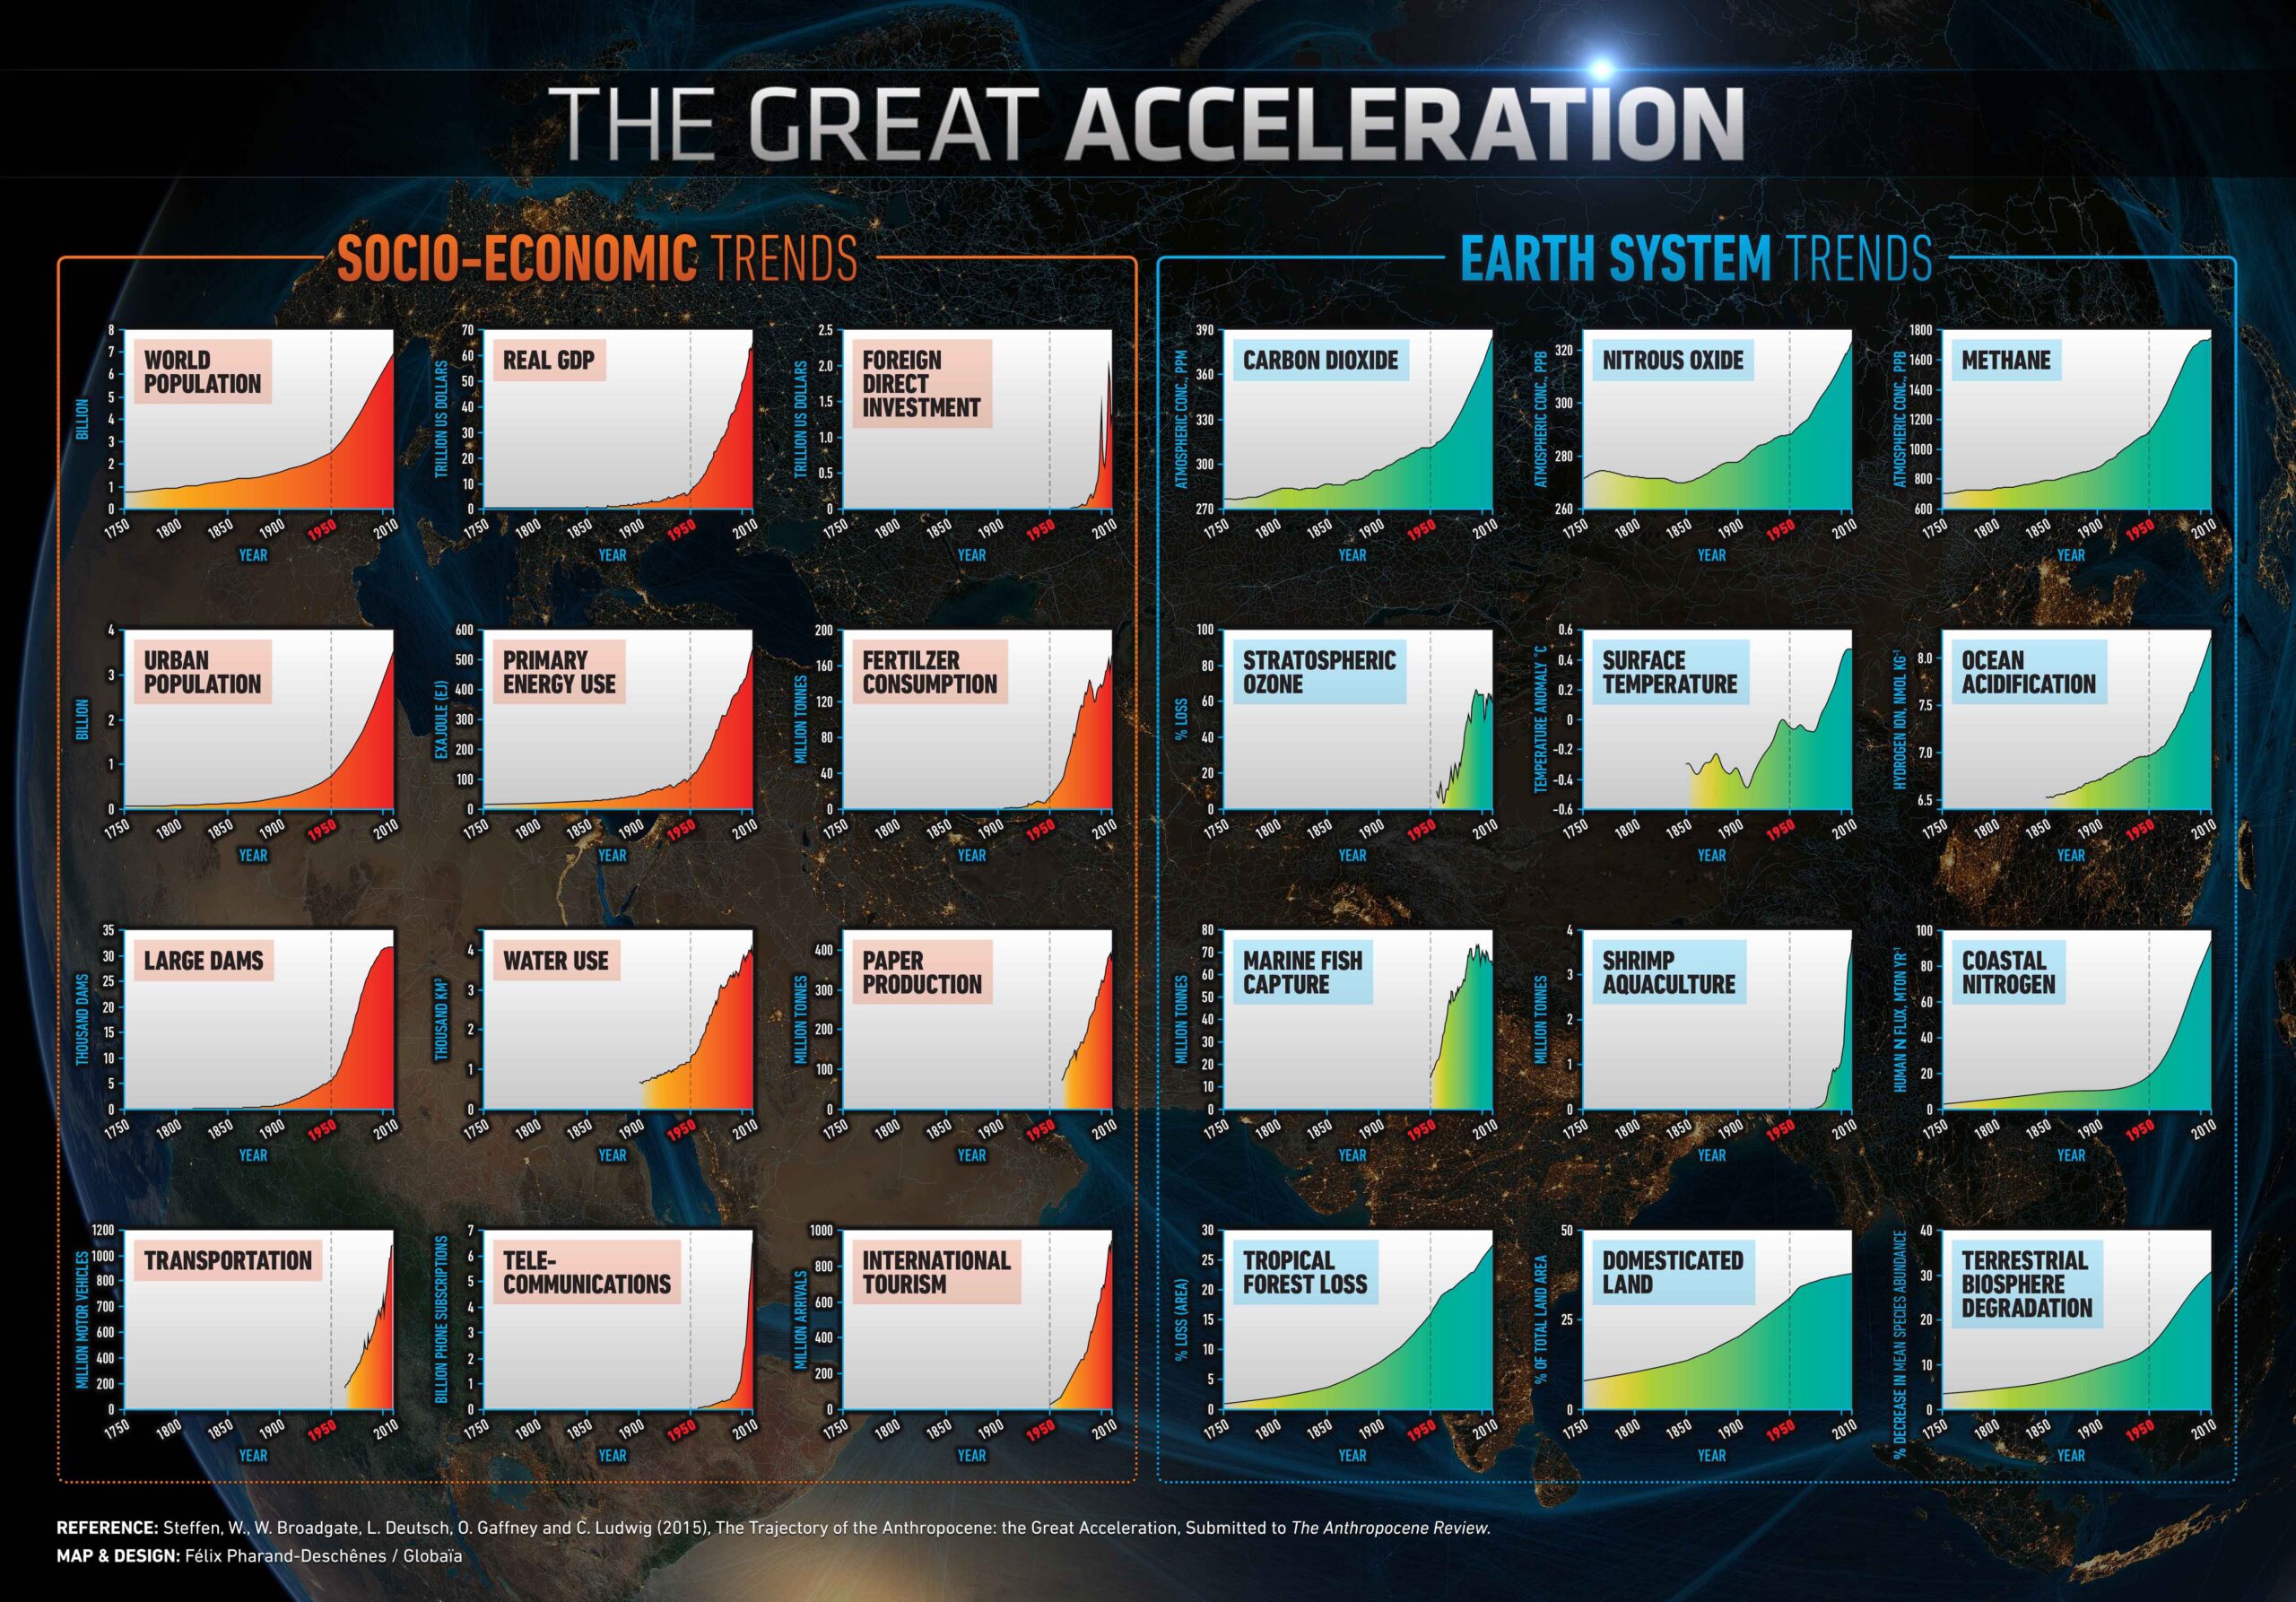
Researchers have highlighted the “great acceleration” of this process. 54 i.e. the exponential growth, from the 1950s onwards, of socio-economic indicators, foremost among which is GDP, and of indicators relating to resource consumption (water, energy, fish) and environmental degradation (greenhouse gas emissions, deforestation, eutrophication of coastal zones).
GDP and natural resource consumption: the example of energy
It’s easy enough to explain the correlation between economic growth and energy consumption. Economic activity consists mainly in the extraction and transformation of materials to produce goods and services consumed by human beings.
Among these materials, energy occupies a major place. Not only do we consume it directly (to heat buildings, move people and goods, cook food, operate electrical and electronic equipment), but it is also the driving force behind the transformation of other natural resources: all extraction and transformation activities require machines, and therefore energy.
Symmetrically, tensions over energy supplies at certain times (the 1973 oil crisis in the West being the most spectacular case in point) have led to lower growth rates.
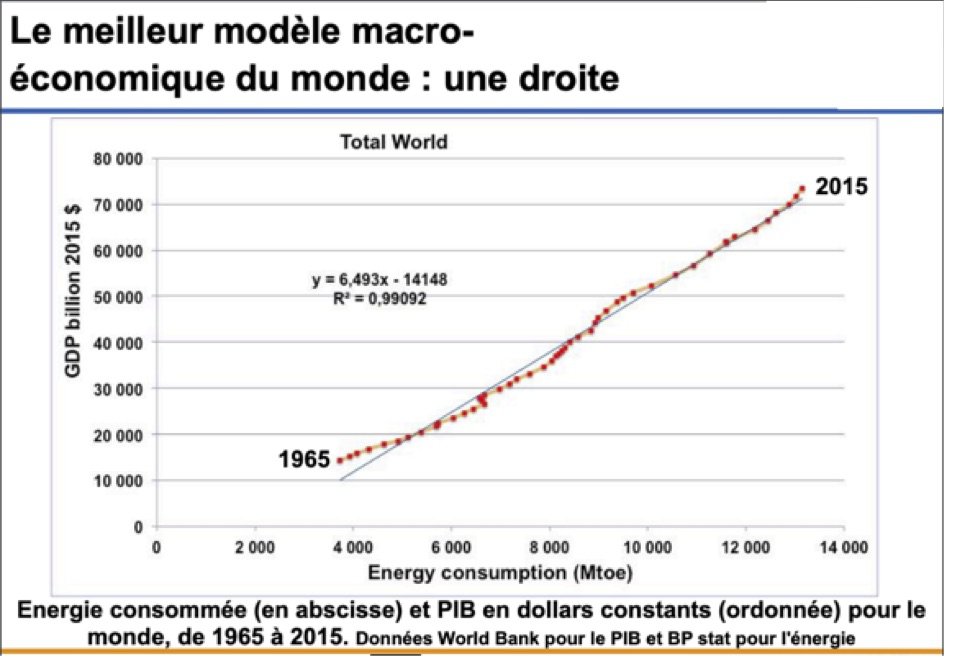
The links between energy and GDP are not simply a coincidental correlation: there is indeed a causal relationship between GDP and energy. However, this relationship is not absolute. Rising energy consumption alone does not explain GDP growth.
In theory, while access to energy is key to “keeping our machines running”, and therefore the economy, it is not enough. We also need institutions, companies, knowledge, qualified and motivated personnel… to use and transform this energy.
Empirically speaking, some countries have (or have had) easy access to energy resources and have not seen their GDP grow. This is known as the “oil curse” or, more generally, the curse of natural resources. 55 Countries with substantial oil resources may fail to develop, either because of technical incapacity (this was the case for all countries in the world before the industrial revolution), or because of the capture of oil rents by an oligarchy.
GDP and pollution: the example of GHG emissions
As the graph below shows, GDP per capita and CO2 emissions per capita are fairly well correlated. This correlation is obviously linked to the previous one (energy/GDP) insofar as the vast majority of primary energy comes from fossil fuels. Coal, oil and gas still account for 80% of the world’s primary energy sources.
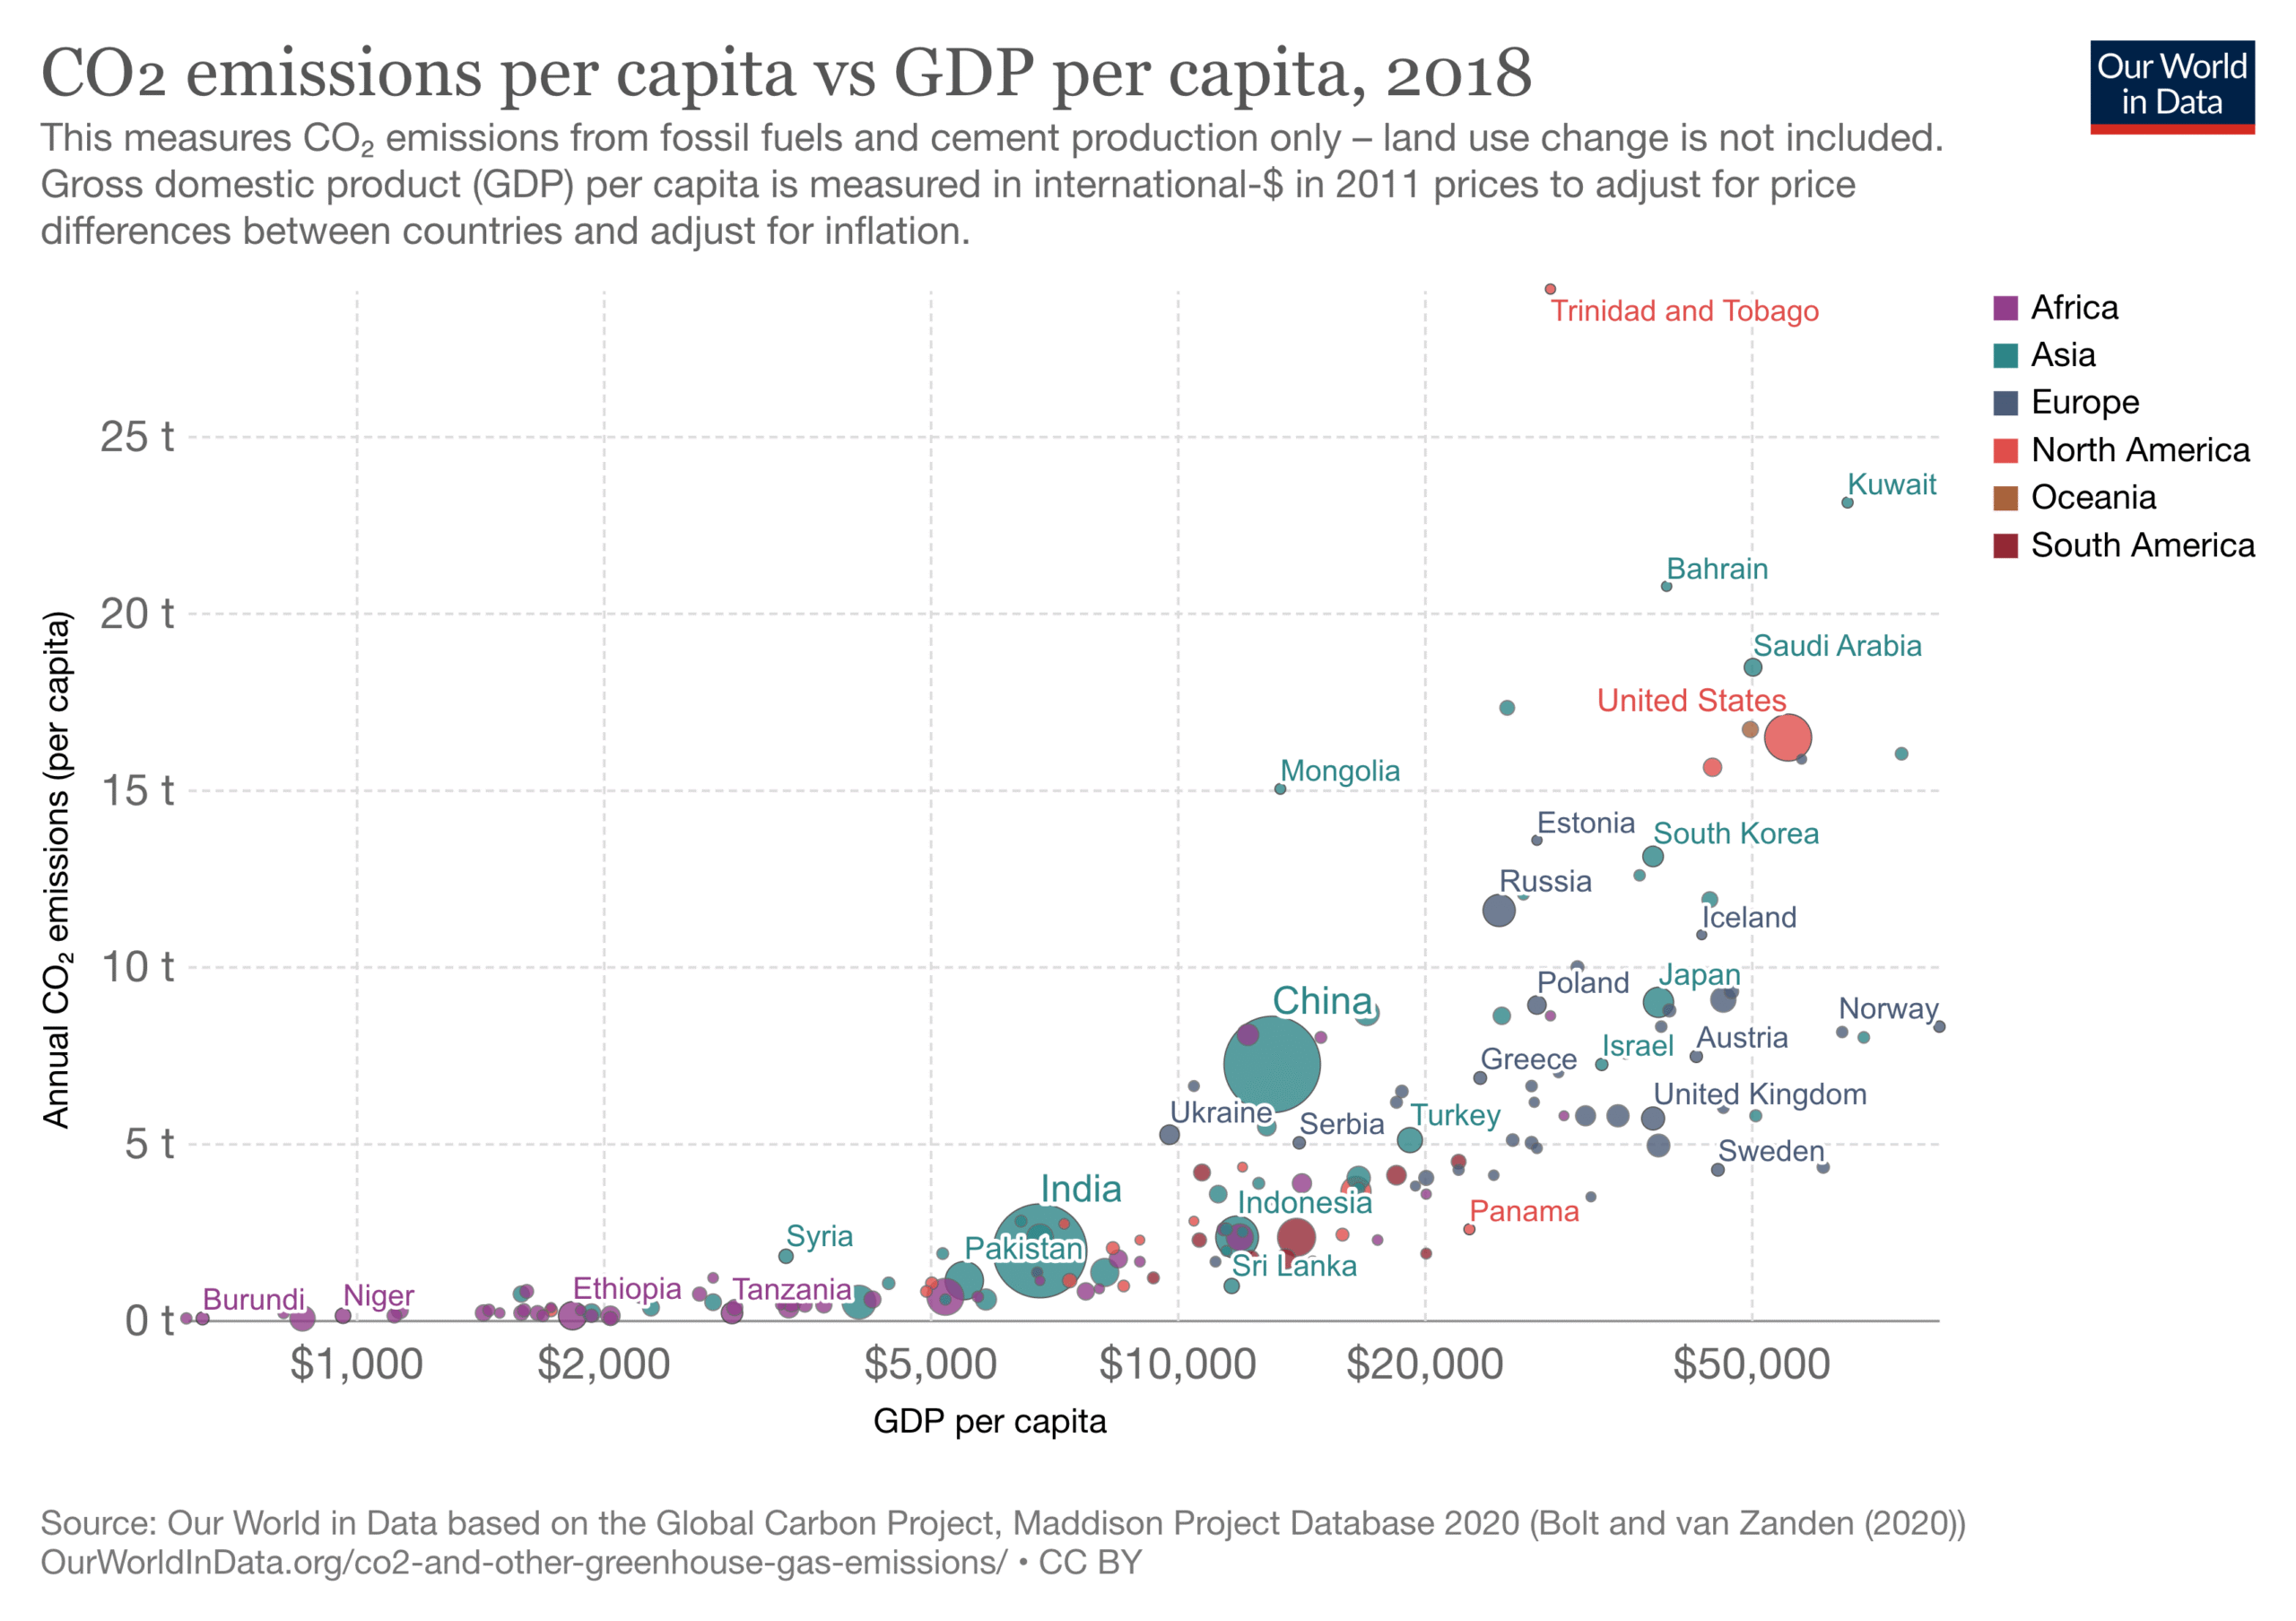
While a decoupling between CO2 emissions and GDP can be observed in some developed countries (seeEssentiel 9), the orders of magnitude are far from being right.
Find out more
- Eloi Laurent, Sortir de la croissance, mode d’emploi, published by Les liens qui libèrent, 2021.
- Tim Jackson, Prosperity Without Growth, Routledge, 2017.
- J. Stiglitz, A. Sen, J.-P. Fitoussi, “Report of the Commission on the Measurement of Economic Performance and Social Progress”, 2009.
- Dominique Méda, Florence Jany-Catrice, Faut-il attendre la croissance, La Documentation française, 2016.
- “Towards a post-growth society?”, lecture by Dominique Méda, March 19, 2018.
- Vaclav Smil, Growth: From Microorganisms to Megacities, MIT Press, 2019.
The limits of GDP are well understood, but it is still far from being replaced.
As we saw inEssentials 4 and 5, the limits of GDP and the growth objective are now well established. Faced with these criticisms, national accountants and economists have come up with a simple response: GDP is not intended to measure the well-being, progress and, even less, the environmental sustainability of an economy. The indicator is not to blame for the media excesses and political veneration to which it is subjected.
For this reason, a great deal of work has gone into developing indicators to complement GDP, to put its use in public debate and public policy into perspective, and even to replace it. The ultimate aim is not only to provide other measures of the economy, but also to help shape other economic trajectories.
Alternative indicators to GDP
One of the fundamental debates at the heart of the debate on alternative indicators is whether or not to emphasize :
- a few synthetic indicators (see below) with sufficient communicative power to counterbalance GDP;
- or a table of economic, social and environmental indicators to provide detailed measurements of the evolution of society in its various dimensions.
Synthetic (or composite) indicators
Their purpose is to summarize various standardized variables in a single number. 56 which are then weighted and aggregated.
In addition to the often-present economic dimension, these indicators may focus more on social dimensions (e.g., variables on inequality, poverty and exclusion, social insecurity, etc.), or on environmental dimensions (e.g., variables on greenhouse gas emissions, material and energy consumption, land use, etc.). Some indicators aim to cover all these dimensions.
The main criticisms are that the choice of variables and, above all, their weighting are necessarily arbitrary, and that these indicators cannot of course cover all the dimensions of well-being and sustainability. Their promoters acknowledge these limitations, which are inherent in any aggregation procedure, but also insist that they have strong communicative power and are therefore good candidates to counterbalance the predominance of GDP.
A few examples of synthetic indicators
The Human Development Index (HDI) 57 is the oldest synthetic indicator. It is based on three criteria (per capita income, life expectancy and level of education) which are then weighted to give each country an overall score. Published since 1990, the resulting ranking differs widely from that of GDP per capita, although high-income countries remain at the top of the list.
The Better Life Index developed by the OECD as part of its Better Life Initiative, focuses on current living conditions and quality of life. Its main purpose is educational. It is based on 11 criteria 58 which are weighted at 1 by default. Users of the online tool can then vary these weightings and see how the country rankings evolve.
The Sustainable Development Index (SDI), developed by Jason Hickel, aims to measure the ecological sustainability of human development. The SDI takes the HDI (slightly revised) and divides it by an ecological overshoot indicator (itself calculated from the CO2 footprint and material footprint per capita). The ranking this time is very different from that of GDP/capita, with developed countries among the worst rated due to their excessive ecological overshoot.
Footprint indicators aim to measure the environmental impact of consumption by an individual, a country or a region (i.e., taking into account imports rather than just national production). The carbon footprint measures greenhouse gas emissions; the material footprint measures the quantity of materials extracted (biomass, fossil fuels, metals and non-metallic minerals); the water footprint measures the quantity of water used to satisfy a population’s demand for goods and services. The ecological footprint measures the productive surface area used to produce the natural resources consumed. 59 by a population and to absorb its waste (in particular CO2 emissions). These different indicators are then compared with the relevant planetary limits (for example, for the carbon footprint, the maximum level of greenhouse gas emissions per inhabitant to limit global warming to +2°C).
The report International Environmental Rankings, Ministry of Ecological Transition (2022) provides detailed information on 10 synthetic indicators.
Adjusted GDP” or “green GDP” is a special form of synthetic indicator.
Their purpose is to correct GDP by adding monetary estimates of activities that contribute positively to “present economic well-being” (leisure, domestic work) and subtracting activities that reduce it (commuting, pollution control activities, destruction of primary forests, etc.).
The advantage of these approaches is that they can be directly compared with GDP, and are part of a familiar measurement space: that of national accounts and the expression of values in monetary units.
On the other hand, they pose a number of problems: i/ they don’t take inequalities into account ii/ they involve giving a monetary value to goods and services that don’t have one, with all the methodological and ethical questions this raises, and, in particular, putting a price on nature iii/ they are based on a logic of weak sustainability: the destruction of natural resources can be compensated for by the development of artificial capital (machines).
These approaches have their origins in a 1973 article by Nordhaus and Tobin 60 which took very little account of environmental issues. Other examples include the genuine progress indicator and the sustainable well-being index.
Multidimensional dashboards
The most common approach at institutional level is to set up dashboards grouping together various unweighted indicators, either with a view to providing a global vision of the various dimensions (economic, social, ecological) of society, or with a view to informing specific public policies (education, transport, energy, etc.).
Multiple dashboards
The international community adopted the 2030 Agenda for Sustainable Development at the 2015 United Nations General Assembly. This is broken down into 17 Sustainable Development Goals (SDGs), assessed by means of over 230 indicators. The SDGs are tracked in most countries around the world (at least those with a statistical apparatus): see here for France, here for the EU and here for the USA.
In the 2020 edition of its annual How’s life? report, the OECD presents an expanded dashboard of over 80 indicators of well-being (current and future). To make communication more concise, they have highlighted 36 key indicators 61 . Another example is the dashboard of green growth indicators.
In a report published in 2021, researchers at the Zoe Institute reviewed the European Union’s multiple scorecards to analyze the coverage of social and environmental indicators. They counted over 450 indicators from 18 different political processes 62 . Their findings show that social and environmental aspects are rarely presented together. Above all, while these dashboards can be interesting for specific policies, they suffer from considerable fragmentation. They contribute to a siloed reading of different public policies, and are far from presenting an accessible synthesis, an overall vision, reducing complexity for decision-makers and civil society alike.
The value of dashboards lies in their ability to enable governments and experts to monitor and analyze in detail the various changes taking place in society. In addition, by using physical environmental variables, they provide warning indicators of the unsustainability of development.
However, these tables are extremely heterogeneous, making it difficult to select and prioritize the indicators they contain. Above all, they are poor communication tools.
“Public, political and media debate is largely dominated by economic and financial criteria: GDP, growth and stock market indices dominate the headlines and hold the audience record. They symbolize success. To organize public debates on how growth is or isn’t accompanied by social and environmental progress, with a powerful, well-known and much-publicized growth indicator on the one hand, and a table of several dozen variables on the other, is to place ourselves in a situation of unfair competition from the outset.”
A donut to replace dashboards?
Kate Raworth came up with the idea of representing humanity’s long-term goals in the shape of a donut. “Below the inner ring – the social foundation – lie critical human deprivations, such as hunger and illiteracy. Beyond the outer ring – the ecological ceiling – lies critical planetary degradation, such as climate change and biodiversity loss. Between these two circles lies the donut proper, the space within which we can satisfy the needs of all, within the planet’s means.” 64 This representation provides a general framework that underlines the need to balance environmental sustainability and social cohesion through a resilient economy.
The Zoe Institute has used this work as the basis for a visual representation of the European Union’s priorities between now and 2030.
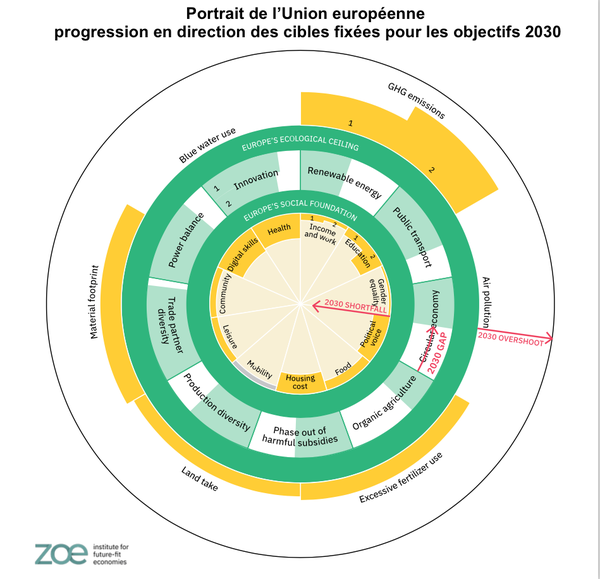
Source Towards a thriving Europe beyond economic growth, 2021 Yellow areas above the ecological ceiling indicate transgression of ecological targets for 2030. Yellow areas below the social foundations indicate deviations from the EU’s social objectives for 2030. The green areas inside the “donut” represent political levers and economic tools.
How can we bring alternative indicators to GDP into the public debate?
Despite numerous studies on alternative indicators, we saw inEssentiel 1 that GDP and its growth remain at the heart of economic policy discourse and stated objectives.
In fact, it’s neither enough to measure alternative indicators, nor to proclaim them, to set in motion a profound social transformation. We also need to make them effective, in other words, to turn them into genuine tools for measuring and guiding public action.
Giving legitimacy to alternative indicators
A recurring demand of the promoters of alternative indicators to GDP concerns the modalities of their adoption. Since they are supposed to reflect the objectives a society sets for itself, it is necessary to give them legitimacy by initiating a public debate on what makes sense and the direction to take.
Make them genuine tools for guiding public policies
Public authorities need to get to grips with these indicators and make them operational. The general principle would be to justify the various public policy measures not because they are good for growth (or considered as such – seeEssentiel 2), but because they are beneficial to the ecological transition, to the reduction of inequalities, and so on.
The example of the SAS law in France is illuminating in this respect (see box): new wealth indicators are published regularly, but are not the subject of any specific communication and have no impact on public policy.
The failure of the French law on new wealth indicators
Passed in 2015, the SAS law requires the government to submit an annual report to Parliament presenting the evolution of new wealth indicators, as well as an assessment of the impact of the main reforms undertaken with regard to these indicators. Following this vote, work was undertaken to identify 10 wealth indicators.
Unfortunately, this law has had no political impact: the annual reports are published 65 but they do not serve to clarify and evaluate public policies, starting with the mobilization of public finances.
This is what economist Eloi Laurent notes in a note on the implementation of the SAS law. “The French budget debate is currently governed by the GDP growth target, which is itself a determining factor in the application of and compliance with European public finance rules (calculated as a percentage of GDP). Apart from the breakdown of GDP and a few macroeconomic indicators relating to the labor market, the information transmitted to the national representation at the time of allocating public spending and charges is proving to be very inadequate for grasping the social state of the country and its challenges for the future, particularly ecological.” 66
The reaction of public authorities during the economic crisis of 2020 is another good example of how little impact alternative indicators have had on public policy to date. Faced with the imperative of avoiding the collapse of the productive system due to its prolonged shutdown during the confinements, public authorities in rich countries spent lavishly to support the incomes of employees and companies. This funding has rarely been conditional on ecological or social objectives. While they have financed low-carbon energies, they have also largely fuelled the fossil fuel economy. 67
Far from triggering a shift towards a less resource-intensive, more resilient model, the economic response to the COVID-19 pandemic was a desire to return to “normal”, i.e. to maintain the economic system as it was.
On the other hand, there are a number of initiatives showing that it is possible to mobilize indicators in an operational way. For example, the Well-being budget introduced in New Zealand in 2019 gives concrete direction to the use of the budget tool by prioritizing certain public spending (mental health, allowances for indigenous populations, the fight against child poverty and domestic violence, investment for the climate) on the basis of ecological and social indicators.
Indicators can’t do everything: giving governments back the means to steer the economy
As noted inEssentiel 1, GDP and national accounting were born out of the 1929 crisis, the world wars and reconstruction, i.e. a historical configuration during which governments had far greater leverage over the economy than they do today (more or less extensive planning, supervision of finance and bank credit, limited trade with the outside world, macro-economic closure through public spending).
As Antonin Pottier explains, these conditions no longer exist.
“The institutions that enabled national accounting to inform economic steering decisions were dismantled, the socio-economic conditions for steering disappeared, and economic supervision mechanisms were abandoned. In this neoliberal era, which all Western economies entered in the 1980s, the state lost much of its capacity for direct intervention. (…) With the return of laissez-faire, without adequate regulatory institutions, without the State’s ability to constrain or convince economic players, production growth is above all the result of a myriad of actions by economic agents. These actions are not guided by aggregate indicators like GDP, but by the profit prospects of these agents.”
Adopting new indicators and placing them at the heart of public policy discourse is therefore not enough. It is also necessary to review the institutional conditions in which public policies are constructed.
Challenging the totem of growth also means questioning the omnipotence of finance and its ability to destabilize the productive economy (see the Role and limits of finance module), the ways in which public spending is financed (see the Public debt and deficit module), the ability of the wealthiest players (whether households or companies) to avoid paying taxes, and the primacy of free trade over all forms of social and environmental protection. We also need to change the incentives, ways of doing things and calculations of private agents, for example by radically reforming accounting so that it is no longer possible to make profits while destroying nature. Research must therefore now focus on the institutional obstacles, as well as the mechanisms that could turn these indicators into a force for action.
Find out more
- Jean Gadrey, Florence Jany-Catrice, Les nouveaux indicateurs de richesse, La Découverte, 2016.
- Eloi Laurent, Et si la santé guidait le monde, published by Les liens qui libèrent, 2020.
- The Well-Being Alliance (WeALL), which highlights and supports initiatives on alternative indicators to GDP.
- Putting Well-being Metrics into Policy Action” conference, organized by the OECD in 2019, at which numerous concrete initiatives were presented.
- “Beyond GDP Measuring What Counts for Economic and Social Performance,” OECD report, 2018.
- J.P. Fitoussi, M. Durand, Measuring What Counts, The New Press, 2019.
GDP growth not explained by the most widely used macroeconomic models
We saw in the previous section that GDP growth remains the objective of macroeconomic policies. Here, we will attempt to take stock of the factors that explain this growth in economics, and to see how it is incorporated into the main macroeconomic models used in the major public institutions. 68 .
These models are major benchmarks for the conduct of public economic policies. 69 . However, they are not neutral: they reflect the theoretical choices that governed their development. Today, the macroeconomic models most widely used by major public institutions are based on the following postulates: markets balance automatically (via prices for the goods and services market, via wages for the labor market, via the interest rate for capital), even if rigidities are sometimes introduced by the modelers; production growth is determined by the increase in supply (which automatically meets its own demand); money and credit are neutral; natural resources and pollution are not limiting factors.
What is a macroeconomic model?
A model is a system of mathematical equations (and procedures for solving them) with theoretical or empirical underpinnings, designed to simulate the operation of a real-world system: the earth’s atmosphere, a financial market, a natural ecosystem, and so on.
The purpose of a macroeconomic model is to simulate the functioning of the economy as a whole, for a country, a regional zone, or even the entire world. These models are used by economic institutions (Central Banks, OECD, IMF, Ministries of Finance) to forecast short-term economic conditions (notably to inform budgetary decisions) or to assess the consequences of economic policy decisions.
For example, France’s Direction Générale du Trésor uses the Mésange, Opale and Nigem models; the Banque de France uses the FR-BDFb model; the European Commission the Quest model and the ECB the NAWM model.
The elements of analysis in this chapter refer to these models.
Before going any further, let’s stress that the economic “causes” or “factors” of the GDP growth mentioned below cannot be understood without an institutional, political, cultural or legal “context”. This context must be favorable to allow growth, as the history and current situation of the least developed countries demonstrate.
Production growth depends on productive capital, labour and the availability of natural resources
First, let’s look at GDP in terms of production, without taking into account the “demand” aspect and the associated questions of income distribution and credit. A territory’s production must be able to grow in order to enable GDP growth (seeEssentiel 3 on how GDP is calculated). It relies on the mobilization of “factors of production”, which are listed in the following paragraphs (the ability to mobilize these factors of production being a necessary condition for growth).
Capital and labour are the two factors of production generally considered in economic theory.
A region’s production depends first and foremost on its production capacities: factories, machines, manpower… In economic terms, we speak of the factors of production: ” productive capital ” (the machines and infrastructures involved in production) and ” labor “.
An increase in production is made possible by :
- In the short term, an increase in the employment rate of the workforce or the utilization rate of productive capital;
- In the longer term (when production capacity is already fully employed), an increase in the absolute value of hours worked or productive capital;
- Or (still in the long term) progress in labour productivity (value produced per quantity of labour invested) 70 or productive capital – which are closely linked.
To illustrate, let’s break down production per capita (GDP per capita) as follows 71 :
GDP/Habt = GDP/ H * H/ Popa * Popa/ Habt
With H the hours worked, Popa the working population and Habt the total population. Production per capita can grow :
- by the increase in the activity rate (Popa/Habt),
- by the number of hours worked per worker (H/Popa),
- or labor productivity (GDP/H).
It should be noted that productivity gains may translate into higher output if other parameters remain constant, but may just as easily not be reflected if employment or working hours fall.
The same reasoning can be applied by decomposing production as a function of the total quantity of productive capital, the rate of utilization of this capital and the productivity of this capital.
Natural capital”, a factor of production generally forgotten by economic theory
In addition to productive capital and labor, the production of goods and services requires energy and natural resources. It also depends on a stable climate and healthy ecosystems (particularly in view of the ecosystem services from which people benefit free of charge: water and air purification, pollination for agriculture, natural areas and tourism, etc.). All these elements are often referred to as “natural capital”.
Growth and even the simple maintenance of production can be made impossible by limitations on access to energy and natural resources, or when an ecosystem service is no longer guaranteed (polluted air, lack of pollination, damaged natural areas making tourism impossible…). Natural capital is therefore another factor of production.
In short, economic activity relies on three main factors of production: labor, productive capital and natural capital. Some activities require more productive capital, others more labor, others more natural capital. For most economists, these three capitals are entirely substitutable: it is always possible to replace natural resources with machines or labor; for others, the possibilities of substitution between these different factors of production (for example, using less labor and more machines) are limited. This question of substitutability is at the heart of the debate among economists on the strong or weak sustainability of development (which we present in the module Economics, natural resources and pollution).
Let’s stress here that all economic activity requires energy input, and that this cannot be reduced beyond certain limits (thermodynamic limits), which is a “physical” certainty and not a debate among economists.
And in the macroeconomic models most widely used at institutional level?
These models include “productive capital” and “labor”, but generally ignore the production factor “natural capital”. The reason for this is simple: since transactions are only between people (and not with nature), there is no monetary flow to mark the extraction of a resource from the environment (other than the costs of this extraction) or to pay for an ecosystem service: natural capital is free. This omission is, moreover, justified by the implicit assumption that, thanks to technical progress, it would always be possible to find a solution if a resource were to run out (by changing the process, replacing it with another resource or machines, etc.). 72 In fact, these models assume that the natural capital required for economic activity is not and never will be limiting: natural resources are considered infinite, always available, without delay, and everywhere; ecosystem services as always provided.
This vision is obviously at odds with reality. We can think of short-term supply crises linked to the inertia of industry development (skills and infrastructures), natural disasters or geopolitical issues. Above all, there are the long-term supply risks associated with reaching planetary limits.
Failure to take environmental feedback into account
Economic activity generates pressures on the environment (overexploitation of natural resource stocks, destruction of natural habitats, emissions of greenhouse gases, solid and liquid waste, etc.).
These degradations can have a negative impact on subsequent production by affecting the three factors of production (productive capital, labor, natural capital) mentioned above: we speak of an environmental feedback loop. For example, climate change can destroy or render inoperable productive capital (destruction of factories and infrastructure following storms or floods), make work less efficient or impossible during heat waves, and above all damage natural capital (forest fires, wildfires, loss of biodiversity, drought damaging crops)…
GDP growth must therefore be analyzed not only in terms of these three production factors, but also taking into account feedbacks from environmental pressures.
And in the macroeconomic models most widely used at institutional level?
Generally speaking, the macroeconomic models used by public institutions do not include a climate feedback loop on the economy. While some of them allow (or could allow) us to determine the greenhouse gas emissions induced by a simulated macroeconomic trajectory, they do not take into account the effects of climate disruption on the economy.
Central banks are, however, beginning to work on the financial risks associated with global warming (see the module on money). They are basing their work in particular on the theoretical work of economists such as William Nordhaus, who have attempted to model the impact on GDP of different levels of global warming by the end of the century. As we shall see inMisconception 6, this work is largely flawed and systematically underestimates the impacts of climate change. It is particularly problematic that central banks should draw inspiration from it.
Other environmental feedback loops (biodiversity erosion, massive chemical pollution, etc.) are absent from all the most widely used macroeconomic models. These feedback loops are extremely complex, and research aimed at modelling them is still unsatisfactory.
GDP growth also depends on the distribution of income and credit
In the early 19th century, Jean-Baptiste Say formulated an “economic law” according to which supply creates its own demand: the goods (investment or consumer) produced are necessarily sold, because the purchasing power generated by their production makes it possible to buy them. In this view, credit and money play no role other than a possible short-term adjustment. Growth therefore depends solely on production. Taken up by neoclassical economists at the end of the 19th century, this concept, which postulates automatic equilibrium between supply and demand, is still largely dominant today, and structures the construction of macroeconomic models.
However, the crisis of 1929, the work of John Maynard Keynes on the importance of demand in economic dynamics and that of Roy Forbes Harrod and Evsey Domar 73 had largely challenged this view.
They have highlighted the possibility of structural imbalances (e.g. between supply and demand for goods and services, between “real” productivity gains and the distribution of their monetary translation, imbalances on the financial or labor markets, etc.). This leads us to integrate the question of income distribution and monetary creation, via credit, into our reasoning on growth.
An increase in production does not necessarily imply an increase in demand
If an increase in productivity, total quantity or the utilization rate of a factor of production enables us to “do more”, this does not automatically translate into GDP growth.
GDP only grows if producers anticipate that more production will be purchased, and if their products are actually purchased. This presupposes purchasing power and “willingness to buy”. 74 to be present. This does not happen automatically, unless we believe in the spontaneous equilibrium of markets (i.e., in Say’s Law as described above). It is, in fact, entirely possible that the extra income generated by production will not be used to acquire additional production (because it is poorly distributed, because it is saved). 75
In his book 40 ans d’austérité salariale comment en sortir? (Odile Jacob, 2020), economist Patrick Artus shows that, in OECD countries, productivity per employee has increased by a factor of 1.5 over the last 30 years, while wages have grown by only 1.25. At the same time, prices have remained generally stable. At the same time, prices have remained stable overall. Production has grown slowly. Consumer credit enabled wage earners, whose incomes were growing more slowly than output, to buy the extra production. It therefore played a compensatory role over the long term.
The fundamental role of money creation via credit for economic activity
In the neoclassical conception of the economy, money is neutral: it is the “lubricant” of the economy, a simple instrument facilitating transactions and avoiding barter. Injecting more money into the economy has no other effect than to raise the general price level. In the neoclassical model, then, there is no money, no credit, no financial sector. Households choose to spend the income they earn in the production process, either by consuming or by saving (the trade-off between the two being a function of the interest rate). Savings are used to finance business investment demand. It is the interest rate that balances savings and investment. Money and credit play no part in this dynamic.
This view is clearly contradicted by the facts.
As we saw above, credit first and foremost supports (at least for a time) the consumption of the middle and lower classes when the income earned during the production process is insufficient for them to purchase the goods produced. It thus helps to avoid (delay) a crisis of overproduction (but can lead to a crisis of overindebtedness ).
In addition, companies, governments and some households take on debt in order to invest. This indebtedness is based not only on the recycling of savings, but also on the creation of money by banks through the loans they grant (see the module on money). This money creation is in fact permanent: the flow of new loans is greater than the flow of repayments (except during financial crises, which are periods of money destruction). The new money put into circulation enables projects to be carried out that would not otherwise have seen the light of day.
Finally, credit and money creation can fuel over-indebtedness and speculative bubbles, generating financial crises whose impact on the economy is hard to deny.
Economist Richard Werner developed a quantitative theory of credit 76 and applied it to the Japanese case. The two key ideas of his work are to focus on the role of the quantity of credit rather than that of interest rates, and to make a clear distinction between credit to the “real” economy and credit to “speculative” activities. Take, for example, this extract from an article published in 2018 in Ecological economics: “This suggests that markets are not in equilibrium and that the third factor in GDP growth is a quantity (…) (namely, the quantity of bank credit creation for the real economy, i.e. for GDP transactions, as postulated by quantitative credit theory).”
And in the macroeconomic models most widely used at institutional level?
The majority of macroeconomic models in use today are neoclassical in inspiration, in line with Say’s Law: they assume that demand always adjusts to supply, in all sectors of the economy: when production increases, demand is assumed to increase in the same proportions. Markets for goods and services are said to be “in equilibrium”, and are referred to as general equilibrium models. 77
In these models, the role of income distribution and credit in GDP growth is therefore overlooked.
How do the most widely used macroeconomic models explain economic growth?
Macroeconomic models without natural resources, without environmental feedback curves, without money and without income distribution
As we have seen, the macroeconomic models most widely used by public institutions today essentially consider two factors of production: capital and labor. They are linked to GDP via an aggregate production function 78 . They do not integrate natural resources or environmental feedback loops: in this way of modeling the economy, what goes into the economic system and what comes out … is out of its hands! 79
Nor are income distribution, money and credit generally represented in this type of model: all goods produced are assumed to be consumed, and the purchasing power distributed in the production process is assumed to be sufficient to buy these goods.
In these models, the growth in the capital stock and the increase in the mobilization of labor (notably via the reduction in unemployment) enable GDP to grow, in a positive feedback loop (growth enabling, via savings, the financing of investment, and therefore the increase in the capital stock, which in turn enables an increase in production, etc.).
In these models, economic growth is mainly determined by an exogenous variable called total factor productivity.
At the heart of these models is the aggregate production function, which links GDP to the factors of production, labor and capital.
However, comparison with past data, using the “growth accounting” technique 80 introduced by Robert Solow in 1957 (see box), showed that only a minor part of growth could be explained by the production factors capital and labour (via the positive feedback loop described above).
The remainder was then attributed to a “residual factor of production” known as total factor productivity (TFP) or the “Solow residual” (see box). In the various analyses, it is this TFP that explains growth far more than the other factors of production (see box).
The Solow residual and exogenous growth theory
In his 1957 article ” Technical Change and the Aggregate Production Function “, economist Robert Solow investigated the extent to which economic growth in the USA over the period 1909-1949 was linked to the various factors of production. He broke down the sources of growth into capital and labor factors, and realized that they were not sufficient to explain growth: a “residue” remained, accounting for almost 87% of US GDP/capita over this period!
Solow attributes this “residual factor of production” to technical progress, which he considers to be exogenous, i.e. external to economic dynamics, not determined by the decisions of agents. It’s like “manna from heaven”. This is why Solow’s theory of growth is called exogenous growth.
Find out more: see the Solow residual sheet on the Sharing the Eco website.
Thus, in many macroeconomic models used today to inform public policy, GDP growth is determined first and foremost by TFP, which, as we have seen, is a residual element. It is, by definition, the share of output growth that can be explained neither by an increase in the capital factor nor by an increase in the labor factor. It is therefore an “ad hoc” term, exogenous to the model: in other words, it is not explained by the relationships with the other variables in the model. It is set conventionally by the modeler, without being based on observed data.
Based on endogenous growth theories (see box), some modelers attempt to “endogenize” TFP (i.e., make it a variable that follows from the model), but this remains partial and is far from being the case for the majority of models. Of all the institutional models studied in this chapter, only a variant of the Quest model used by the European Commission proposes a – partial – endogenization of TFP. In this model, TFP grows partly through investment in R&D, and partly exogenously.
Explaining TFP: endogenous growth theories
In the last quarter of the twentieth century, numerous theoretical works 81 was to analyze TFP, the “residue” that is supposed to represent technical progress. They are grouped under the heading of “endogenous growth theories”, because they seek to show that total factor productivity is not a “manna from heaven” as in Solow’s model, but rather comes from growth itself, while at the same time nourishing it (thus provoking a virtuous circle).
Thus, for Robert Lucas, growth enables workers to accumulate “human capital” (stock of knowledge and skills, state of health, etc.), making them more productive. For Romer, it’s Research & Development, i.e. the accumulation of “technological capital” that boosts the productivity not only of the players behind this R&D, but also of all the others. Finally, Robert Barro emphasized the role of public investment (i.e., the accumulation of public capital): infrastructure is a source of multiple positive externalities for those who benefit from it, boosting their productivity. The resulting growth generates higher tax revenues, which in turn fuel public investment.
In conclusion, in the models we mentioned at the start of this chapter (which are representative of the majority of models used by public institutions), growth is explained for the most part by exogenous (and therefore unexplained) growth in the productivity of production factors, and for the rest by equations linking investment to growth in the capital stock. GDP therefore grows by hypothesis, without it being explained how.
The role of credit and income distribution is not taken into account in these models, nor is the role played by natural capital. Finally, the feedback effects of climate drift and the destruction of nature on the growth that causes it are a blind spot in the reasoning and are not represented by these current models.
These models are not only unfounded, but dangerous. It leads us to underestimate (or even deny) the impacts of the ecological crisis, to overestimate our means of dealing with it, and to err on the side of public policy by putting growth first, when it can only be the result (or not) of our social and economic choices.
Find out more
- Franck-Dominique Vivien, “Les modèles économiques de soutenabilité et le changement climatique”, Regards croisés sur l’économie, vol.2, n°6, 2009, pp. 75-83
- Martin Anota, “Theories of economic growth,” Annotations blog, September 1, 2012.
- Gaël Giraud, “Crise de la ‘science économique’” (part 1), Mediapart blog, November 29, 2015
- Gaël Giraud, “Crise de la ‘science économique’” (part 2), Mediapart blog, December 1, 2015
Decoupling is at the heart of the debate on the links between growth and ecology
The objective of decoupling economic growth from pressures on nature has been regularly invoked in public policy since the early 2000s. Here, we look at what decoupling means in practice, the arguments of those who invoke it and those who say it is impossible, and then ask whether the debate is still relevant.
What does it mean to decouple GDP growth from pressures on nature?
The notion of decoupling means that economic growth could be accompanied by a decrease in pressure on nature (measured by various indicators). In concrete terms, this would mean breaking the link between GDP growth and environmental impact (seeEssentiel 6).
However, this initial approach needs to be clarified. It is not enough to decouple a little: we need to decouple enough to preserve the habitability of our planet.
In a publication by Carbone 4, the authors detail the conditions that such an ambition implies.
- Decoupling must concern all ecological issues.
It must involve the upstream and downstream parts of the economic system, i.e. all natural resources. 82 used in the production system and all the waste and pollution generated (including greenhouse gases) during production and consumption. So it’s not just a question of decoupling economic growth and energy or greenhouse gas emissions, as is often the case in analyses.
- Decoupling must be global, not local
Reducing the pressures on nature must be considered on a global scale, and not just on the scale of one country or one region of the world. This is particularly obvious in the case of global issues such as global warming, the hole in the ozone layer or the preservation of marine resources.
- Decoupling must be absolute, not relative
Relative decoupling means that each additional unit of GDP is obtained from fewer natural resources or generates less pollution than the previous unit.
The aim is to achieve an absolute decoupling of natural resources and pollution.
For example, worldwide greenhouse gas (GHG) emissions per unit of GDP (PPP) fell from 613 g CO2eq in 1990 to 423 g in 2015. Unfortunately, this relative decoupling has not translated into absolute decoupling: over the same period, global GHG emissions have risen from nearly 33 to 49 Gt of CO2eq. 83
- Lastly, this decoupling must be sustainable over time and fast enough to avoid irreversible environmental damage.
For example, the latest IPCC report 84 indicates that to keep global warming to 1.5°C, CO2 emissions must fall to zero by 2050, and then become negative! This implies an average reduction of almost 3.5 billion GT of CO2 per year.
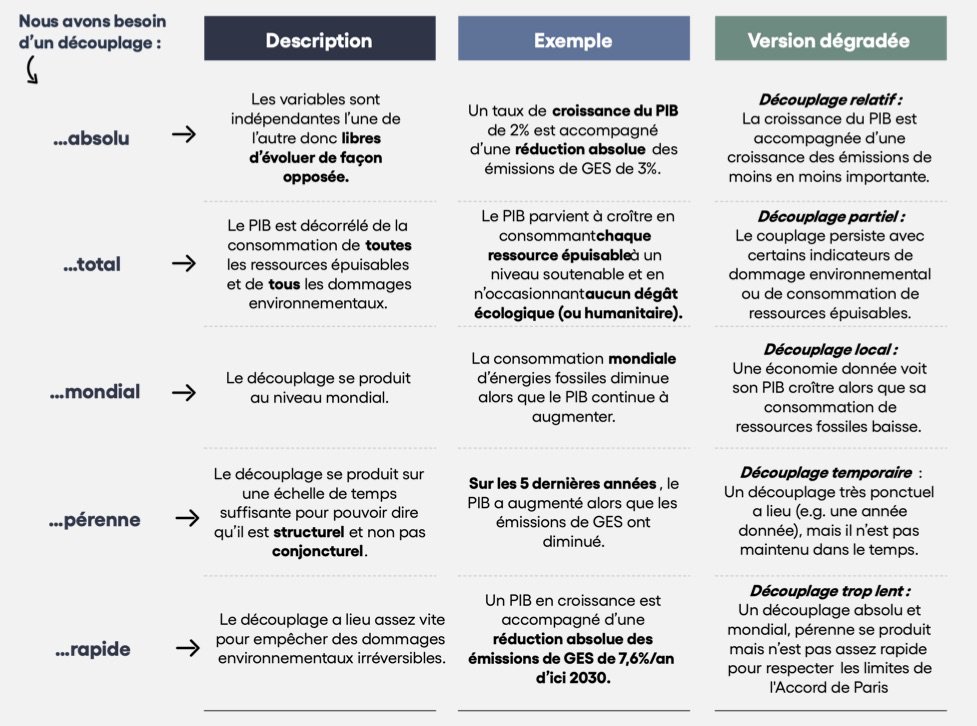
Source Decoupling and green growth, Carbone 4, 2021
The arguments of those who believe decoupling is possible
The main argument in favor of decoupling is based on observation of the past.
In some of the world’s most developed regions, an absolute decoupling has been observed for certain impacts. This is particularly true of the European Union in terms of global warming. The European Union’s GHG emissions peaked at over 6 Gt eq CO2 in the late 1970s, before dropping to around 4.5 Gt eq CO2 in 2015.
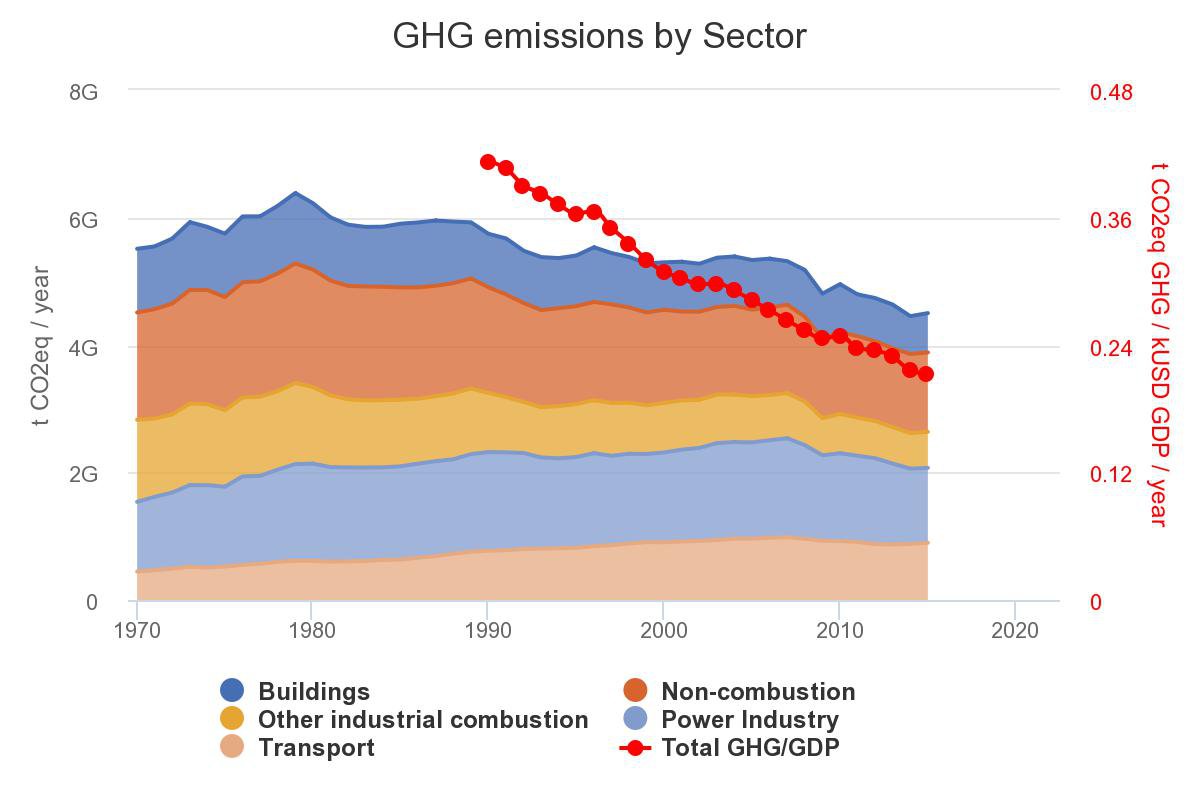
A study published in 2020 by the journal Climate Policy goes into more detail. It analyzes the evolution of 24 countries (22 European countries, the United States and Jamaica) that have reduced their territorialCO2 emissions in absolute terms, as well as their global GHG emissions (albeit to a lesser extent) between 1970 and 2018 (with peak emissions differing from country to country). In these 24 countries, consumption-related CO2 emissions (the CO2 footprint) have also been falling since at least 2008. This clarification is important because the countries concerned have relocated part of their production (and therefore their GHG emissions) to other countries around the world. 85
For some economists, this development confirms the theory of the “Kuznets environmental curve”: beyond a certain level of income, any additional wealth also favors environmental quality and lower pollution (see the Economy, natural resources and pollution module).
If the European Union has been able to maintain economic growth while reducing its impact on global warming, this means that the world as a whole could do the same.
Two major levers must be mobilized to achieve decoupling:
- the efficient use of resources made possible by technical progress
- substituting polluting resources with others
The way in which the decoupling of greenhouse gas emissions and economic growth is envisaged is exemplary of this vision. Climate is not the only ecological challenge. However, being at the top of the ecological policy agenda, it is the most studied.
The think tank The Shift Project analyzed 17 energy transition scenarios 86 from international organizations, research agencies, NGOs and companies. This publication makes a number of observations:
Firstly, in many scenarios, GDP growth is exogenous, i.e. it does not depend on the other parameters studied. Thus, the availability of natural resources or the damage caused by global warming have, by construction, no impact on GDP: their link is simply not studied (seeEssentiel 8 on macroeconomic models).
Secondly, the scenarios assume 1/ growth in energy efficiency 87 and 2/ a drastic reduction in the carbon content of energy (fossil fuels are replaced by low-carbon energies) and 3/ to a lesser extent, energy sobriety (consuming less energy).
Last but not least, some of these scenarios also involve a major mobilization of CO2 capture techniques, whether based on reforestation or industrial techniques for capture at the time of emission or directly in the atmosphere, followed by storage in geological reservoirs.
All these developments are made possible by technical progress, itself stimulated by rising carbon prices and public support for investment and innovation. In short, the commitment to decoupling is often based on strong technological optimism.
The arguments of those who think decoupling is impossible
Once again, these arguments are based on observation of the past.
If we consider all the conditions set out in point 9.1 above, it’s clear that decoupling remains an objective, but not a reality.
An analysis of the subject of global warming alone (the most studied) is enough to convince you.
While a decoupling between growth and greenhouse gas emissions has been observed in relative terms on a global scale, or in absolute terms for certain regions of the world, at global levelCO2 emissions and more generally GHG emissions continue to grow in absolute terms. What’s more, to achieve carbon neutrality by 2050, as recommended by the IPCC, we would need to decouple at a much faster pace than has been the case to date.
According to the 2019 edition of the United Nations Environment Programme’s (UNEP)Emissions Gap Report, global greenhouse gas emissions must fall by 7.6% per year between 2020 and 2030 to limit global warming to +1.5°C.
In the study cited in 9.2, the authors distinguish three country profiles out of the 24 that have reduced their emissions in the 1970-2018 period:
- “Long-term decline”: six countries have steadily reduced their CO2 emissions since the 1970s (France, Germany, United Kingdom, Sweden, Belgium and Macedonia) at average rates ranging from -1.5% (Sweden) to -0.4% (Belgium);
- “Forming eastern bloc”: six countries of the former eastern bloc experienced a rapid reduction in CO2 emissions at the time of the dissolution of the Soviet Union, followed by a very slight decrease (average annual rates ranging from -4% for Ukraine to -1.6% for Slovakia);
- “Recent peak”: twelve countries (including the United States, Italy and Spain) experienced a peak in emissions in the mid-2000s, followed by reductions at a sometimes high rate (between -4.1% for Greece and -0.5% for the Netherlands).
These figures only concern CO2 emissions: the authors of the study point out that for the majority of countries, GHG emission reduction rates are slightly lower. We are therefore far from the levels required by international climate ambitions.
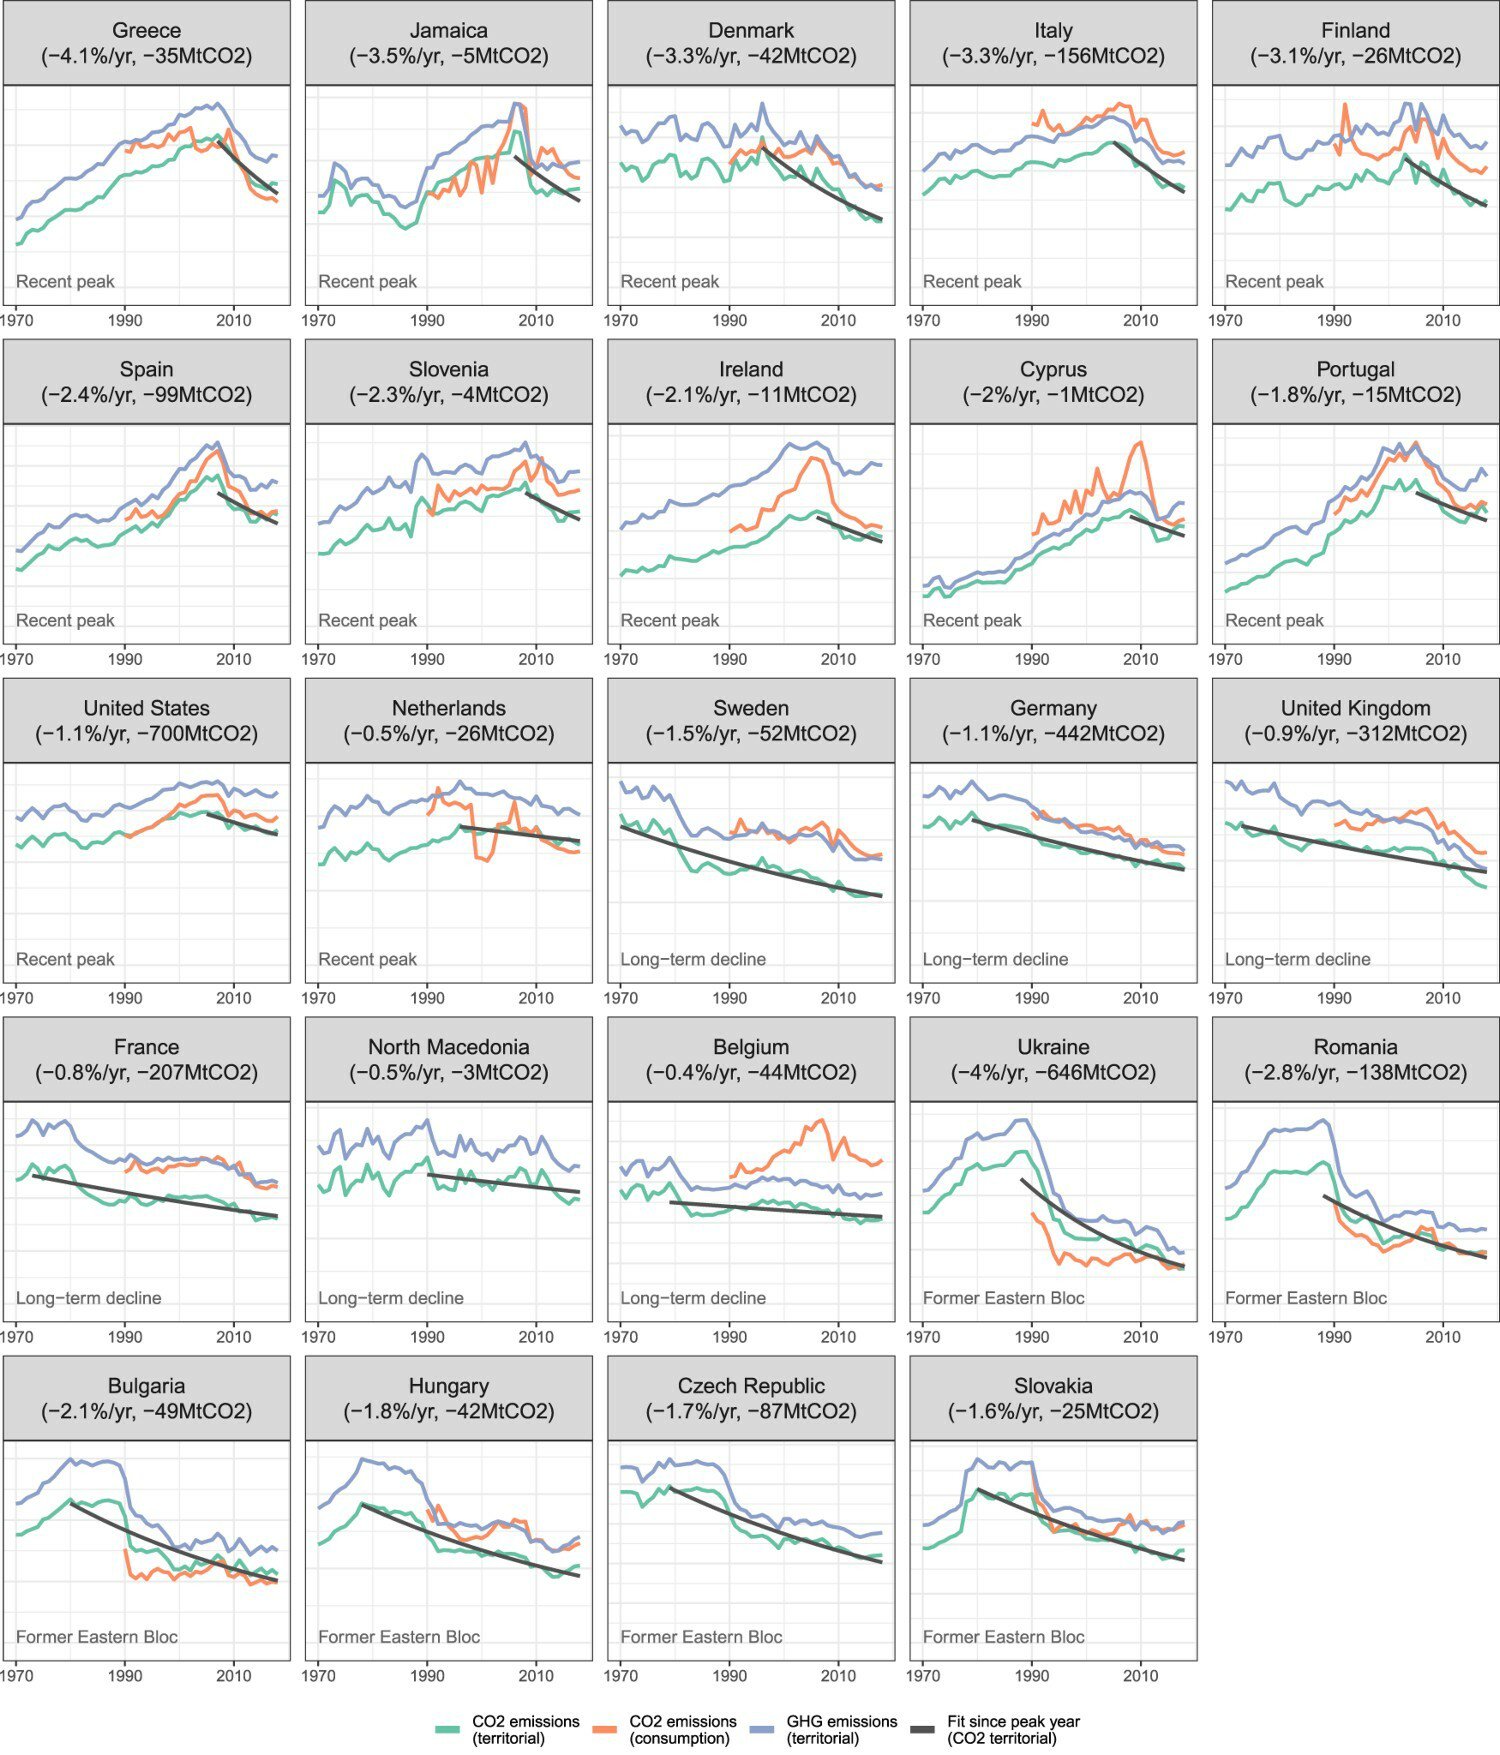
Source William F. Lamb et al. Countries with sustained greenhouse gas emissions reductions: an analysis of trends and progress by sector, Climate policy, 2021.
What applies to GHGs also applies to many other environmental impacts. Researchers have carried out a meta-analysis 88 of 179 publications on decoupling, published between 1990 and 2019. Their conclusion is unequivocal:
“The 179 papers reviewed contain evidence of absolute decoupling between impacts, including CO2 (and SOX) emissions, as well as land and water use in geographically limited cases (at the national level) relative to GDP, but no decoupling of resources for the economy as a whole, either nationally or internationally. There is no evidence of sufficiently rapid absolute decoupling at global level.”
Source: Decoupling for ecological sustainability (2020)
Belief in decoupling is based on faith in technical progress
In a study published in 2019, the European Environment Bureau highlighted the main arguments against the possibility of decoupling, which are based above all on too great a belief in the efficiency of technical progress.
Here are some of these arguments:
- The rebound effect. Improvements in energy efficiency are often partially or totally offset by a reallocation of the money saved to the same consumption (e.g., using a fuel-efficient car more often), or to other consumption that has an impact (e.g., buying plane tickets for long-haul vacations with the money saved through fuel savings). They can also generate structural changes in the economy that induce higher consumption (for example, more fuel-efficient cars reinforce a car-based transport system to the detriment of greener alternatives such as public transport and cycling).
- Technological solutions to one environmental problem can create new ones and/or exacerbate others. For example, the production of electric vehicles puts pressure on the planet’s finite resources of lithium, copper and cobalt.
89
the production of biofuels raises concerns about the use of land, particularly for food production; nuclear power plants pose problems in terms of waste management, water resources and the risk of accidents.
- Gains in material efficiency cannot be sustained indefinitely: they necessarily reach a ceiling. To make a car, you need a minimum thickness of steel, so after the initial gains, you’ll need more and more steel to make more and more cars. Another example: energy efficiency gains diminish as process efficiency approaches the thermodynamic limit. For example, “steel production consumed around 50 MJ/kg in the 1950s and was halved between the 1950s and 2000. It will very probably not be halved by 2050, as the investment required to gain a few MJ as we approach the thermodynamic limit (10 MJ/kg) becomes prohibitive.” 90
- Technological progress is undifferentiated: it does not necessarily target production factors that are important for ecological sustainability. It can lead at the same time to the development of innovations that reduce pressure on the environment and those that increase human impact on the planet.
Respecting planetary limits necessarily implies mobilizing the lever of sobriety to a much greater extent, in order to reduce material consumption and pollution in absolute terms.
Beyond the debate on decoupling
Clearly, a world in which the ecological transition has made it possible to preserve the habitability of our planet is a world in which the consumption of natural resources has been drastically reduced, as has the pollution generated by the production system.
To achieve this, we need to both reduce consumption of goods and services and increase investment. It will also mean changes in the respective weight of different sectors of the economy. Some are set to disappear (fossil fuels, the disposable industry and trade), others to gain in importance (agriculture, low-carbon energies, energy renovation, recycling, repair), still others to undergo radical transformation (transport, chemicals, digital, etc.).
The impact of these developments on GDP is not predictable. In the short and medium term, the balance between economic “gains” (linked to investments and the development of low-carbon activities) and losses (cessation of activities that pollute or consume too many natural resources) is not obvious a priori.
Furthermore, as we saw inEssentiel 3, GDP is an indicator largely based on conventions, including for the valuation of non-market exchanges. Accounting methodological adjustments could therefore also have an impact on the level of GDP and therefore on the perception of decoupling. This is exactly what has happened since the indicator was created (see box).
Projecting ourselves into a world that complies with the ecological objectives adopted by the international community means projecting ourselves into a world where the economic “rules of the game” have changed dramatically. To take just one example, if energy was cheap and easily accessible for a century, it should come as no surprise that it was wasted; conversely, a world that fights climate change is a world that decides to restrict (by various means) the use of fossil fuels, while low-carbon energies come up against numerous limits (space, raw materials, etc.).
Drawing conclusions about future evolution from the world of the past, when strong changes are assumed, is therefore not very relevant.
Symmetrically, if we don’t manage to drastically reduce our impact on nature, then the planet’s inhabitants will be increasingly confronted with planetary limits, which can only lead to tension, conflict and even war over scarce resources and humanly habitable spaces.
Imagining the world of the future in terms of ” business as usual “, as is the case with decoupling, is therefore a mistake in reasoning.
When decoupling estimates depend on the definition of GDP
In an article published at the beginning of 2024, Gregor Semieniuk analyzes the impact of changes in the definitions of GDP developed over time by statistical bodies on decoupling results. Indeed, as we explain in section 3, the calculation of GDP depends on numerous conventions and has evolved considerably over time. For example, it was not until 1977 that the non-market output of general government was included in GDP.
Gregor Semieniuk’s work shows that decoupling is not the same depending on the definition used to represent our economic history. For example, in the USA, using the definition in force in 2018, statistics show an economy that required 50% less energy between 1930 and 1980 to produce one unit of GDP. If we use the 1984 definition, progress was only 30%. For some countries, the changes are even more significant: decouplings observed with the current measure of GDP are transformed into recouplings with past definitions (and vice versa).
Source G. Semieniuk, Inconsistent definitions of GDP: Implications for estimates of decoupling, Ecological Economics (2024). The results of this article are clearly presented in Une croissance moins polluante? We still need to know what we mean by growth, The Conversation (2024).
Find out more
- “Decoupling and green growth, Carbone 4, 2021
- Less polluting growth? We still need to know what we mean by growth, The Conversation (2024)
- Clément Jeanneau, “Des nouvelles de la croissance verte”, Nourritures terrestres blog, November 17, 2020
- European Environmental Bureau, “Decoupling debunked – Evidence and arguments against green growth as a sole strategy for sustainability”, 2019
- Helmut Haberl et al, “A systematic review of the evidence on decoupling of GDP, resource use and GHG emissions, part II: synthesizing the insights”, Environmental Research Letters, vol.15, n°6, June 2020
- T.Vadén et al, “Decoupling for ecological sustainability: A categorisation and review of research literature”, Environmental Science & Policy, vol.112, October 2020, pp.236-244
- K.Lenaerts et al, “Can climate change be tackled without ditching economic growth?”, September 27, 2021
A country’s economy needs to be managed on a macro-economic level, and not just in terms of GDP.
Economic agents cannot be left to their own devices. In other words, the free market cannot achieve desirable social and environmental objectives. Public authorities have a responsibility to provide guidance. But today, in Europe and in most countries around the world, it is exercising this responsibility by focusing on a central macroeconomic objective: maximizing GDP growth, which goes hand in hand with unsustainable environmental degradation (seeEssentiel 6). How can we do otherwise?
Decreasing GDP, a repulsive objective
As developed inEssentiel 1 and inidée reçue 6, green growth is regularly invoked as the horizon for public policies to respect planetary limits.
On the other hand, the degrowth movement is often caricatured in public debate as focusing on a voluntary objective of GDP reduction, and hence economic recession. It is therefore seen as a repellent.
“For many people, reference to degrowth acts as a repellent, conveying an image of deprivation. Its detractors are quick to caricature it as a forced return to candlelight. It’s a particularly effective line of argument, because we’ve been collectively conditioned by the importance of growth and by the fear of its disappearance”.
In the business world, managers are almost always looking for ways to grow their organization: it’s very difficult to manage a reduction in a company’s sales, which means lower wages, part-time work, redundancies… As a result, business leaders are in favor of GDP growth, by generalizing this reasoning to all companies, and without taking into account the limits we discuss in this module.
More generally, critics of degrowth point to the need for growth in developing countries to achieve essential social and human objectives, and to the major problems in rich countries that a programmed recession would pose for debt sustainability, the financing of pensions and social security, and so on.
Lastly, in terms of ecological transition, the objective of reducing GDP would reduce the necessary room for maneuver, remove economic agents’ motivation to take risks and innovate, and favor the status quo, i.e. an unsustainable economy.
Wealthy movements looking beyond growth
In reality, degrowth movements and research are far richer and more diverse than the single objective of reducing GDP.
Degrowth is a planned reduction in the use of energy and resources aimed at rebalancing the economy with the living world, so as to reduce inequalities and improve human well-being.
Although the term degrowth first appeared in the 1970s 91 in the wake of The Limits to Growth report and the debate on the ecological limits to the growth of production, movements claiming to be “degrowth” have their roots in different currents of thought and intertwining philosophies.
The ecological argument and the call for a renewal of the dominant economic paradigm to integrate natural resources and pollution are obviously very present. But degrowth also draws on criticism of development policies in developing countries and anti-utilitarianism, reflections on the meaning of life in modern societies (centered on the idea of working more to earn more and consuming more), the call for renewed democratic debate and greater social justice through the reduction of inequalities.
Strategies are equally varied: they range from activist militancy opposing airport, freeway or shopping center expansion projects, to the construction of local alternatives showing that frugal, low-impact lifestyles are possible, to researchers and think tanks seeking to reform existing institutions or build a new ecological macroeconomic paradigm.
Since the beginning of the 21st century, a wealth of literature has emerged, with authors such as Giorgos Kallis, Jason Hickel, Tim Jackson, Kate Raworth, Timothée Parrique, Eloi Laurent, Dominique Meda and others.
The wide variety of people who are acting and thinking to implement the profound ecological and social transformation of our mode of development is reflected in the great diversity of terminologies used to designate the model: “welfare economy”, “stationary economy”, “post-growth economy”, “donut economy”…
At the beginning of 2021, the European Environment Agency published Growth without economic growth, which provides a good summary of the central question posed by these movements.
Economic growth is closely linked to increased production, consumption and resource use, and has adverse effects on the natural environment and human health. It is unlikely that a lasting and absolute decoupling between economic growth and environmental pressures and impacts can be achieved on a global scale, so societies need to rethink what is meant by growth and progress and what they mean for global sustainability.
Find out more
- Many resources on Timothée Parrique’s website
- Demaria et al, What is Degrowth? From an activist slogan to a social movement, Environmental Values, vol. 22, 2013, pp. 191-215
- Jason Hickel, What Does Degrowth Mean? A Few Points of Clarification, Globalizations, vol.18, September 2020, pp.1-7
- European Environment Agency, Growth without economic growth, 2021
Setting new collective horizons
Moving away from GDP growth means redefining our society’s collective horizons.
Three collective horizons need to be put back at the heart of economic governance, which is just one facet of social cooperation: well-being, resilience and sustainability.
Aiming for well-being means valuing the real determinants of human prosperity, over and above material conditions and economic well-being alone (i.e. concern for “quality of life” and human development).
Building resilience means ensuring that human well-being can withstand future shocks (particularly environmental), as illustrated by the major issue of adapting our territories to climate change.
Finally, making our societies sustainable means understanding the conditions under which human well-being can be projected and sustained over time, under increasingly severe ecological constraints, in order to draw all the consequences here and now, locally and globally.
As markets are not self-regulating, these horizons cannot be reached without genuine economic steering, which only public authorities can legitimately carry out. In particular, this means monitoring and correcting major imbalances:
- poverty, unemployment and social inequality;
- insufficient use of the means of production (whether factories or workers);
- excessive indebtedness of private agents and financial imbalances, a potential source of recession or even deflation;
- the imbalance in the balance of trade ;
- excessive pressure on natural resources (water, soil, forests, fish, etc.) and massive pollution (of water, air, soil) that can lead to global imbalances (global warming, collapse of biodiversity – see the Economy, natural resources and pollution module).
It’s up to the public authorities to correct imbalances (at least the most significant ones, within margins of appreciation to be defined) and to try to prevent them from occurring.
It’s not a question of aiming for perfection and clockwork precision, but of thinking in orders of magnitude to change course and avoid negative spirals.
To achieve this, it is essential to move away from GDP and the growth target by adopting alternative indicators, but, as we saw inEssentiel 7, this is not enough.
An indicator is designed to show whether public policies are moving in the right direction. It is not enough to steer an economy.
As Aurore Lalucq writes, we need to “study the practical consequences of a change of model: how do we replace GDP in collective bargaining and budget voting? How do we finance our social model? And what about the financial markets, whose very existence is intrinsically linked to perpetual growth?
More generally, the aim is to reverse the deregulation and deregulation of recent decades, and restore full control of economic policy tools (budget, currency, standards and regulations, financial supervision, etc.) to public authorities.
This means restructuring the respective roles of the market, the state (including the European level) and local communities. It’s up to governments to set the framework, the national and international rules of the game, to set the necessary social and ecological limits for private enterprise, and to give territorial communities the freedom they need. The management of common goods, whether local, national or international, cannot be reduced to the marketing of access or use rights, and even less to their privatization.
Preconceived notions
Rising productivity is the main source of GDP growth
The majority of economists are convinced that GDP growth is primarily due to growth in labor productivity. 92
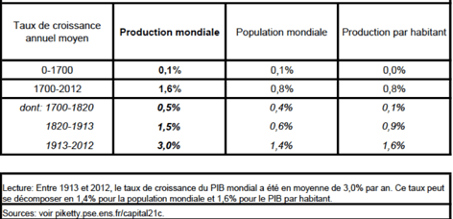
Source Economist Thomas Piketty ‘s website – For detailed figures on France, see the Work and unemployment module.
It’s obvious that human productivity growth has improved substantially since the Industrial Revolution and the successive processes of mechanization, industrialization, automation and robotization it has enabled.
Agriculture: a particularly striking case
In France, we’ve gone from “4 million farms in 1929, to 2.3 million in 1955, and fewer than 400,000 today. If the trend of the last two decades continues, we should have 250,000 farms by 2030.” 93
The figures for the number of people working on farms are even more revealing, as today’s farms hardly provide a living for anyone other than the farm manager. In the 1930s, there were around 7 million active farmers. In 2020, there will be less than 760,000 (70% of whom will be farmers). 94 . It should be noted that agricultural policy in Europe and France, from the 1950s onwards, was designed to encourage this productivity through subsidies for increased acreage, mechanization, varietal selection and the development of pesticides. At the same time, the number of tractors rose from 20,000 in 1929 (i.e. 1 tractor per 200 farms) to 230,000 in 1954, and over 800,000 today (i.e. 2.2 tractors per farm). 95 much more powerful 96 not counting other machines.
See other examples in the Work and unemployment module
The reasoning of economists who see productivity as a driver of growth and employment
While common sense sees the replacement of man by machine as a cause of unemployment, and the history of social struggles reminds us of the extent to which mechanization has met with legitimate opposition from workers, economists, on the contrary, see productivity as the driving force behind growth and, ultimately, employment. What is their reasoning?
Productivity gains (resulting from technical progress) translate directly into a reduction in the quantity of labor required to produce a given output. This is their very definition.
This frees up labor forces, which can then be used to produce more of the same or other goods, thus becoming a source of economic growth. This has been the case for most of the industrial era, as the figures above show.
But there’s nothing automatic about this process. For production to grow, it is necessary that at the macroeconomic level :
- companies decide to increase production by investing in more capacity than they already have 97 or by creating new activities;
- additional production can be sold. Purchasing power, potentially freed up by productivity gains, must therefore be distributed to future buyers (via wage increases or price cuts) in sufficient quantities.
The diagram below illustrates three ways in which the redistribution of productivity gains can boost production.
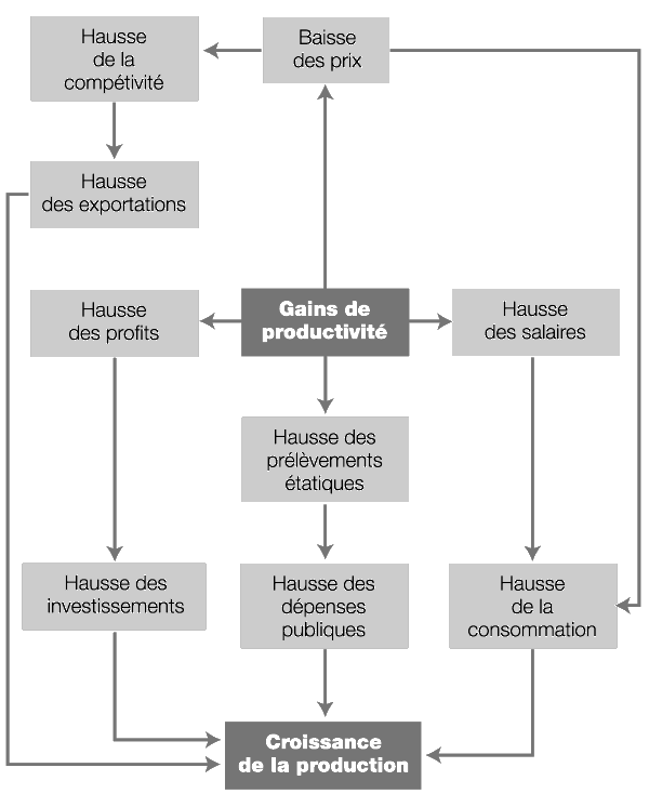
Source J.M. Albertini, E. Coiffier, M. Guiot, Pourquoi le chômage, Scodel, 1987 – diagram online here
However, these paths are not automatic: numerous biases can prevent the redistribution of productivity gains from being sufficient to enable production to flow. For example, rising corporate profits do not necessarily translate into investment (see Myth 2). The government, for its part, may raise taxes to pay down part of the public debt. Finally, employees may receive “less than their fair share” and be unable to increase their consumption.
Let’s take the example of an (imaginary) social organization in which all employees “replaced or helped by” machines remain paid the same per hour worked 98 . As the machines partly replace them, employees work fewer hours, and the income distributed is lower. How, then, can they have enough income to buy the products they produce?
The only possible answer is: lower prices. But let’s suppose that in our imaginary world, this doesn’t happen. These products will then be unsold. Since entrepreneurs are not blind, they will anticipate this risk and not have the products made. In this imaginary economy, productivity gains are accompanied by decline and loss of purchasing power for the vast majority of employees.
Imaginary? Not really. In his book 40 ans d’austérité salariale : comment en sortir ( 40 years of wage austerity: the way out), economist Patrick Artus shows that in OECD countries, productivity per employee has risen by 50% over the past 30 years, while wages have increased by only 25%. At the same time, prices have remained stable overall. Production has grown slowly… The insufficient increase in purchasing power has been partly offset by household debt. But this compensation has its limits: lenders eventually want to be repaid.
The first effect of technical progress is to deprive people of work when they are partially or totally replaced by a machine. For this job loss to be compensated for at the collective level, growth is needed.
This is one of the reasons why production growth is still widely considered vital, despite the many studies denouncing its negative effects (seeEssentials 5 and 6). But, on the one hand, this growth does not flow naturally from productivity gains, as we have just seen. On the other hand, this growth is not a sufficient condition: GDP growth can occur without job creation. 99 .
What can be done? In a world of slow growth, or even stagnation as is currently the case, it has to be said that if productivity continues to rise (thanks to the computerization or robotization of more and more tasks), unemployment and job insecurity (involuntary part-time work and other precarious activities) can only increase, unless we organize a reduction in working hours.
The other approach is to offer public-sector jobs in so-called “non-productive” fields (the environment and personal care in priority), with a clear emphasis on training. These are the proposals for green job guarantees, for example.
In a globalized economy, macroeconomic policy should be limited to facilitating competitive supply.
What does it mean to promote a competitive offering?
For decades, the “supply-side” economic policy applied in Europe and France has aimed to promote a “competitive offer”, i.e. one that enables the country’s companies to win export market share, either because of lower prices than competitors, or for reasons of “quality”.
To achieve this, the measures put in place (known as structural measures) aim to reduce the burdens “weighing” on companies (social charges, taxes, regulations) and to encourage research and development (via favorable tax measures such as the research tax credit, for example). 100 .
At European level, these policies are in the majority, and are supposed to promote growth and reduce the gap between potential and observed growth (seeEssentiel 2). These policies also justify the “control” of public spending and the rejection of budget deficits: the aim is to avoid imposing “excessive” levies on companies.
Chancellor Helmut Schmidt is credited with formulating a now-famous slogan in 1974. It sums up the current conventional wisdom in an easy-to-remember way: “Today’s profits are tomorrow’s investments and the day after tomorrow’s jobs”. In the 1980s, this “theorem” became the mainstay of “competitive disinflation” economic policies, aimed at “restoring corporate margins”. The aim was to promote corporate competitiveness through wage and tax moderation. Initially motivated by the impact of the two oil shocks (rising inflation and growing public and private deficits), these economic policies became the norm.
Without getting into an academic debate, we’re going to show the limits and errors of this “doctrine”.
Firstly, as we saw inEssentials 5 and 6, GDP growth is neither a good indicator nor a good objective for our countries. Secondly, this doctrine is based on the idea that the development of international trade benefits all parties involved in trade; we show in the trade module (currently being written) that this preconceived idea is generally false.
But even within this “framework of reasoning” (steering by GDP and beneficial international trade as a matter of principle), this doctrine is based on three errors:
- The economy of a country like France relies not only on foreign demand, but also on domestic demand. Calibrating a policy for exporting companies alone leaves out an entire sector of the economy.
- It’s also clear that not all countries in the world can be exporters or competitive at the same time. Within Europe, there are major imbalances between the “countries of the North” (including Germany) and the “countries of the South”.
- Contrary to Jean-Baptiste Say’s “law”, a supply-side policy does not necessarily generate demand for the products and services offered, even if they are competitive.
Moreover, this doctrine has not been proven to be effective (still within the framework implicitly set out above). Since it has been applied in France, unemployment has not been substantially reduced, growth has not been achieved and the competitiveness of French companies has not improved. Indirect evidence of this is provided by companies’ demands to reduce production taxes as part of the 2021 recovery plan.
More to the point, higher corporate profits do not necessarily lead to higher investment.
In a 2017 analysis note 101 economist Patrick Artus highlights the rise in non-financial corporate profits in the USA, Japan and the eurozone over the period 1996-2017. Turning to the question of how these profits are used, he observes that they have :
- leads to an increase in the self-financing rate, thus limiting corporate debt;
- sometimes financed by higher dividend payouts and share buybacks (see misconception 5);
- everywhere, financing the accumulation of cash by companies and their external growth (via the purchase of shares in other companies).
In a more recent work 102 Patrick Artus shows that this policy has resulted in workers being paid too little. It led to current consumption being financed by credit, i.e. by debt, with no creation of value to repay the debt (see the Role and limits of finance module). The consequences have been politically deleterious, providing a breeding ground for populist parties.
In conclusion, this preconceived notion does not stand up to analysis. Macroeconomic policies don’t have to make competitiveness their priority. As we saw inEssentiel 10, they now have to prioritize investment and the orientation of public levers in the service of the ecological transition. Supply-side competitiveness is certainly an important issue, but a secondary one.
Savings are a prerequisite for investment and economic growth
For some economists, such as Friedrich Hayek, building up savings is a prerequisite for investment, which in turn is necessary for economic growth and productivity gains.
This idea of saving beforehand is in line with our intuition of a world of subsistence: we must deprive ourselves of consumption today in order to prepare for the future (wheat seeds, for example, which must be saved for future planting).
From an accounting point of view, we have already seen that GDP breaks down into consumption, investment and the external balance (seeEssentiel 3). It is therefore tempting to consider that, all other things being equal, less consumption means more investment. As companies invest in order to grow, more savings means more growth.
However, a more global reasoning allows us to highlight the following points, which cast doubt on this preconceived idea:
- The variation in financial savings between two points in time results, on the one hand, from the flow of savings between these two points in time (savings used to consume or invest and newly accumulated savings) and, on the other hand, from the flow of credit. Since banks create money, a loan generates new liquidity, which is counted as financial savings (see the module on money). If we isolate money in the strict sense of the term from financial savings, we can see that the flow of investment is equal to the flow of net savings (savings built up in the period minus dissavings in the period), increased by the flow of money creation over the period.
- The investment behavior of a company or household depends little on the savings accumulated in the national economy, and is relatively independent of the savings that the company or household in question has built up. A household will invest in a house or a car, not only because it has a personal contribution (possibly the fruit of an inheritance) but also and above all because it can go into debt to do so (a bank is prepared to grant it a loan), which depends on its income prospects. A company invests not only on the basis of its past self-financing capacity, but also with a view to making a profit, and on the basis of its ability to convince third parties to finance it.
- Savings can be mobilized to refinance existing assets (e.g. the purchase of old housing, or the purchase of financial securities such as shares or bonds already issued). In this case, savings do not finance productive investment.
- Companies invest either to grow or to achieve productivity gains, the effect of which on growth is questionable (see Misconception 1).
In practical terms, therefore, policies that encourage savings (for example, by reducing the taxation of life insurance in France) are probably not the most effective if their aim is to promote growth. On the other hand, they may pursue other objectives (such as facilitating inheritance in the case of life insurance), but that’s another debate.
Fiscal stimulus policies are ineffective
When the economy is in crisis, or simply in recession, increased public spending is often mobilized to “get out of it”. This is the so-called “Keynesian” approach, as it was theorized by Keynes between the two world wars (see fact sheet on the budget multiplier).
It was strongly contested in the 70s by neo-liberal economists, using two arguments.
- Public spending would crowd out public spending by mobilizing limited savings. We’re back to the old idea that savings are a prerequisite for investment.
- Economic agents would anticipate that any fiscal stimulus causing a deficit would subsequently be financed by higher taxes. They would therefore be led to save, thus cancelling out the effect of public spending.
According to these two assertions, fiscal stimulus policies are ineffective and even harmful. It would therefore be essential to manage public finances soundly, and to return to a balanced budget quickly after a deficit caused by a crisis, or even to generate surpluses if public debt is too high. This doctrine underpins fiscal austerity policies. It lies at the heart of the IMF’s structural adjustment programs, European budgetary policy and, in particular, the European semester. In the case of Greece, it has been put into practice in a spectacular and disastrous manner for the people.
The damage caused by the application of these programs should in itself be enough to demonstrate their futility. But it is necessary to return to the errors of reasoning that underlie it.
- As experimental economics has shown, there is no evidence that economic agents behave in a way that economists who advocate these policies call rational – quite the contrary. Economic agents don’t necessarily anticipate a tax increase, and even less so because, if it were to happen, they see no evidence that it would affect their own taxes.
- Today, savings and manpower are abundant: public investment does not crowd out private investment, but mobilizes unused, idle resources.
- The facts show that public debt can grow for a long time, and deficits can persist, without any major impact on the country’s economy (see the Public Debt and Deficit module ).
- The multiplier effect of public spending is well established. An analysis of public responses to the 2008 crisis is revealing: the United States, which accepted a larger public deficit than Europe, emerged from the crisis faster.
- Last but not least, this line of reasoning assumes the definitive establishment of the “order of debt”, as Benjamin Lemoine puts it, i.e. the obligation for governments to finance their deficits exclusively on the financial markets. A state that regains the benefit of money creation can use purchasing power created ex nihilo, which therefore needs no repayment. (see Public debt and deficit module)
Conclusion: a fiscal stimulus policy will not necessarily come up against the double wall of the crowding-out effect and the increase in precautionary private savings. This is an important conclusion at a time when the need for public investment (and public support for private investment) in the ecological transition must not be blocked by inappropriate reasoning.
Stock market indices are good indicators of a country’s economic health
Stock market index prices (Dow Jones, Nasdaq, MSCI World, Eurostoxx 600, CAC 40) are among the economic indicators that are omnipresent in public and media debate, as if their rise were synonymous with a country’s good economic health and their fall with an economic catastrophe. However, as we shall see, stock market indices and economic health are largely independent.
What is a scholarship?
When a company is set up, the founder(s) contribute resources to create the company’s share capital. This is divided into shares, allocated to the founders (henceforth referred to as shareholders) in proportion to their contribution. Ownership of these shares gives them the right to participate in decisions taken by the company’s General Meeting, as well as financial rights (via the payment of dividends).
Once issued, shares can be sold either bilaterally (over-the-counter), or publicly on organized markets known as stock exchanges (e.g. the New York Stock Exchange or Euronext). In the latter case, the value of the shares is displayed regularly (or even continuously) and varies according to supply and demand.
If the company needs new financing to invest and grow, it can issue new shares. 103 and sell them to existing shareholders or other investors over the counter or publicly, on a stock exchange. Stock exchanges, which are supposed to be capitalism’s main means of financing companies, don’t always do this. According to a recent report, “stock exchanges have not been financing the American and European economies in net flows (i.e. IPOs and capital increases minus share buybacks) for some twenty years now.” 104
Stock market quotations do not reflect the value of companies
A stock market index measures the share price trend of all (or some) of the companies listed on a stock exchange. For example, the CAC 40 covers the 40 largest French companies listed on the Paris stock exchange (itself part of the Euronext exchange).
A stock market index characterizes the financial value, at a given moment, of the companies included in the index. This value fluctuates without necessarily having anything to do with the “fundamentals” or the economic or financial health of said companies.
A company’s core value
It is supposed to represent what a company is worth. The “experts” responsible for valuing companies use a wide variety of methods, with widely differing results. All in all, if these valuations are used as a basis for actual transactions, the only reference that counts is the comparison with other similar companies, which have been the subject of similar transactions… In other words, the only observable and objective value is the price.
However, this price does not vary solely as a function of intrinsic qualities linked to the company or its “environment” (its market positioning, reputation, market dynamics, management quality, past, present and expected financial performance, etc.).
It also depends on mechanisms specific to the functioning of stock markets.
The value of a listed company can fluctuate according to the “moods of the markets”, as market operators are sensitive to a wide range of more or less well-founded information, and above all to the decisions of others.
One possible strategy for an investor is to guess what others are thinking. The price of a stock is thus determined by a self-referential mechanism based on what each person thinks the others think the others think ad infinitum. Behavioral economics has proved this point, which Keynes was the first to emphasize, with his analogy to a beauty contest, in which the most beautiful young women are chosen from a hundred or so published photographs. The winner is the reader whose selection comes closest to the six most chosen photographs. In other words, the winner is the one who comes closest to the global consensus. Keynes points out that to win this game, it doesn’t make sense to reason according to personal taste alone. In fact, you have to determine the consensus of all the other readers: if you unroll the reasoning, you’ll see that the readers choose only those candidates they think the others will elect, with the latter choosing those they think the others will elect, ad infinitum.
Fluctuations in a company’s value can also result from price manipulation, for example when a company buys its own shares. 105 . In 2019, such buybacks in the USA amounted to around $750 billion, while IPOs totalled $62 billion. In 2021, these buybacks are still massive. 106
Stock market indices provide little information on a country’s economic health
Even assuming that the indices would characterize the health of major corporations, this has only a remote relationship to the economic health of a country as a whole. For example, in the wake of the COVID-19 pandemic, the first wave of containment manifested itself in a sudden collapse of the world’s main stock market indices. However, the measures taken by governments and central banks quickly reassured investors. It took less than a year for prices to return to, or even exceed, their pre-crisis levels (see graphs below). At the same time, the productive economy as measured by GDP was in recession.
Healthy stock market indices: Nasdaq, S&P 500, Eurostoxx 600
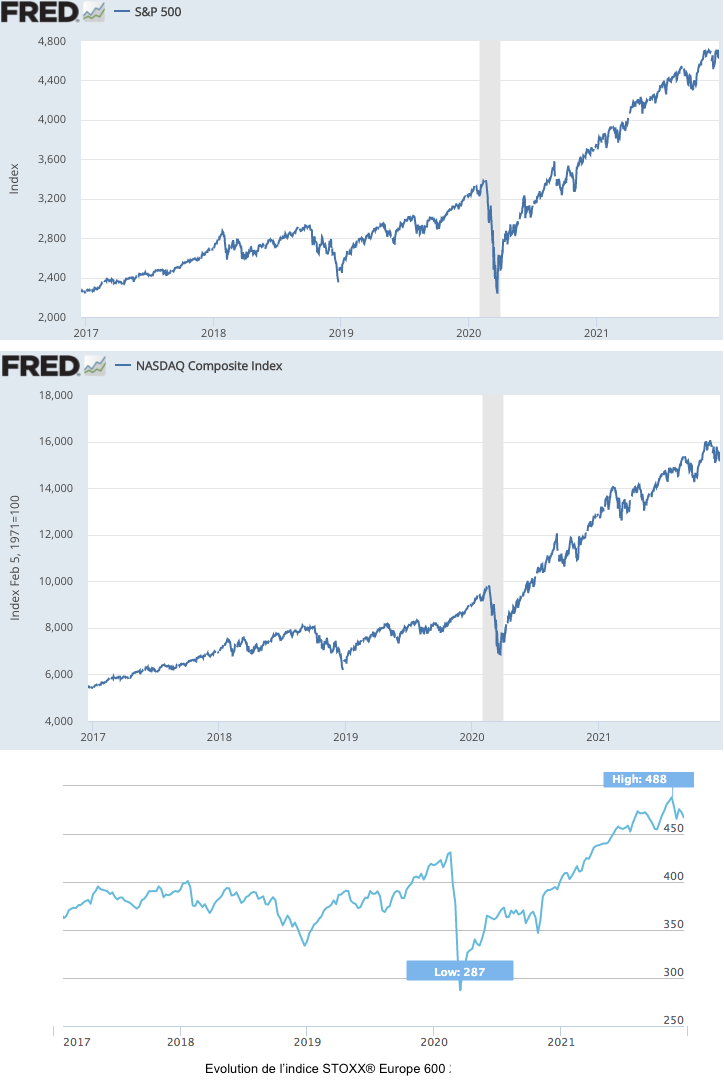
Source S&P 500, Nasdaq Composite index, Eurostoxx 600
Finally, stock market crashes (prolonged declines of over 20% in share prices) are not good predictors of recessions.
They should be, if the link between stock market indices and GDP were robust. Paul Samuelson (winner of the 1970 Nobel Prize in Economics) is credited with saying that “Wall Street crashes have predicted nine of the last five recessions”. More recently, the financial channel CNBC calculated that since 1945, Wall Street has experienced 13 crashes, resulting in only seven periods of recession in the real economy.
Green growth based on technical progress and innovation would be the path to ecological transition
Green growth, the new horizon for public policy
Faced with growing awareness of the ecological impacts of growth, most governments and economists are reacting by invoking “green” or “sustainable” growth. Rarely used before 2008, this concept is now regularly mobilized as the horizon for public policy.
“The OECD Green Growth Strategy aims to make concrete recommendations and provide measurement tools, including indicators, that will help countries generate economic growth and development, while ensuring that natural assets continue to provide the resources and environmental services on which our well-being depends.”
The emergence of the “green growth” concept
In the wake of the 2007-2008 crisis, the OECD mobilized the notion of green growth to call on governments to implement recovery plans that incorporated environmental objectives. This notion was then progressively adopted by international organizations and governments alike. 107 . Today, it is at the heart of the sustainable development agenda adopted by the UN General Assembly in 2015. At European level, the Green Deal launched in 2019 is presented as the Union’s new growth strategy.
Green growth is based on the following ideas:
- Growth is crucial to finance the technological innovation and investment required for the ecological transition (see here, for example), as well as measures to support the most vulnerable households and sectors (training and retraining assistance in sectors affected by the transition).
- The transition itself will be a driver of growth because of the massive investments it requires, generating activity, employment and therefore GDP in a society where underemployment is massive.
In operational terms, green growth is made possible by decoupling GDP from impacts on nature, whether in terms of pollution or the over-exploitation of natural resources (seeEssentiel 9).
The aim is therefore to mobilize technical progress and innovation on a massive scale to make production more efficient in its use of natural resources, and to replace polluting, carbon-intensive technologies with “green”, decarbonized alternatives.
There’s no denying that science and technology are among the tools that need to be mobilized to drive the ecological transition. However, we must emphasize here that this will not happen spontaneously, by leaving it to “market forces” alone.
Today, technological progress is indiscriminate, favoring both environmentally-friendly and polluting technologies. We need to guide and subsidize the research and deployment of green technologies, while at the same time penalizing or even prohibiting the development of technologies that consume large quantities of natural resources and pollute.
Moreover, technical progress alone will not suffice.
Digital technology, a good example of how technology is not questioned
Long heralded as an ally of the ecological transition because it enables the dematerialization of the economy, the digital industry is, contrary to popular belief, highly material and polluting. Today, however, digital growth is seen as an objective at least equal to the ecological transition. 108 This is irrespective of the questioning of digital uses and their contribution to the common good. Reflections and measures to limit the ecological impact of this sector are only just emerging.
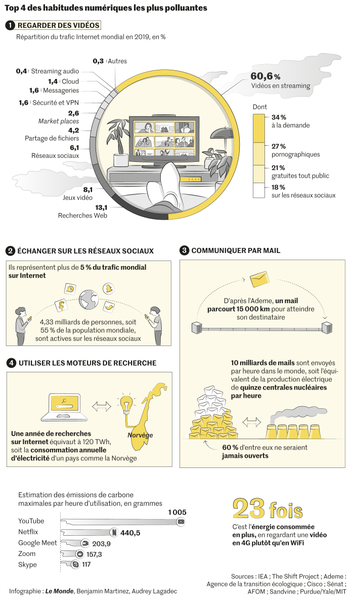
Source Pourquoi le numérique contribue de plus en plus au réchauffement climatique, Le Monde, 2022
The limits of green growth
Green growth is therefore based above all on a belief in the ability of technological innovation and progress to provide solutions to the ecological crisis. This “techno-optimistic” vision, well illustrated by the eco-modernist manifesto, comes up against several pitfalls.
On a theoretical level, most economists working on growth reason without taking nature into account (seeEssentiel 8 on macroeconomic models). Those who have attempted to integrate exhaustible natural resources into their model can only maintain unlimited growth if technical progress enables an infinite increase in the productivity of natural resources (i.e. a permanent reduction in the quantity of resources required for one point of GDP). We discuss this point in greater detail in the module Economics, natural resources and pollution.
From an empirical point of view, there are many arguments to show that technical progress is not enough.
We have already reviewed a number of them inEssentiel 9: the rebound effect which limits or even cancels out gains in material efficiency, the new ecological problems that technological solutions can give rise to, the fact that gains in material efficiency necessarily reach a physical limit at some point, the fact that recycling has limited potential in a growing economy, etc. 109 . It should be added that, in the case of global warming, a number of scenarios bet on the massive mobilization of carbon capture and sequestration technologies, most of which are not yet mature (see the Economy, natural resources and pollution module).
More generally, solving the ecological crisis will require :
- reducing global consumption of fossil fuels and energy altogether; it will not be possible to continue growing energy consumption if it is low-carbon. 110 ;
- reduced consumption of new goods and services (often disposable in the very short term), the production of which is a very significant component of GDP (think of fast fashion, for example).
These reductions can certainly be based on technological innovations, but also and above all on social innovations and the emergence of new norms that make sober behavior desirable and “normal”.
The GDP growth target will do nothing to help them. We need to develop proactive strategies to reduce consumption.
- In an article published in August 2021, economist Eloi Laurent notes that in the IPCC’s latest report (2021), the scenario for limiting warming to 1.5°C is the one “that makes human well-being and the reduction of social inequalities the two pillars of development instead of economic growth.” ↩︎
- There are many theories of growth, none of which is unanimously accepted; see a first historical introduction on the Annotations blog. ↩︎
- There is, however, a fundamental debate: for some countries, “development” has in fact been a regression. They have abandoned their landmarks, their culture, their relationship with nature, but have not benefited from the progress of modernity. In many cases, colonization has been a disaster and, under the guise of development aid, has led to real predation. ↩︎
- An economic aggregate is a synthetic quantity characterizing the national economy (GDP, investment, final consumption, etc.), obtained by combining various national accounting items. ↩︎
- See the report National income 1929-1932: Letter form the action Secretary of Commerce in response to Senate Resolution n°220 (1934). ↩︎
- By Clark and Kuznets in the United States, Meade and Stone in Great Britain, Tinbergen in the Netherlands, Vincent, Perroux and Gruson in France. ↩︎
- The System of National Accounts is developed and updated by the Intersercretariat Working Group of National Accounts, which includes the UN, OECD, IMF, World Bank and European Union. ↩︎
- Antonin Pottier, Les nouveaux indicateurs de richesse modifont-ils la croissance? Les limites de la critique du PIB, Le Débat, vol. 199, no. 2, 2018, pp. 147-156. ↩︎
- In reality, GNI (gross national income) is often used (see definition inEssentiel 3). ↩︎
- For example, in the European Union, the Maastricht rules require states to keep their public deficit below 3% of GDP, and their debt below 60% of GDP. ↩︎
- Environmental targets are often set in relation to GDP (reducing the material intensity of GDP, the energy intensity of GDP, the carbon intensity of GDP). The European Union has set a target of devoting 3% of GDP in each country to research and development expenditure. ↩︎
- See Philippe Aghion’s video explanations, Sera-t-il possible de concilier croissance et climat? or the article L’innovation, potion magique de l’économie française, Mediapart, 2022. ↩︎
- This roadmap will be evaluated in a technical document in 2013. ↩︎
- See the Conclusions of the European Council of June 17, 2010. Three priorities are set (innovation, employment and sustainable growth), from which flow 5 objectives to be achieved by 2020 (employment rate of 75%; research budget of 3% of GDP; reduction of poverty by 25%; improvement in the level of education; and reaffirmation of the objectives of the 2008 “energy-climate package”: 20% reduction in GHG emissions, 20% renewable energy in final energy consumption; 20% energy efficiency. ↩︎
- See the Strategic Foresight 2020 report, in which resilience is defined as “the ability not only to face and overcome challenges, but also to undergo transitions in a sustainable, equitable and democratic manner”. ↩︎
- To find out more, see the article Le dogme économique au cœur du désaveu européen, Chroniques de l’Anthropocène blog, 2019. ↩︎
- From an ecological point of view, this may be more questionable. On a microeconomic level, the aim is to use the means of production to the maximum. On a macroeconomic level, we should only use those that are in line with ecological concerns. For example, is it desirable to run coal-fired power plants to the maximum in order to reduce the output gap? ↩︎
- It also includes bartered goods and services, those used to make payments in kind (to a company’s employees, for example). See the full definition on the Insee website. ↩︎
- See the full list on the Insee website. ↩︎
- The European System of Accounts 2010 (ESA 2010) is the name of the document that sets out the accounting framework applicable by all European Union member states. This means that it sets out all the rules to be followed by national accountants in drawing up their national accounts. It is an adaptation for the European Union of the System of National Accounts 2008(SNA 2008) drawn up by the United Nations. ↩︎
- These are activities that “are not observed in regular statistical surveys. This may be because the activity is informal and therefore escapes the attention of surveys focused on formal activities; the producer may also be keen to conceal a legal activity, or it may also be that the activity is illegal.” (see SNA 2008, p100, and SEC 2010, p348-349). ↩︎
- For a review of methodologies and debates on calculating the underground economy, see The underground economy in GDP: advances and limits, presentation by François Lequiller, OECD, Statistics Directorate, 2014. ↩︎
- See for example Insee’s decision to include drug trafficking in GDP calculations, Written question to Senator Arnaud Bazin, February 8, 2018. ↩︎
- Source: SEC 2010, p.65. Operating surplus and mixed income correspond very schematically to the producer’s margin (before interest payments on debt, taxes, dividends, etc.). See section C/ GDP by output for further explanations. ↩︎
- i.e. compensation of employees + intermediate consumption + depreciation of public capital(SEC 2010, p.66) ↩︎
- See, for example, André Vanoli, A History of National Accounting La Découverte, 2002. ↩︎
- SEC 2010, p.76. ↩︎
- Less “payments for non-market production”, i.e. the receipts (such as museum tickets, school fees, hospital charges, etc.) that UPAs sometimes derive from non-market production. In 2019, these payments accounted for €10.4 billion of the €427 billion NPP. ↩︎
- The acquisition is not necessarily a purchase: it may be the result of production for its own end use: for example, a company building a new factory building, or carrying out R&D work or developing software for its own use. ↩︎
- These include armored vehicles, warships, submarines, combat aircraft, transporters and missile launchers. ↩︎
- More details in Les comptes nationaux passent en base 2010, Insee, 2014. Note that the calculation of previous years has also been modified to take account of these methodological changes and provide consistent long series. ↩︎
- See SCN 2008, p.35. ↩︎
- PIN = GDP – CCF. See the evolution of the CCF in France in the variation of assets accounts Series 8.211 and following. ↩︎
- Other taxes on production” are paid as a result of production activity, irrespective of the quantity or value of goods and services produced (e.g. taxes on the ownership or use of land, buildings and other structures used for production purposes, payroll taxes, property taxes, etc.). They differ from “product taxes”, such as VAT, which are due per unit of good or service produced or traded. The term “net” means that “other subsidies on production” received from public administrations have been deducted from the amount of taxes. ↩︎
- A sole proprietorship (EI) is a company that does not have a legal personality separate from its manager (farmer, small businessman, craftsman, liberal profession, etc.). This is why EI accounts are included in the household sector. See Insee definition. ↩︎
- Eloi Laurent, Sortir de la croissance : mode d’emploi, éditions Les liens qui libèrent, 2021, p.19. ↩︎
- See National income 1929-1932: Letter form the action Secretary of Commerce in response to Senate Resolution n°220, 1934, p.6. ↩︎
- At international level, the latest revision of the classification of economic activities dates from 2009. This is ISIC Rev 4 (International Standard Industrial Classification of all branches of economic activity – revision 4). ↩︎
- France is home to 4 of the world’s 30 systemic banks. In the UK, the value added of financial companies has fluctuated between 6% and 8% since 1995. Source: Eurostat(VA of financial companies and VA of total economy) ↩︎
- Acronym for Google, Apple, Facebook, Amazon and Microsoft. ↩︎
- This is due in particular to the research time required to draw up new standards and conventions. This statistical inertia is also essential because of: 1/ the considerable resources required in each country to update national accounting standards, and 2/ the need to avoid statistics that fluctuate too much and are influenced by the context. ↩︎
- See, for example, Au-delà et autour du PIB : questions à la comptabilité nationale, Insee, 2020, part II “Nouvelles formes de production : numérique et services gratuits”. ↩︎
- Resident units are economic players who carry out their main economic activity on the territory for more than one year. The question of nationality is therefore irrelevant. ↩︎
- Jean-Paul Piriou, Jacques Bourny and Vincent Biausque, La comptabilité nationale, La Découverte, 2019. ↩︎
- See, for example, La comptabilité nationale face aux défis du numérique et de la mondialisation: comment continuer à faire bien parler le PIB, Insee blog, February 12, 2020; Didier Blanchet, Faire parler les comptes nationaux: l’importance du vocabulaire, Variances, August 26, 2021. ↩︎
- Richard Easterlin, “Does Economic Growth Improve the Human Lot?”, in Paul A. David and Melvin W. Reder, Nations and Households in Economic Growth: Essays in Honor of Moses Abramovitz, New York, Academic Press, 1974. ↩︎
- That is, adjusted for inflation. ↩︎
- Du PIB au PIB ressenti : en retrait sur le PIB, l’Europe dépasse désormais les États-Unis en bien-être monétaire, Insee analyses, 2020, graph numéro 2. ↩︎
- More information in the Work and unemployment module. ↩︎
- The Gini coefficient is an income distribution indicator calculated from income (after taxes and social transfers) adjusted for household size. Its value ranges from 0, which corresponds to “perfect equality” (each person receives the same fraction of income), to 1, which represents “perfect inequality” (the richest fraction of the population receives all income). Find out more on our fact sheet: How do you measure monetary inequality? ↩︎
- Source: Society at a Glance 2019, OECD, chapter 6. ↩︎
- For more details on the concept of weak sustainability, see the Economy, natural resources and pollution module. ↩︎
- The term geoengineering is used to designate all projects aimed at modifying the Earth’s climate and global environment, in particular with a view to combating global warming. Examples include sending mirrors into orbit to reflect the sun’s rays, projecting millions of sulfur particles into the stratosphere every year to have a cooling effect on the climate, or “fertilizing” the ocean with iron sulfate to enable the development of phytoplankton, which stores CO2. Find out more on Wikipedia and in a dedicated program on France Culture. ↩︎
- Will Steffen et al, “The Trajectory of the Anthropocene: The Great Acceleration”, The Anthropocene Review, vol. 2, no. 1, Jan. 2015, pp. 81-98. ↩︎
- Richard Auty, Resource-Based Industrialization: Sowing the Oil in Eight Developing Countries, Clarendon Press, Oxford, 1990; Jamal Azizi, Pierre-Noël Giraud, Timothée Ollivier, Paul-Hervé Tamokoué Kamga, Richesses de la nature et pauvreté des nations, Essai sur la malédiction de la rente minière et pétrolière en Afrique, Presse des Mines, 2016. ↩︎
- A synthetic indicator groups together numerous indicators expressed in multiple units (dollars, years, percentages, etc.). To be able to compare and aggregate values expressed in different units, they need to be normalized, i.e. converted into the same unit (e.g. a number from 0 to 1). Each variable must then be weighted, i.e. given a greater or lesser weight in the final indicator. ↩︎
- The HDI was developed by the United Nations Development Program (UNDP), based on the work of economist Amartya Sen. Numerous other indicators have been developed alongside the HDI to account for inequalities, gender disparities, extreme poverty and environmental sustainability. All data can be downloaded here. They are analyzed in the annual Human Development Report published by the UNDP since 1990. ↩︎
- The 11 criteria (housing, income, employment, social ties, education, environment, civic engagement, life satisfaction, security, work-life balance) are calculated from 1 to 4 indicators. All data are available on the OECD website. Information on the standardization and weighting of each indicator can be found here. ↩︎
- Food products, livestock and fishery products, wood, built-up areas used for urban infrastructure, etc. ↩︎
- Nordhaus W., Tobin J., “Is Growth Obsolete? “, in The Measurement of Economic and Social Performance, Studies in Income and Wealth, National Bureau of Economic Reasearch, vol.38, 1973. More details on the ENS Lyon website. ↩︎
- Twelve of these indicators describe average levels of current well-being, twelve describe inequalities in current well-being, and twelve describe the resources required for future well-being. ↩︎
- For example, the European Semester, the Common Agricultural Policy, the Biodiversity Strategy, the 7th Environmental Action Plan, the European Social Charter, the EU Transport Scoreboard, etc. ↩︎
- See the article by Jean Gadrey, “Du PIB au PIB vert ou comment compter la richesse autrement”, Cosmopolitiques, n°13, October 2006. ↩︎
- Kate Raworth, La théorie du Donut, French version published by Editions Plon (2018). See Le Monde. Kate Raworth’s work continued at the Doughnut Economics Action Lab, a research center created in 2019. ↩︎
- The latest Wealth Indicators report, however, dates from 2018. See the 2015, 2016, 2017, 2018 reports. To find subsequent data, please refer to the Insee website. ↩︎
- Eloi Laurent, Inscrire les indicateurs de bien-être et de soutenabilité au cœur du débat budgétaire, OFCE Policy Brief, 2017. ↩︎
- See, for example, the Greenness for Stimulus Index, developed by the company Vivid Economics, the Global Recovery Observatory, developed by Oxford University, or the analyses of Finance Watch for certain European countries. ↩︎
- There is a profusion of macroeconomic models, particularly in the academic world, but we’ll limit ourselves here to those used as a basis for public decisions, or to evaluate them, in the major public institutions (Ministries of Finance, European Commission, IMF, etc.). ↩︎
- See for example the note Le recours à la modélisation macroéconomique dans l’évaluation des politiques publiques, Trésor-eco n°252, December 2019. ↩︎
- On this last point, it is well established that growth in human productivity, i.e. the ratio between quantities produced and population, improved substantially with the industrial revolution and the processes of mechanization/industrialization/automatization/robotization it enabled (see module Work and unemployment). Since the end of the 2000s, labor productivity has been slowing down in developed countries, and this has been the subject of much debate among economists in an attempt to explain this phenomenon. See Martin Anota, Pourquoi la productivité du travail augmente-t-elle moins vite depuis la crise financière, Alternatives économiques, June 26, 2018. ↩︎
- In fact, it would be necessary to analyze this equation in greater detail, as the terms vary greatly from one industry to another and from one trade to another. But we don’t need to go into that analysis here. ↩︎
- To find out more about the theoretical arguments underlying the possibility of infinite growth despite limited natural resources, see the module Economics, natural resources and pollution; in this module we also address the question of substitutability between different capitals, as well as the belief in the saving power of technology (which we also develop inMisconception 6). ↩︎
- Inspired by the work of Keynes, in the 1930s-1940s these researchers built a theory of growth showing that it is structurally unstable. Read more in Martin Anota, Les théories de la croissance, Annotations blog, September 1, 2012. ↩︎
- Faced with the risk of a possible shortfall in this “willingness to buy”, industries have massively developed advertising and marketing techniques to “boost” it – which poses numerous problems, given that respect for planetary limits requires a certain sobriety on the contrary – but there’s no guarantee that this will be enough to ensure that products systematically find sellers. ↩︎
- More details inMisconception 1. ↩︎
- This theory is presented in the article Richard A. Werner, Towards a more stable and sustainable financial architecture – a discussion and application of the quantity theory of credit, Kredit und Kapital, vol.46, n°3, 2013, pp. 353-389. ↩︎
- In general equilibrium models, the labor market is also assumed to be in equilibrium at all times: labor demand and supply are equal, with wage variations allowing for adjustment. ↩︎
- The two functions used are either CES functions(Constant Elasticity of Substitution) or Cobb-Douglas functions (which are special cases of CES functions). ↩︎
- It was the interaction with other sciences (in particular the contributions of Boulding and Georgescu-Roegen) that opened up economics to physics. ↩︎
- Growth accounting involves econometrically decomposing GDP growth according to the contribution of each factor of production, and attributing the residual to TFP. Economists Felipe and McCombie have shown that all this type of econometric exercise captures is an accounting identity that is always true. See Jesus Felipe, John McCombie, The Illusions of Calculating Total Factor Productivity and Testing Growth Models: From Cobb-Douglas to Solow and to Romer, April 2019. See also Steve Keen, L’imposture économique, éditions de l’Atelier, 2017. ↩︎
- See in particular Paul M. Romer, “Endogenous technological change”, Journal of political Economy, vol. 98, n°5, 1990, pp.71-102; Robert J. Barro, “Government spending in a simple model of endogenous growth”, Journal of political economy, vol.98, n°5, 1990, pp.103-125; Robert E. Lucas Jr, “On the mechanics of economic development”, Journal of monetary economics, vol.2, n°1, 1988, pp.3-42. ↩︎
- Exhaustible resources (fossil and fissile energies, minerals) are the first to be considered. However, so-called renewable resources (fish, agricultural soils, trees, etc.) are also of concern, as they are often exploited at rates that exceed their natural capacity for renewal. ↩︎
- Source: EDGAR country files (consulted in December 2021 – World selection, Group by sector, all GHG, Capita per GDP). Note that these emissions do not take into account land-use changes (land use, land-use change and forestry, known as LULUCF in official sources). ↩︎
- Source: Climate Change 2021 – The Physical Science Basis, Summary for Policymakers, IPCC Working Group 1 report (figure SPM4). ↩︎
- On this topic, see Wood, R. et al, ” Beyond peak emission transfers: Historical impacts of globalization and future impacts of climate policies on international emission transfers.” Climate Policy, vol.20, 2020. ↩︎
- The Shift Project, Climate energy scenarios: assessment and instructions for use, in partnership with AFEP, November 2019. ↩︎
- At the microeconomic level, the energy efficiency of a machine or dwelling refers to the fact that it requires less energy to perform the same function. At the macroeconomic level, energy efficiency translates into a drop in the energy intensity of GDP (i.e. less energy is needed to generate one point of GDP). ↩︎
- See also two other meta-analyses on the subject. Jason Hickel, ” Is Green Growth Possible?”, New Political Economy, vol.25, n°4, pp.469-486; Helmut Haberl et al, ” A systematic review of the evidence on decoupling of GDP, resource use and GHG emissions, part II: synthesizing the insights “, Environmental Research Letters, vol.15, n°6, 2020. ↩︎
- As part of the GENERATE project (2017-2020), IFPEN estimates that, depending on the 2°C scenarios, cumulative cobalt consumption could reach between 65% and 83% of currently known resources. In addition, almost 90% of copper resources would be extracted by 2050. ↩︎
- Olivier Vidal, ” Mineral resources, technological progress and growth “, Temporalités, n°28, 2018. ↩︎
- See, for example: André Amar, “La croissance et le problème moral”, Les cahiers de la Nef, 1973; Nicolas Georgescu-Roegen, ” Demain la décroissance : entropie-écologie-économie “, 1979; André Gorz, Écologie et liberté, éditions Galilée, 1977. ↩︎
- Labor productivity refers to the ratio between the output produced, measured in physical terms (number of cars produced, for example) or in monetary terms (in which case we use value added), and the labor required to achieve it (measured either in hours or jobs). For more detailed definitions, see the Insee website or the SES Webclass website. ↩︎
- See Bertrand Valiorgue, Refonder l’agriculture à l’heure de l’anthropocène, éditions Le bord de l’eau, 2020, p.15. ↩︎
- See Jean Molinier, “L’évolution de la population agricole du XVIII° siècle à nos jours”, Economie et statistique, n°91, pp.79-84 and Recensement agricole 2020, Agreste, December 2021. ↩︎
- See L’Atelier Paysan, Reprendre la Terre aux machines , Seuil, 2021, pp.41-42. ↩︎
- John Deere’s first tractor, in 1918, made 16 horsepower. The average horsepower of tractors sold in France in 2019 was almost 150… ↩︎
- Replacing ten workers with one machine leads to productivity gains, but does not increase production. To do so, you either have to invest in another machine, or use those ten workers for something else. ↩︎
- In other words, their wages are not a function of their productivity (marginal or otherwise), contrary to the neoclassical economic view that claims this to be the rule. ↩︎
- See, for example, Michel Husson’s article Et si la croissance ne créait pas d’emplois, 2010. ↩︎
- See a report on this instrument in France: Évaluation du crédit d’impôt recherche, avis de la CNEPI, 2021, and an article in La Tribune summarizing this report. ↩︎
- Are today’s profits tomorrow’s investments? No, Natixis, Flash Économie n°1528, December 22, 2017. ↩︎
- See Patrick Artus, 40 ans d’austérité salariale. Comment en sortir, published by Odile Jacob, 2020. ↩︎
- The company can also take out bank loans or issue bonds on the financial markets. ↩︎
- See the study Éclipse ou crépuscule ? Pourquoi les Bourses n’ont plus la cote, Institut Messine, February 2021, and the Alternatives Economiques article summarizing this study. ↩︎
- When a company buys back its shares, its share price automatically rises. When a company buys back its shares, the repurchased securities are generally destroyed. This reduces the capital and the number of shares. This mechanically improves the stock’s short-term value. It’s a technique for distributing money to shareholders, at the expense of investment and the company’s other stakeholders. See Rachats d’actions : quand le capitalisme tourne en rond and Les rachats d’actions record en Bourse relant le débat sur le partage de la valeur avec les salariés, Le Monde, December 24, 2021. ↩︎
- Source: Les grandes entreprises relancent les plans de rachats d’actions, La Croix, May 5, 2021; IPOs: 2019 est le pire millésime depuis trois ans, Les Echos, January 2, 2020 ↩︎
- See for example: ” Declaration on Green Growth “, OECD, 2009; ” Towards green growth “, OECD, 2011; ” Inclusive Green Growth. The pathway to Sustainable Development, available ” World Bank, 2012; ” Towards a green economy. Pathways to Sustainable Development and Poverty Eradication “, UNEP, 2011. ↩︎
- At European level, the development of digital technology has been placed on the same level as the Green Pact among the European Commission’s strategic priorities. Even within the text presenting the Green Pact, the digitization of the economy occupies an important place. ↩︎
- See the article by François Grosse, Le découplage croissance / matières premières – De l’économie circulaire à l’économie de fonctionnalité : vertus et limites du recyclage, Futuribles, 2010. ↩︎
- Fossil fuels currently account for around 80% of the world’s energy consumption: the growth in decarbonized energies (renewables and nuclear power) needed to replace fossil fuels is therefore unprecedented. What’s more, the development of low-carbon means of production faces numerous limits, whether in terms of financing, raw materials, social acceptability or other factors. ↩︎